Out of the Box Test - WebGUI
The purpose of this tutorial is to show you how to utilize WebGUI tool to analyze, save, import logs captured by Amari Callbox and UE sim. Once you get familiar with the basic operations of WegGUI, you can use this tutorial as a cheatsheet for various detailed functionality of the WebGUI.
WebGUI is originally designed to view the collected the log (*.log files) in more user friendly format (in GUI), but the functionality of WebGUI has been evolving greatly, now it is much more than just a log viewer. In addition to viewing the log, it has following additional functionalities and this list would continuously increase. Personally I am always using WebGUI by default whenver I use Callbox or UEsim
- Changing options for log collection. : This is usually done in configuration file (*.cfg file) or log command in command line console. You can do the same thing in WebGUI on the fly. (NOTE : There are some log loptions that can be configured only in configuration file, but more than 95 % of the log options can be configured in WebGUI)
- Post Processing of the collected log : WebGUI provides so many types of post processing functionalities (mostly converting various kind of low layer log into graphical format) and this is what I like the best about WebGUI. You would see some of the examples of those post processing function in this tutorial and various other processing feature in other tutorials in tech-academy.
- Command Line Console : You can execute a command line consoles for each network components and perform various things as you do in standalone command line console.
- Network Monitor : Recently WebGUI started supporting Network Monitoring functionality as shown in this tutorial.
Table of Contents
- Out of the Box Test - WebGUI
- Introduction
- Summary of the Tutorial
- Test Setup
- Enabling Logging / Interpretation of Indicators
- Setup Properties and Get the log
- Change Properties for more detailed log
- Saving / Exporting the Log
- Opening the exported Log
- Analysis and Post Process
- Collecting Log from a Specified Server
- Tips : Callbox(gNB/eNB/Core Network)
- Enabling BCCH (SIB) logging
- Enabling MIB logging
- Enabling full log in eNB/gNB
- Enabling full log in MME
- Enabling full log in IMS
- Capture and Display Corenetwork Interfaces
- Launching Screen Window within WebGUI
- Displaying UE Capability Information Table
- Tx gain and Rx Gain Change
- Analyze Constellation
- Analyze Channel Response
- Checking UL Power
- Plotting TPC command values
- CRC Error Check with RB Map
- BWP Switching Verification
- Enabling CSI Decoding
- Finding the cause of RRC Release
- PHY Scheduling Analysis
- Tips : UEsim
- Troubleshoot
Introduction
WebGUI is a sophisticated web-based graphical user interface designed to streamline the analysis, management, and visualization of log files generated by Amari Callbox and UE simulators in the context of wireless communication system testing. Built on a modern client-server architecture, WebGUI acts as an intermediary between complex log data and end users, translating low-level event traces and protocol messages into accessible, interactive visual representations. Its modular design supports extensibility, allowing integration of new features as wireless technologies and test requirements evolve. At its core, WebGUI leverages advanced parsing engines to interpret protocol stack messages, applies configurable filters for targeted log analysis, and renders data through dynamic dashboards and graphical widgets. This enables engineers and researchers to swiftly identify network behaviors, debug protocol events, and validate system performance without manual inspection of raw log files. WebGUI plays a pivotal role in the wireless test and validation ecosystem by enhancing productivity, reducing analysis time, and supporting collaborative workflows through log import/export and post-processing capabilities. Its evolving toolkit, including network monitoring, command-line access, and on-the-fly configuration, reflects the growing complexity and demands of next-generation wireless development environments.
-
Context and Background
- WebGUI was created to address the need for an intuitive, graphical approach to handling the extensive logs produced during wireless protocol testing with Amari Callbox and UE simulators.
- Its architecture abstracts the technical complexity of log formats, offering a centralized platform for log management, analysis, and reporting in wireless R&D and QA environments.
- As the wireless landscape advances toward 5G and beyond, tools like WebGUI become essential for agile log processing and efficient troubleshooting.
-
Relevance and Importance of This Tutorial
- This tutorial serves as both an onboarding guide and a practical reference for users seeking to maximize the value of WebGUI in daily test operations.
- It covers core operations such as importing/exporting logs, leveraging visualization features, configuring log options, and utilizing network monitoring functionalities.
- By following this guide, users can reduce time-to-insight, minimize manual log parsing, and enhance the accuracy of network test result interpretation.
-
What Learners Will Gain
- A clear understanding of WebGUI’s user interface and workflow for log analysis.
- Hands-on knowledge of advanced features such as post-processing, dynamic configuration, and command-line integration.
- The ability to efficiently monitor network behavior and troubleshoot protocol issues using graphical tools.
- Best practices for saving, importing, and sharing logs in collaborative wireless testing environments.
-
Prerequisite Knowledge and Skills
- Basic familiarity with wireless protocol testing, such as working with Amari Callbox or UE simulators.
- Understanding of log file concepts and general networking/protocol layers is recommended.
- Experience with web-based tools and graphical user interfaces will be helpful but is not mandatory.
Summary of the Tutorial
This tutorial provides comprehensive instructions for setting up, configuring, logging, analyzing, and troubleshooting Amarisoft WebGUI primarily for use with Callbox and UEsim platforms. Below is a structured summary of the test procedures and methodologies described:
-
Test Setup
- No special hardware is required for log analysis; only Amarisoft Callbox or UEsim with WebGUI is needed.
- WebGUI can be accessed locally or remotely via a browser over LAN or WiFi.
- Ensure both Callbox and client PC are on the same subnet, with properly configured static IP addresses.
- Avoid using IPs reserved for LTE/NR software tun interfaces.
- External PC can control Callbox via SSH; connection over WiFi or company LAN is possible with proper configuration.
-
Enabling Logging and Interpreting Indicators
- WebGUI typically connects automatically to LTE services for real-time log collection.
- Manual connection/disconnection is possible if automatic connection fails.
- Check component status via WebGUI indicators; troubleshoot issues such as component failure, missing IP, or client-server connectivity as needed.
- Use the 'ping' utility to verify network connectivity between client and server.
-
Configuring Log Properties and Data Collection
- Access WebGUI by entering Callbox IP in a browser.
- For each component (ENB, MME, IMS), select the target, open the Property window, and choose desired payload types and lengths.
- Choose between using configuration file defaults ('Keep Config') or overriding with WebGUI settings.
- Once configured and updated, WebGUI will collect logs as specified.
-
Advanced Log Property Configuration
- Specify log capture conditions using the 'Level' column: 'warn', 'error', or 'debug' (for all events).
- Apply configuration before test start for complete capture from initial attach.
- Setting all to 'debug' enables full stack logging.
-
Saving and Exporting Logs
- Logs can be exported/saved via WebGUI for each active component.
- Multiple dialog boxes will appear if multiple components are active; save each log file as prompted.
- Browser/OS security prompts may require user confirmation to keep files.
-
Opening and Analyzing Exported Logs
- Open exported logs in an empty WebGUI session for clarity.
- Use the [File] button to browse and load log files (plain text or zipped).
- Loaded logs are parsed and displayed for further analysis.
-
Analysis and Post-Processing
- Post-processing functions are available via [Analytics] and context-specific tabs, depending on log contents.
- UE capability information is parsed and presented in tabular format if available.
- Throughput, rate, MCS, and SNR can be plotted per UE or globally.
- Slot-level KPIs (e.g., throughput per slot) are also available.
-
Collecting Log from a Specified Server
- Additional servers can be specified for log collection, regardless of their physical location.
- Multiple servers (e.g., for eNB, MME) can be added using the same process.
-
WebGUI Tips and Feature Utilization
-
Logging:
- Enable BCCH (SIB) and MIB logging for specific test durations; disable after capture to minimize log size.
- Enable full logging for eNB/gNB, MME, and IMS via single WebGUI actions or configuration files.
- Capture and filter core network interfaces as needed.
-
Channel and PHY Analysis:
- PHY layer scheduling and resource allocation can be analyzed by filtering for relevant channels and reviewing meta data.
- Constellation and channel response analysis require enabling PHY signal capture; ensure both *.log and *.bin files are saved for post-processing.
- UL and DL power (EPRE, SNR) can be visualized for each UE, with additional analysis for SRS, PUSCH, and PUCCH.
- TPC command values and CRC errors can be plotted for further insight into link adaptation and reliability.
- BWP switching verification is facilitated by RB map visualization and throughput monitoring.
-
UEsim-Specific Tips:
- DL power, EPRE, and SNR can be checked for PDSCH on UEsim logs.
- TPC command plotting is available for UEsim as well.
-
Other Features:
- Display UE capability tables if relevant messages are logged.
- Adjust Tx/Rx gain for eNB/gNB via the GUI.
- Enable CSI decoding for more detailed uplink reporting.
- Identify RRC release causes by inspecting NGAP logs.
-
Logging:
-
Troubleshooting Procedures
- Check if the httpd service is running properly; review status and error logs for troubleshooting.
- Restart httpd service using systemctl commands if needed.
- If issues persist, reinstall Apache (httpd) and PHP-FPM, then restart the service and reinstall Amarisoft packages for proper WebGUI configuration.
In summary, the tutorial guides users through the setup and configuration of Amarisoft WebGUI, step-by-step log collection for multiple network elements, advanced property configuration for detailed logging, export/import procedures, extensive post-processing and analytics, and practical troubleshooting workflows. All methodologies focus on maximizing the utility and flexibility of WebGUI for LTE/NR system analysis and debugging.
Test Setup
If you want just to open up the saved log and analyze, you don't need any special hardware configuration. You just need Amarisoft Callbox or UEsim installed with WebGUI package. Or you can use WebGUI even without anything installed on your side. You can remotely use the WebGUI running on Amraisoft via this link . Probably the most common envirenment where you use the WebGUI would be something as follow.
This setup shows how the Amarisoft test environment is organized when using the WebGUI for monitoring and log analysis. In this configuration, the Amarisoft Callbox runs the WebGUI server. The UE (smartphone) connects to the Callbox over the air interface. The client PC accesses the WebGUI through a standard web browser such as Chrome, Edge, or Firefox.
The Callbox provides the radio access network functionality and also hosts the WebGUI service. The client PC simply opens a browser and connects to the WebGUI address of the Callbox. This means the PC does not need any special software other than a browser. All monitoring, configuration, and log visualization are performed through the Web interface.
In the example shown here, the Callbox and the client PC are connected using a direct Ethernet cable. This allows the browser on the PC to access the WebGUI server running on the Callbox. In practical deployments, the connection can also be made through a local network or WiFi if the Callbox is connected to the same network. As a result, engineers can monitor the system, analyze logs, and control the test environment from any device that can reach the WebGUI server through a browser.

- Callbox Mini (You can specify a static IP according to this wiki)
- Callbox Classic (You can specify a static IP according to this wiki)
- Callbox Pro (Use the Network Interface Card with Static IP)
- Callbox Advanced (Use the Network Interface Card with Static IP)
- Callbox Ultimate (Use the Network Interface Card with Static IP)
- Callbox Extreme (Use the Network Interface Card with Static IP)
Set IP on the call box and Client PC in such a way that they belong to the same subnet. In this tutorial, I configured IP as shown below but you can assign any IP as long as they are in the same subnetwork.
Check on Call Box IP on your Callbox PC and remember the IP. It will be used as Web GUI Server PC you will get access to. (NOTE : If the Callbox is not configured with any IP, you can configure and assign an IP manually).
In this example step the Callbox PC and the client PC are configured so that both devices belong to the same IP subnet. This is required because the WebGUI client running in the browser must be able to reach the WebGUI server running on the Callbox through the local network. Any IP addresses can be used as long as both systems share the same subnet mask.
First check the IP address configured on the Callbox. In this example the network interface eno1 is active and assigned the address 192.168.1.101 with subnet mask 255.255.255.0. This indicates that the Callbox belongs to the 192.168.1.x subnet.
This IP address becomes the address of the WebGUI server. The client PC must therefore be configured with an address in the same subnet such as 192.168.1.100 or 192.168.1.102 so that it can communicate with the Callbox over Ethernet.
Once both devices are in the same subnet the browser on the client PC can connect to the Callbox WebGUI by entering the Callbox IP address in the browser. If the Callbox does not already have an IP address configured one can be manually assigned so that the WebGUI server becomes reachable from the client PC.

Next check the IP address configured on the WebGUI client PC. The client PC must also belong to the same subnet as the Callbox so that the browser can access the WebGUI server running on the Callbox.
In this example the network interface eno2 on the client PC is configured with the IP address 192.168.1.100 and subnet mask 255.255.255.0. Since the Callbox was configured with the address 192.168.1.101 and the same subnet mask, both devices belong to the 192.168.1.x network.
Because both systems are in the same subnet they can communicate directly over the Ethernet connection. This allows the browser running on the client PC to access the WebGUI server on the Callbox by entering the Callbox IP address. Once the connection is established the user can monitor the system and analyze logs through the WebGUI interface.

The same network setup can also be used when controlling the Callbox from an external PC. In this case the external PC works both as the WebGUI client and as the control terminal for the Callbox. After confirming that the PC and the Callbox belong to the same subnet the user can access the WebGUI through a web browser and can also control the Callbox through a remote terminal session.
To control the Callbox from the external PC the user can log in using ssh. On Linux systems ssh is typically available by default. On Windows systems the connection can be made using tools such as Putty or the Windows command line ssh client. Once the ssh connection is established the user can run commands and manage the Callbox directly from the external PC.
If the external PC is connected through WiFi or through a company LAN network the same concept applies as long as both systems can reach each other through the network. In such cases the Callbox should be configured according to the Internet access or network connectivity tutorial so that the WebGUI server becomes reachable from the external PC.
One important caution is related to the tunnel interfaces created by the LTE or NR software. Interfaces such as tun0 tun1 tun2 and tun3 are automatically created and use internal IP ranges such as 192.168.2.x 192.168.3.x 192.168.4.x and 192.168.5.x. These addresses are used internally by the LTE and NR stack and should not be used for remote access or network configuration. Using these addresses for external control may interfere with the operation of the LTE or NR software.

Enabling Logging / Interpretation of Indicators
In this section, I will talk about how to enable / start logging and several usefual indicators (icons).
In most case, when you open the WebGUI while lte service is running, the WebGUI is automatically connected to the lte service and log is being collected, but sometimes the connection might not be done automatically for some reason. You can manually connect / disconnect to each component for logging as shown below.
In Callbox, follow the instruction / comment as shown below. As you see, there are many icons and menus. Some of them are straightfoward and would not need any specific explanation, but some of them may not look clear at the first look but they can be a usefual indicators for various status if you clearly understand what it represent.
The logging function of the WebGUI is enabled and several important status indicators are explained. When the WebGUI is opened while the LTE service is already running the WebGUI usually connects to the service automatically and logging starts immediately. However in some situations the connection is not established automatically and the user must enable logging manually for each component.
In the WebGUI interface several components such as ENB MME and IMS appear in the left panel when the LTE service is running. If no status indicator is visible next to these components it means that WebGUI log collection is not enabled yet and therefore no logs are being captured.
To start logging the user selects a component such as ENB from the component list and then presses the enable button. Once logging is enabled a status indicator appears next to the selected component and log messages begin to appear in the log window.
The color of the indicator represents the connection status between the WebGUI and the selected component. A green indicator means the WebGUI is properly connected to the component and logs are being collected. A blue indicator means the WebGUI is in the process of connecting to the component but the connection is not fully established yet. A red indicator means the WebGUI failed to connect to the component. This usually happens when the LTE service is not running or when configuration parameters such as IP address or port are not correctly configured.

In UEsim, the same logic applies. For the instruction / comments, see the Callbox screenshot shown above.
When the WebGUI is opened the UE component appears in the left panel if the UE service is running. If there is no indicator next to the UE component it means that log collection has not been enabled yet and therefore no logs are being captured.
To start logging the user selects the UE component and then presses the enable button. After enabling the connection an indicator appears next to the UE component and log messages begin to appear in the log window.
Once the indicator is visible it means the WebGUI is connected to the UE component and the logs are being captured. The log window will then start displaying messages generated by the UE software, allowing the user to monitor the UE behavior and analyze events during operation.

What if it is not connected ?
Sometimes you may come across the cases where a component is not connected. There can be various reasons behind the issue and there are a few common checkpoint to find the root cause.
Sometimes a component may appear as not connected in the WebGUI even though the system looks normal at first glance. In this situation the WebGUI shows the component with a red indicator or without a valid connection status, meaning that the WebGUI cannot establish communication with the corresponding software module. This does not always mean that the component itself is completely stopped. In many cases the component process may still be running, but the WebGUI cannot reach it due to configuration issues, service startup problems, or network connectivity limitations.
When this situation occurs it is important to systematically check several common points to determine the root cause. The first step is to verify whether the component service itself has started correctly and is running without errors. The next step is to confirm that the WebGUI configuration contains the correct IP address and port information required to communicate with that component. In addition, the network connectivity between the WebGUI client and the server running the Callbox or UEsim must be verified to ensure that communication is possible. By checking these typical areas one by one the user can usually identify the reason why the component appears as not connected and resolve the problem.
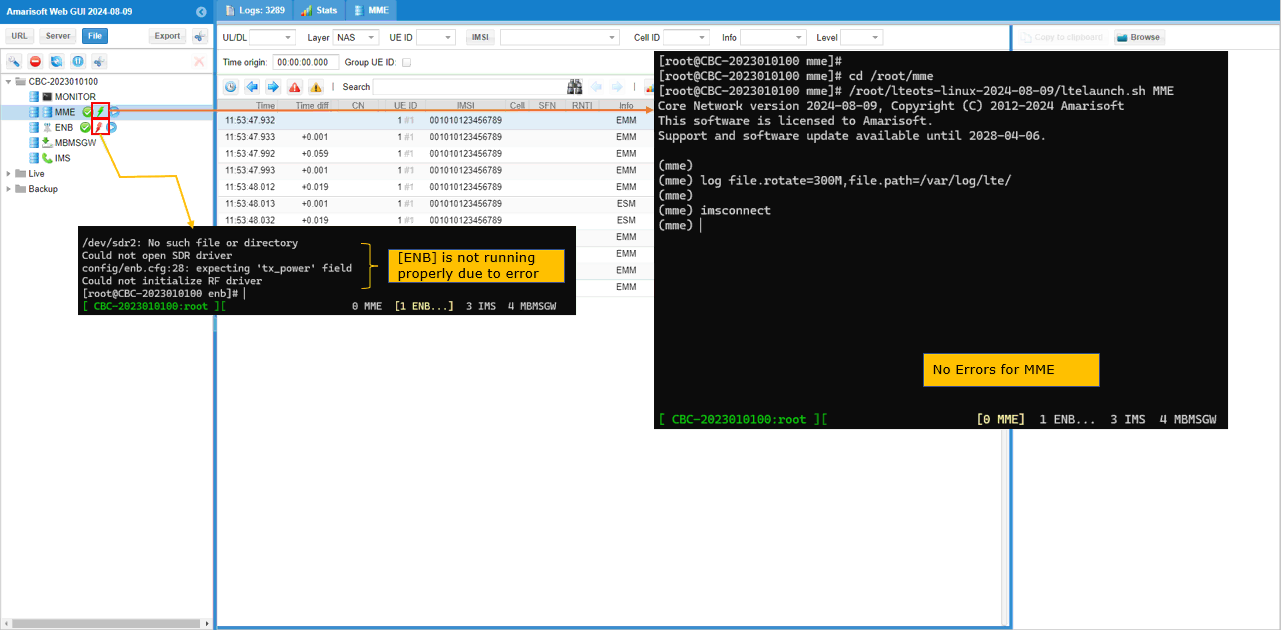
The component is not running properly
Check if each component is running problem. If you have problem with a specific component execution, you see the component marked as 'Not connected'.
If a component such as ENB or MME fails during startup, the WebGUI will show it as not connected. In this case the component console or terminal usually shows an error message. For example the ENB may fail because the SDR driver cannot be opened or because a configuration parameter is incorrect. When this happens the WebGUI cannot establish a connection to that component. If the terminal window of the component shows no errors then the component itself is probably running normally and the problem may come from another part of the configuration.
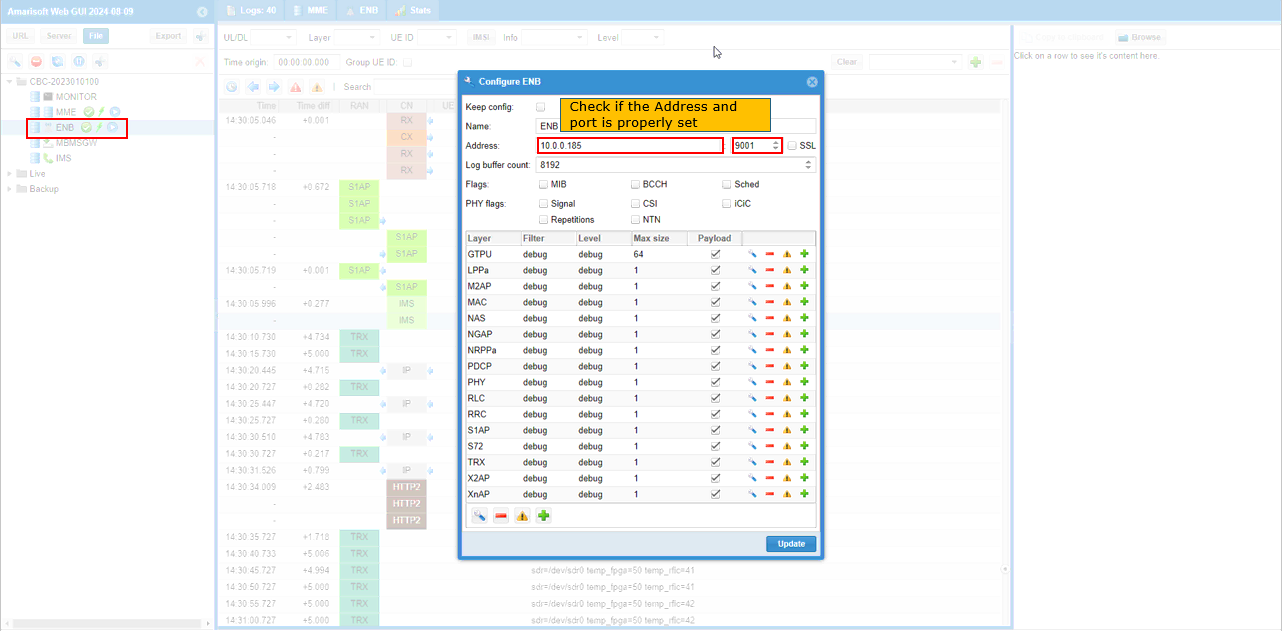
IP missing OR not properly specified
Check if IP address and port are properly set. Sometimes you may see the case where IP address is empty (not specified at all).
The WebGUI does not connect to a component automatically by guessing its location. It must know the exact network address and service port of each component so that it can open the logging and control connection properly. Each component such as ENB MME IMS or UE is associated with its own communication endpoint, and the WebGUI uses this information to exchange messages with that specific process.
If the address field is empty the WebGUI has no destination to connect to, so the component remains in a not connected state. If the IP address is present but incorrect the WebGUI may try to reach the wrong host, which also results in connection failure. The same is true for the port number. Even if the IP address is correct, the connection will fail when the port does not match the one actually used by the component. In other words both the IP address and the port number must be correct at the same time for the connection to succeed.
To troubleshoot this case the user should open the component configuration window in the WebGUI and check the connection parameters carefully. First verify that the address field is not empty. Next confirm that the IP address matches the actual system where the component is running. Then check that the port number is also correctly configured according to the service setting of that component. If any of these values are wrong the WebGUI will not be able to connect even though the component itself may already be running normally.
This type of problem often appears after system reconfiguration, IP address changes, manual setup, or when a component has been moved to a different machine. It can also happen when default values are lost or when the user opens the WebGUI from a different environment than the one originally configured. Therefore whenever a component shows not connected status without an obvious software error, checking the address and port settings should be one of the first troubleshooting steps.
WebGUI Client PC fails to get access to Server(Callbox or UEsim)
If you are running the WebGUI from different PC than Callbox/UEsim (I think this is the case for the most of users), make it sure that the WebGUI client PC can get access to the server (Callbox or UEsim). Just try ping from the WebGUI PC to server. If ping does not work, you have to fix it and get the client / server connected.
This case occurs when the WebGUI client PC cannot reach the server that is running the Callbox or UEsim. In many setups the WebGUI server is running on the Callbox or on the UEsim machine, while the user opens the WebGUI from a separate external PC using a browser. In this type of setup the browser itself may work normally, but the actual connection to the WebGUI server will fail if the client PC does not have proper network access to the server machine. As a result the component may appear as not connected even though the LTE service itself is running correctly on the server side.
This is basically a network reachability problem. Before the WebGUI can collect logs or control any component, the client PC must be able to communicate with the server IP address through the network. If the client and server are not on the same subnet, if routing is not configured properly, if a firewall blocks the traffic, or if the Ethernet or WiFi connection is not established correctly, the browser cannot reach the WebGUI server. In that case the problem is not inside ENB MME IMS or UE itself. The real issue is simply that the client PC cannot talk to the machine where those components are running.
A simple first check is to run a ping command from the WebGUI client PC to the server IP address. If ping succeeds it means that basic IP connectivity exists between the two systems. That does not guarantee that every service port is open, but it at least confirms that the client can reach the server at the network level. If ping fails it usually means there is a more fundamental connectivity issue that must be resolved first. For example the two PCs may be configured with different subnets, the cable may not be connected properly, the network interface may not be up, or the IP address may be assigned incorrectly.
In a direct Ethernet setup the client PC and the Callbox should be configured with IP addresses in the same subnet so that they can communicate directly. In a LAN or WiFi setup the same principle applies, but in addition the network path between the two machines must also be valid. The client PC should be able to reach the server through the company LAN or local WiFi network without any blocking rules that prevent access. If the server is reachable only from a certain subnet or through a certain gateway, those conditions must also be satisfied.
Therefore when the WebGUI connection does not work from an external PC, one of the first things to verify is whether the client PC can actually access the server over the network. If the ping test fails, the user should first fix the network configuration before troubleshooting the WebGUI itself. Once the network path is working properly, the browser can reach the WebGUI server, and then the component logging and control connection can be established normally.
Setup Properties and Get the log
The WebGUI can collect a very large amount of information from different components of the LTE or NR system. Instead of capturing every possible log message the user can select only the types of information that are relevant for the current analysis. This allows more focused troubleshooting and prevents the log window from being overloaded with unnecessary messages.
Launch any type of browser from WebGUI Client PC and type in the IP address of the Callbox as shown below. (Firefox, Chrome, Microsoft Internet Explorer / Edge are the ones that I personally have used, but I think any kind of browser can be used).
To begin the process the user opens a web browser on the WebGUI client PC and enters the IP address of the Callbox in the browser address bar. Once the address is entered the browser connects to the WebGUI server running on the Callbox and loads the WebGUI interface. Any modern browser can be used for this purpose. Common examples include Firefox Chrome Edge or Internet Explorer, but in practice any standard browser that supports modern web features should work.
After the browser successfully connects to the Callbox the WebGUI page appears and the user can start configuring the logging properties. From this interface the user can select which components and protocol layers should generate logs and which level of detail should be collected. This configuration step is important because it determines what type of information will be available for analysis later when reviewing the logs generated by the system.

Setup ENB Property
If you have the lte service running and refresh the page, you will get the items as shown below.
To configure the logging properties for the ENB component, first select ENB from the component list shown in the left panel. After selecting ENB, click the property icon in the toolbar. This action opens the configuration window where the logging parameters for the ENB component can be adjusted.
Through this property window the user can control how the ENB logs are collected. Various protocol layers and logging levels can be configured depending on the type of information needed for debugging or analysis. By adjusting these settings the user can focus on specific layers or events without collecting unnecessary data from other parts of the system.

After selecting the property option a configuration popup window appears. In this window the user can configure detailed logging parameters for the selected component. The user can choose which protocol layers should generate logs and can also specify the payload length that will be captured for each message. This allows the user to control how much information is recorded for analysis.
Each component has its own property window. For example the ENB property window contains logging options for the layers running on the RAN side. These include PHY MAC RLC RRC PDCP and NAS. In addition it also includes interfaces connected to the core network such as S1AP NGAP and GTPU. By enabling or disabling these options the user can decide which layers should generate log messages.
The property window also contains the keep config option. If this option is enabled the logging configuration follows the settings defined in the configuration file of the LTE system. If it is not enabled the logging configuration defined in the WebGUI interface will override the configuration file and the settings selected in the WebGUI will be applied.
Sometimes this configuration window appears automatically when the user presses the enable button for a component. When this happens the user can configure the logging options immediately in the popup window. If the popup window does not appear automatically the same configuration window can be opened manually by selecting the component and pressing the property button. Once the configuration is finished the settings can be applied and the WebGUI will begin collecting logs according to the selected options.

Once you specified the property as you want and press [Update] button, WebGUI will collect the log as you specified in the property window.
After configuring the logging properties as desired, press the update button in the property window. Once the update button is pressed the WebGUI applies the selected settings and begins collecting logs according to the configuration specified in the property window.
When the connection is successfully established the indicator next to the ENB component changes to the normal connected state. This indicates that the WebGUI is properly connected to the ENB process and that log collection is currently active.
As soon as the connection is established log messages start appearing in the log window of the WebGUI. These messages contain information generated by the different protocol layers that were enabled in the logging configuration. The user can now monitor system behavior in real time and analyze events occurring in the LTE system using the collected logs.

Setup MME Property
Now the logging configuration for the MME component can be set in a similar way. In the WebGUI interface select MME from the component list shown in the left panel. After selecting MME click the property icon in the toolbar to open the configuration window for the MME logging settings.
The MME property window allows the user to configure which core network related messages should be captured in the logs. Through this window the user can enable or disable logging for different protocol layers and interfaces associated with the MME. These logs typically include NAS signaling messages and other control plane interactions between the RAN and the core network.
Once the MME component is selected and the property window is opened the user can configure the logging parameters according to the type of information needed for analysis. After applying the configuration the WebGUI will begin collecting MME related logs and the messages will appear in the log window of the interface. This allows the user to monitor core network signaling events and analyze the behavior of the MME during system operation

After selecting the property option for the MME component a configuration popup window appears. In this window the user can configure detailed logging parameters for the MME module. Similar to the ENB configuration the user can select which protocol components should generate logs and can also specify the payload length that will be captured for each message. This allows the user to control the level of detail included in the captured logs.
Each component in the system has its own property window. The MME property window focuses on components and interfaces related to the 4G or 5G core network. These include various internal interfaces within the core network such as N8 N12 N13 N17 and S13. In addition the user can enable logging for user plane related traffic such as GTPU and IP packets as well as other signaling related components handled by the MME. By selecting the desired items the user can capture only the information that is relevant for debugging or analysis of the core network behavior.
The property window also contains the keep config option. When this option is enabled the logging configuration follows the settings already defined in the configuration file of the system. If the option is not enabled the logging configuration specified in the WebGUI interface will override the configuration file and the WebGUI settings will be applied.

After configuring the MME logging properties as desired press the update button in the property window. When the update button is pressed the WebGUI applies the selected settings and begins collecting logs according to the configuration specified in the property window.
When the connection is successfully established the status indicator next to the MME component changes to the connected state. This indicates that the WebGUI is properly connected to the MME process and that log collection is currently active.
Once the connection is established the log window begins displaying messages generated by the MME. These logs typically include signaling related to core network interactions such as S1AP procedures capability exchange messages and other control plane events. The messages appear in real time allowing the user to monitor the operation of the core network components and analyze signaling behavior as the system runs.

Setup IMS Property
Now the logging configuration for the IMS component can be set in a similar way. In the WebGUI interface select IMS from the component list shown in the left panel. After selecting IMS click the property icon in the toolbar to open the configuration window for the IMS logging settings.
The IMS property window allows the user to configure which IMS related messages should be captured in the logs. Through this window the user can enable or disable logging for different signaling components associated with the IMS system. These logs typically include SIP signaling messages and other control plane interactions between the UE and the IMS core network.
Once the IMS component is selected and the property window is opened the user can configure the logging parameters according to the type of information needed for analysis. After applying the configuration the WebGUI will begin collecting IMS related logs and the messages will appear in the log window of the interface. This allows the user to monitor IMS signaling events and analyze the behavior of the IMS system during operation.

After selecting the property option for the IMS component a configuration popup window appears. In this window the user can configure detailed logging parameters for the IMS module. Similar to other components the user can select which protocol types should generate logs and can also specify the payload length that will be captured for each message. This allows the user to control the level of detail recorded in the logs.
Each component in the system has its own property window. The IMS property window focuses on traffic related to IMS signaling and media services. These logs typically include SIP signaling messages and other IMS related communications. In addition the user can enable logging for traffic related to services such as MMS and media handling. By selecting the desired items the user can capture only the information that is relevant for analyzing IMS behavior and signaling flows.
The property window also contains the keep config option. When this option is enabled the logging configuration follows the settings defined in the system configuration file. If the option is not enabled the logging configuration specified in the WebGUI interface will override the configuration file and the WebGUI settings will be applied.
Once the desired logging options are selected the user presses the update button. After applying the configuration the WebGUI begins collecting IMS related logs according to the selected settings and the messages start appearing in the log window for analysis.

After configuring the IMS logging properties as desired press the update button in the property window. Once the update button is pressed the WebGUI applies the selected settings and begins collecting logs according to the configuration specified in the property window.
When the connection is successfully established the status indicator next to the IMS component changes to the connected state. This indicates that the WebGUI is properly connected to the IMS server and that log collection is currently active.
As soon as the connection is established log messages start appearing in the log window. These messages contain IMS related signaling and traffic information such as SIP messages and other service related events. By monitoring these logs the user can observe the behavior of the IMS system and analyze signaling flows and service related operations during system execution.

After the logging properties are configured and the components are connected the WebGUI begins collecting logs according to the selected settings. The log window then displays messages generated by different protocol layers and network components in real time.
When a UE is powered on or begins the connection procedure the log window starts showing a sequence of events generated during the attach process. These logs include various protocol messages exchanged between the UE the ENB and the core network. Messages from different layers such as PHY MAC RRC NAS and S1AP appear in the log window as the procedures progress.
Each row in the log window represents a specific event or message. The columns provide additional information such as the time the message occurred the protocol layer that generated the message and the detailed message content. By following the sequence of these logs the user can observe the complete signaling flow from the initial radio procedures to higher layer signaling and core network interactions.
This final view represents the collected logs based on the configuration selected in the property windows. It allows the user to analyze system behavior troubleshoot issues and understand the signaling flow occurring in the LTE network as the UE connects and communicates with the network.

Change Properties for more detailed log
In addition to simply enabling or disabling a payload type the WebGUI allows more detailed control of the logging behavior. The user can adjust the properties of each payload type to determine when and how the data should be collected. For example the user can configure whether the log should capture every occurrence of a message or collect the log only when certain events occur. This allows more precise control of the amount and type of information that is recorded.
These settings can be changed at any time during operation. However if the user wants the detailed configuration to be applied from the beginning of the test it is recommended to configure these options before starting the test procedure. In practice this means the configuration should be set and the update button should be pressed before powering on the device under test so that logging starts with the desired level of detail from the initial attach stage.
One of the most important parameters in the property configuration is the level column. This field determines under what conditions a particular payload will be recorded. There are three main options available which are warn error and debug. If the level is set to warn or error the selected payload is recorded only when a warning condition or an error event occurs. This is useful when the user wants to reduce the amount of logs and focus mainly on abnormal events. If the level is set to debug the selected payload is always captured whenever the event occurs. This option generates the most detailed log output and is typically used when detailed troubleshooting or protocol analysis is required.
The WebGUI also provides shortcut buttons to simplify the configuration process. Instead of manually selecting the logging level for each layer using the drop down menu the user can click the shortcut buttons to quickly change the logging level. There are also buttons that allow the same configuration to be applied to all layers at once with a single click. This makes it easier to enable detailed logging across multiple protocol layers without configuring each item individually.

As an example consider the case where the level column is set to debug for the selected payload types. When the level is configured as debug the WebGUI captures the payload every time the corresponding event occurs. This means that all messages generated by the selected protocol layers are recorded without filtering.
In this example the logging level for all ENB related layers is set to debug. As a result the WebGUI collects the full set of logs generated by the ENB component. This includes detailed messages from various protocol layers such as PHY MAC RLC RRC PDCP NAS and other related interfaces. Because the debug level records every event the resulting log contains the most complete information about the behavior of the ENB during operation.
This configuration is especially useful when detailed troubleshooting or protocol level analysis is required. By capturing every generated payload the user can follow the complete sequence of events inside the system and observe how messages are processed across different layers. However since debug level generates a large amount of log data it is typically used when detailed analysis is necessary rather than for routine monitoring.

If every payload type is selected and the logging level for all payloads is set to debug the WebGUI captures the full stack log generated by the ENB. In this configuration the WebGUI records messages from every enabled protocol layer without filtering.
As the system operates the log window displays events from different layers such as PHY MAC RLC RRC PDCP NAS and S1AP. These logs appear in the order they are generated so the user can observe the entire signaling flow from the lowest radio layer up to higher level control signaling.
Because all layers are captured the user can clearly see how messages propagate through the protocol stack. For example radio procedures from the PHY and MAC layers appear first followed by RRC signaling and then NAS and core network related messages. This full stack view allows detailed analysis of the internal behavior of the LTE system and helps identify issues that may occur during procedures such as UE attachment or session setup.
This type of configuration generates the most detailed logs and is typically used when deep protocol level troubleshooting or detailed system analysis is required.

Saving / Exporting the Log
After collecting logs through the WebGUI the captured data can be saved or exported to a file for later analysis. The WebGUI provides an export function that allows the user to store the currently collected logs into log files. This is useful when the user wants to analyze the logs offline or share them with others for troubleshooting.
To export the logs, press the export button located in the WebGUI toolbar. Once the export operation is executed, the WebGUI saves the collected log data into files. These files can later be opened again in the WebGUI or examined using other analysis tools.
The exported files typically contain logs generated by different components such as ENB, MME, MBMSGW, and IMS. These logs include protocol messages and events that were captured according to the logging configuration defined earlier.
One important point to note is that this export method does not include signal related information such as constellation data. If signal or constellation logging was enabled and the user wants to analyze those details later a different method should be used to save the data as described in this tip. .

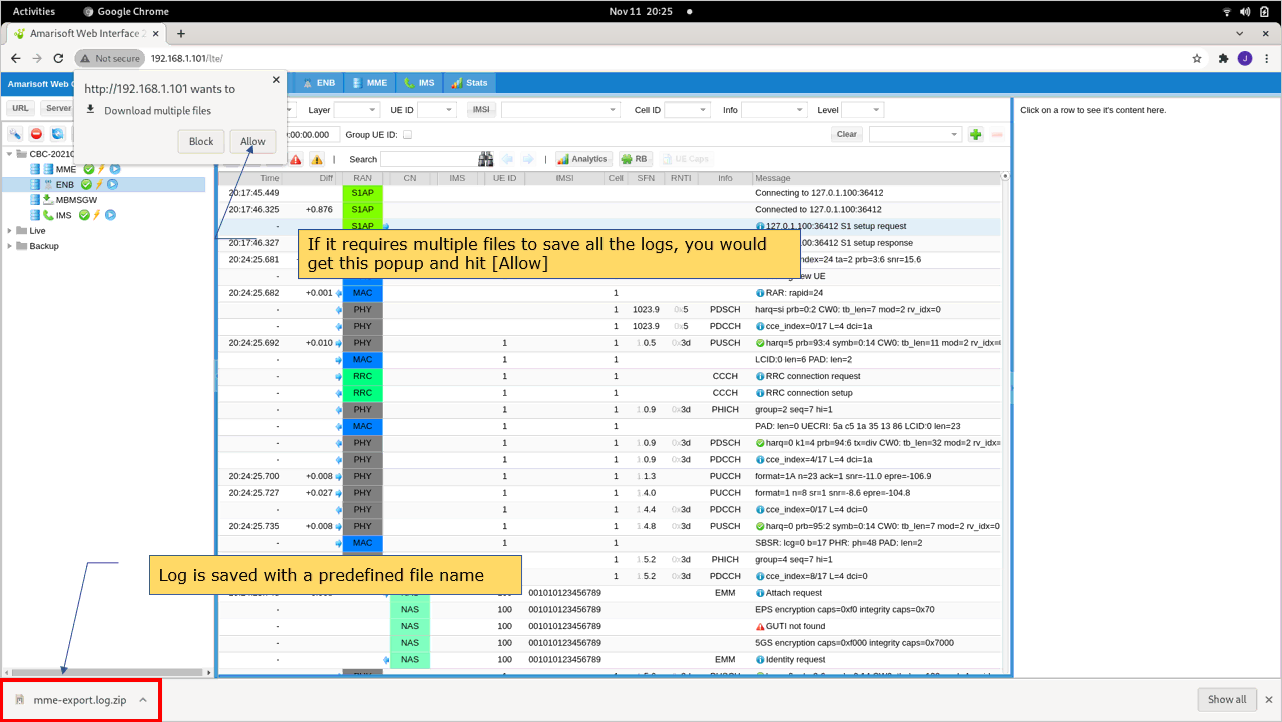
After pressing the export button a popup window appears asking for the filename. The dialog shows a default file name depending on the component being exported. For example if the ENB logs are being exported the default name may appear as enb export log. The user can keep the default name or modify it and enter a different file name if desired. After confirming the name the user presses the OK button and the log file is saved.
Depending on how many components are currently connected to the WebGUI this popup window may appear multiple times. The WebGUI exports the logs separately for each connected component. For example if the WebGUI is connected to ENB and MME the export dialog appears twice. If it is connected to ENB MME and IMS the popup appears three times so that a separate log file can be created for each component.
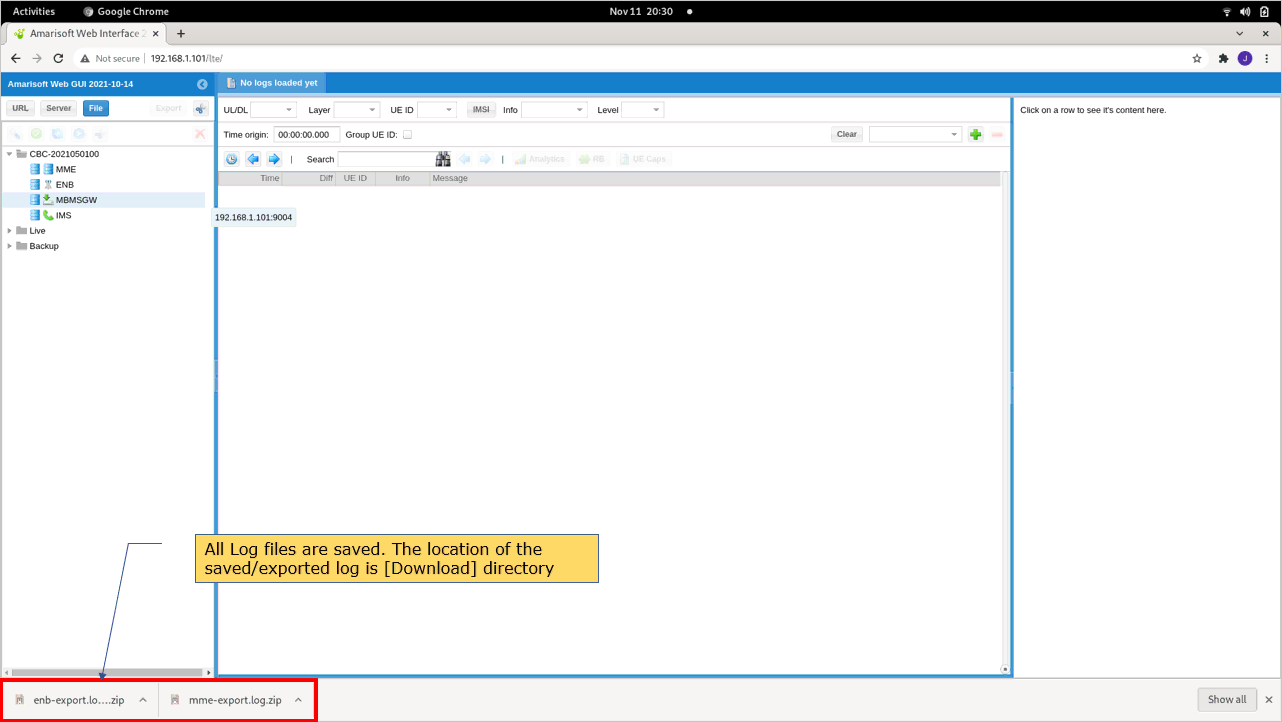
After completing these steps the exported log files can be stored locally and used for later analysis or troubleshooting. These files contain the log information collected according to the logging configuration that was previously set in the property windows.
After saving the log file for the first active component another dialog window appears for the next active component. The WebGUI exports the logs separately for each component that currently has logging enabled. Because of this the export dialog is shown again so that the log for the second component can also be saved.
The dialog window displays a default file name for the corresponding component. For example when exporting the MME logs the default name may appear as mme export log. The user can either keep this default name or modify it and enter a different file name as desired.
After confirming the file name and pressing the OK button the log for that component is saved. If additional components are active the same process continues until the logs for all enabled components have been exported. This ensures that each component log is stored as a separate file so that they can be reviewed and analyzed individually later.
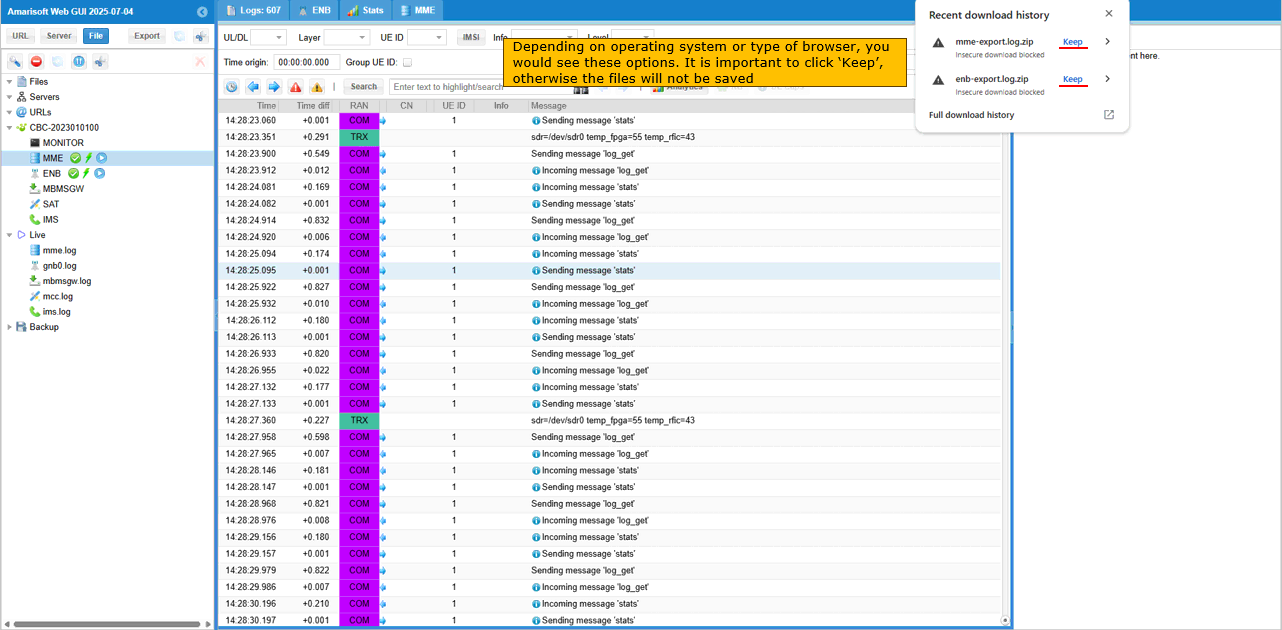
Depending on the type of browser and the operating system you are using a security warning popup may appear when the log files are downloaded. Some browsers block files that are downloaded from a local or non secure web interface and mark them as insecure downloads.
When this happens the browser may show a notification asking whether the file should be kept or discarded. In order to save the exported log file you must select the keep option for each file. If this option is not selected the browser will block the download and the log file will not be saved.
Since the WebGUI exports separate files for different components you may see this security popup multiple times during the export process. For example if logs for ENB and MME are exported the browser may show the warning twice. In this case you need to select keep for each file so that all exported log files are properly stored on your system.
Opening the exported Log
The WebGUI can be used not only to capture and save logs but also to load previously saved log files for analysis. This allows the user to review the captured logs later without needing to reproduce the test scenario again. In this section the process of loading and analyzing a saved log file using the WebGUI is described.
It is recommended to open the exported log file when the WebGUI does not already contain any active logs. If the WebGUI already has logs displayed from a running service the newly loaded logs may be mixed with the existing ones. This can make the analysis confusing because it becomes difficult to distinguish between the previously collected logs and the newly opened file.
The easiest way to start with an empty WebGUI is to open the WebGUI when the LTE service is not running. Another method is to stop the LTE service first and then refresh the WebGUI page so that the interface is cleared before loading the saved logs.
Once the WebGUI is empty the first step is to press the file button in the WebGUI interface. This opens the file related options which allow the user to load previously saved log files into the WebGUI for analysis
First, hit [File] button.

File Browser will pop up. Select the log file and hit [Open]. The log file can be a plain text file or zipped file.

Then the contents of the log is parsed and displayed as shown below.

Analysis and Post Process
Once the log contents are displayed in the WebGUI, either from real time capture or from a previously saved log file, the user can perform various analysis and post processing operations using the tools provided in the WebGUI interface. These features allow the user to examine signaling behavior, filter events, and extract useful information from the collected logs.
When the analytics function is used, the WebGUI opens additional analysis tabs that provide different views and summaries of the log data. The set of tabs that appear may vary depending on the contents of the log and the context selected in the interface. For example the results may differ depending on whether the analysis is applied to the entire log or to a specific UE ID selected in the UE ID panel.
If the log does not contain certain types of information the corresponding analysis tab will not appear. For example if the log does not include PHY layer entries that contain MCS related information then the MCS analysis tab will not be displayed. In this way the WebGUI dynamically shows only the analysis tools that are relevant to the information contained in the loaded log.
UE capability Table
If the log file contains a UE Capability Information RRC message, the message is automatically parsed into a more readable text structure by the WebGUI. The processed information can then be displayed in a tabular format so that the UE capabilities are easier to understand and review.
To view this information, click the UE Caps button in the WebGUI interface. If the log contains a UE Capability Information message, the WebGUI will extract the capability information and display it as a list showing the supported features of the UE.
This view helps the user quickly check the UE capability details without having to manually read through the full decoded RRC message in the log.
Hit [UE Caps] button.

Then all the information from the UE capability information message is automatically summarized into a tabular structure as shown below. The WebGUI organizes the decoded capability parameters into categorized entries so that the supported LTE features of the UE can be easily reviewed.
Instead of navigating through the long ASN.1 decoded text of the original RRC message, the user can simply browse the table to quickly identify the UE�s supported capabilities such as supported LTE bands, NR bands, and carrier aggregation combinations. This summarized view makes capability analysis much easier during interoperability testing or feature verification.

Throughput Plot
WebGUI provides various types of useful plots for graphical analysis. Most of these plots are available through the Analytics function. When you click the Analytics button, the Analytics (Statistics) window appears as shown below.
Select the Throughput tab to view throughput related plots. In the left panel you will see several items. The Global item shows the aggregated throughput of all UEs connected to the cell. Under the Global item you will also see multiple numbered entries. Each number represents a specific UE ID. By selecting one of these numbered items you can display the throughput plot for that particular UE.

If you click the Slot button, the WebGUI displays the statistics (KPI) for each slot. For example, when you select Slots in the Throughput tab, the WebGUI shows the throughput measured for each individual slot.
This view allows you to observe how the throughput changes from slot to slot. It provides a more detailed view compared to the averaged throughput plot and helps identify short term variations in transmission performance.

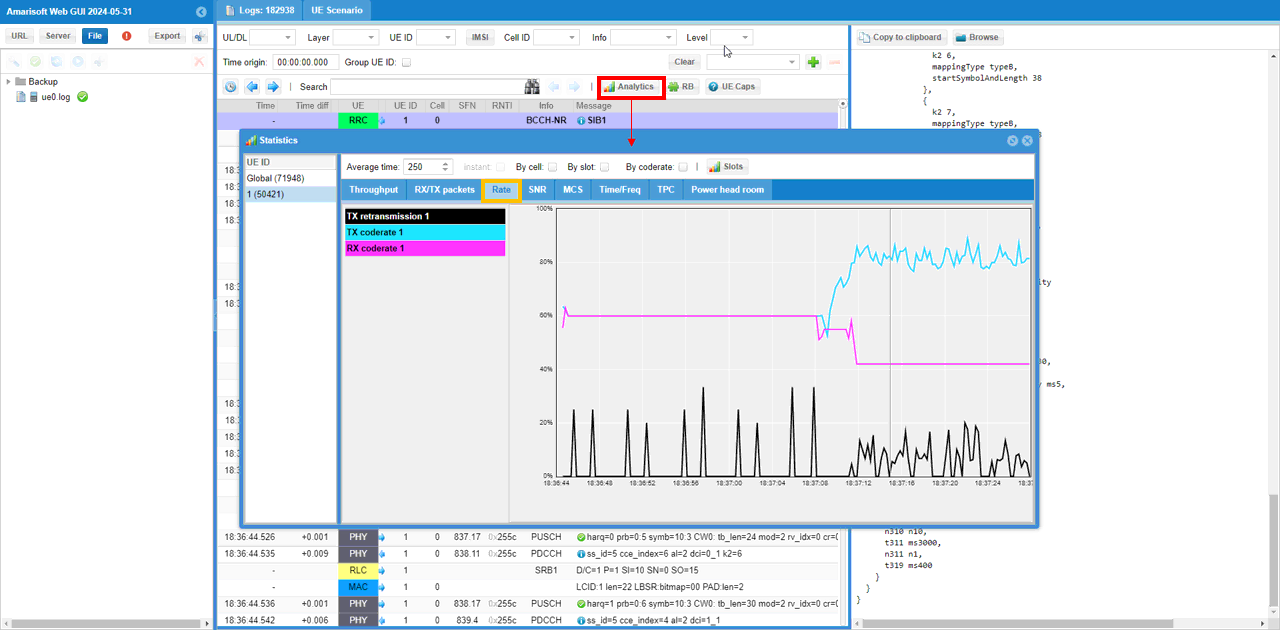
Rate
Rate analysis shows the coderate for each transmitted and received PHY frame and also shows the retransmission rate, which is related to CRC errors. Since coderate is one of the factors that can affect the difficulty of decoding the received frame, this plot can help check whether there is any correlation between the coderate and the retransmission behavior.
Since there are many different factors that influence the CRC error rate, this plot does not always show a clear correlation. However, it can still be useful to examine this plot to see if any visible relationship appears between coderate changes and retransmission events.
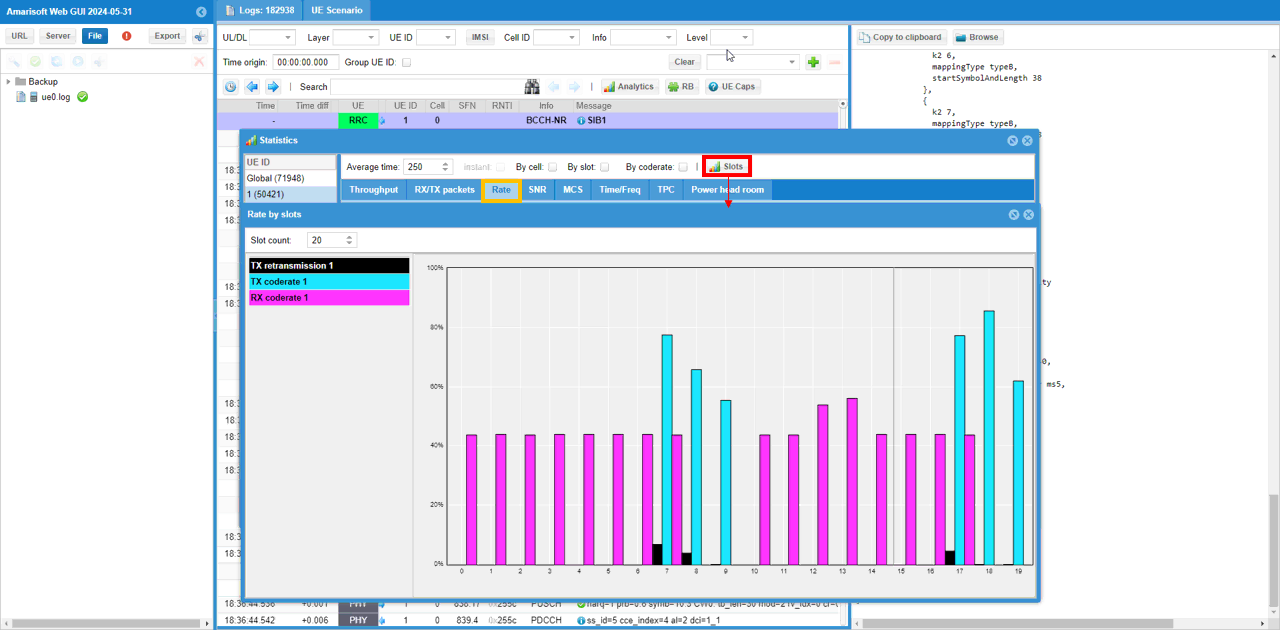
Sometimes even if you do not see any obvious issues in the coderate and retransmission behavior over time (as shown in the previous plot), you may still find that problems such as coderate bursts or retransmission bursts occur only in a few specific slots.
By viewing the statistics on a per slot basis, you can more easily identify the particular slots where these abnormal behaviors occur. This helps narrow down the time location of the issue.
However, identifying the problematic slot does not automatically reveal the root cause. Determining the actual reason for the issue requires further investigation, since there is no automatic method to directly identify the root cause of the problem.
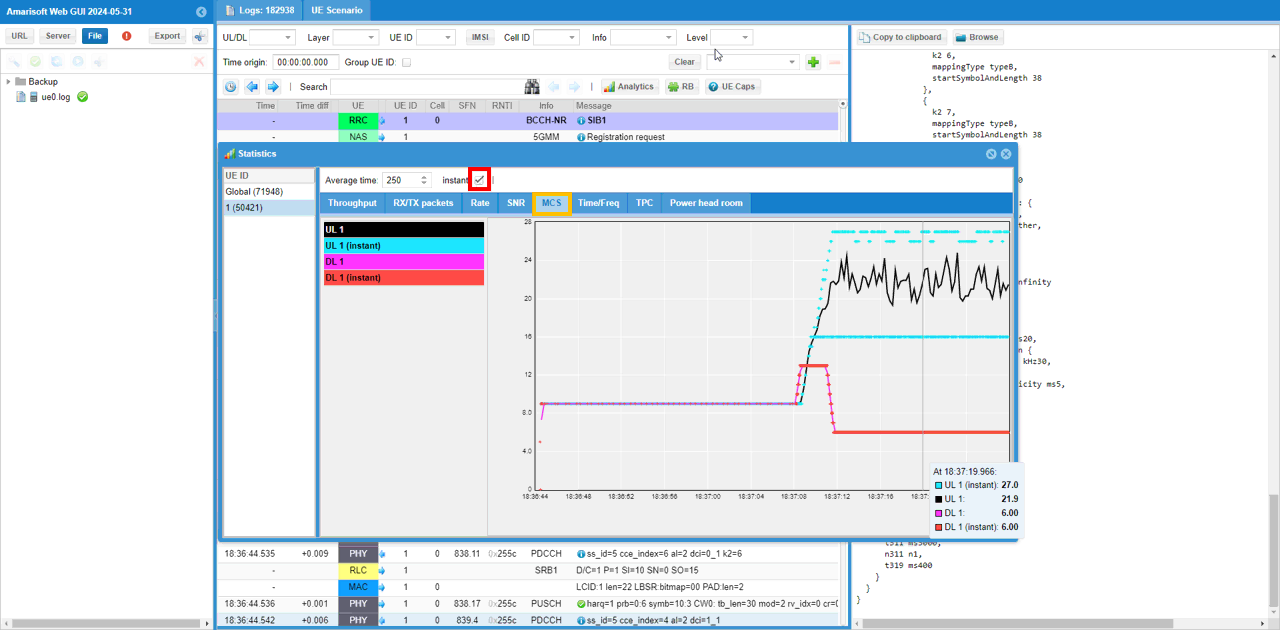
MCS
MCS shows the MCS for the transmitted and received PHY frames. By default, it displays the average value of the MCS over the time period specified in the Average time field. This view helps observe how the modulation and coding scheme changes over time for both uplink and downlink transmissions.
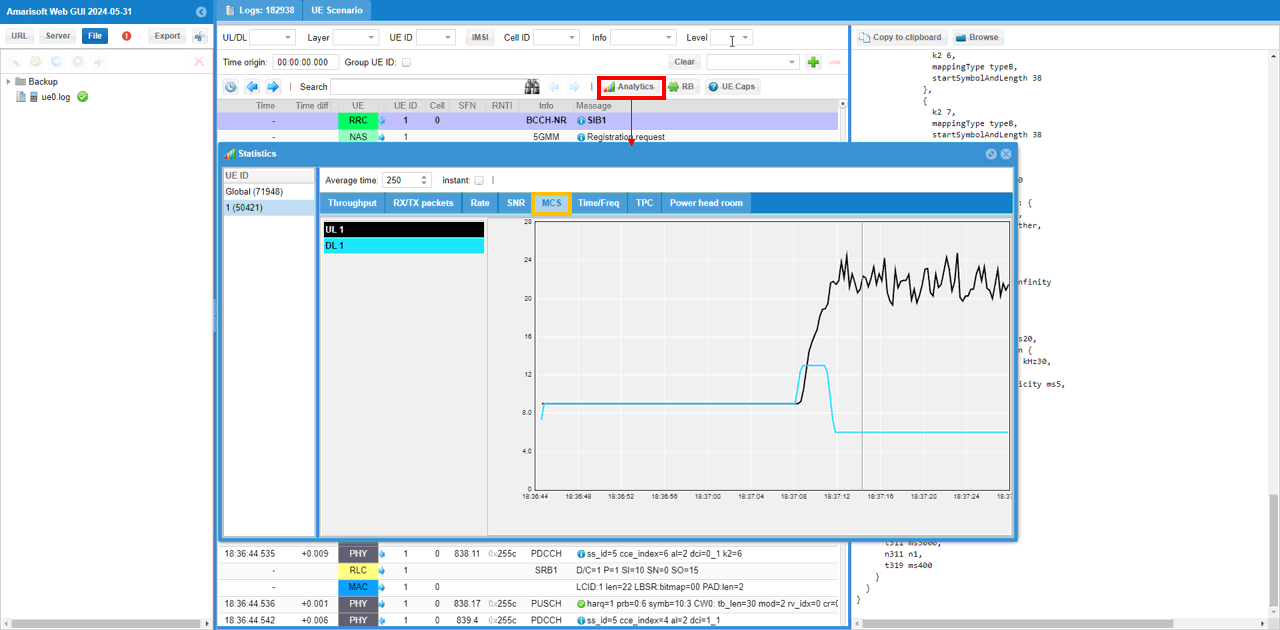
Sometimes you may want to see the MCS value for each individual frame instead of only the averaged value. In this case, enable the Instant checkbox. When this option is selected, the WebGUI shows both the averaged MCS and the instant MCS values. The instant value represents the MCS used for each individual PHY frame, allowing you to observe frame level variations in the modulation and coding scheme.
SNR
You can plot the SNR for PUSCH and PUCCH by selecting the SNR tab as shown below. This allows you to observe how the signal to noise ratio changes over time for uplink transmissions.
You can also view the average SNR for each slot. To do this, click the Slots button while the SNR tab is selected. This will display the SNR statistics on a per slot basis, which helps identify slot level variations in the radio signal quality.

Collecting Log from a Specified Server
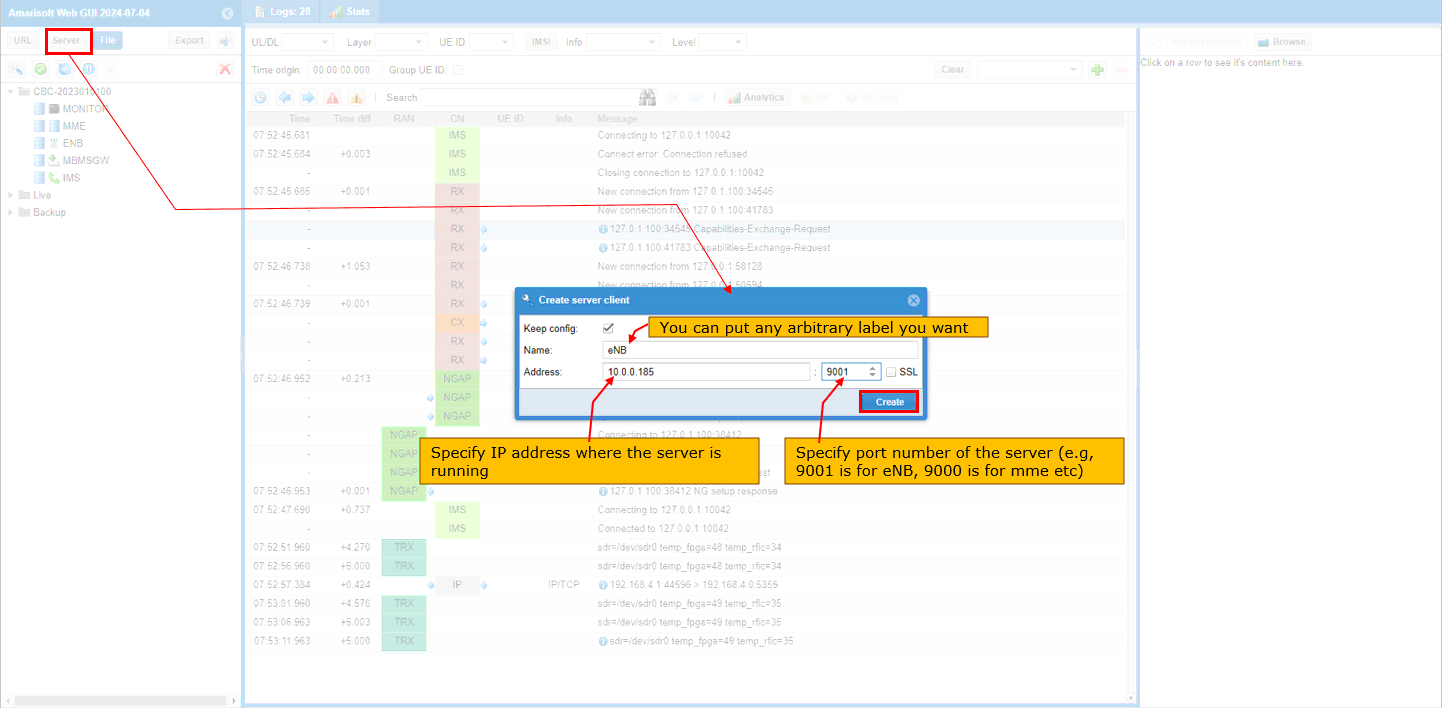
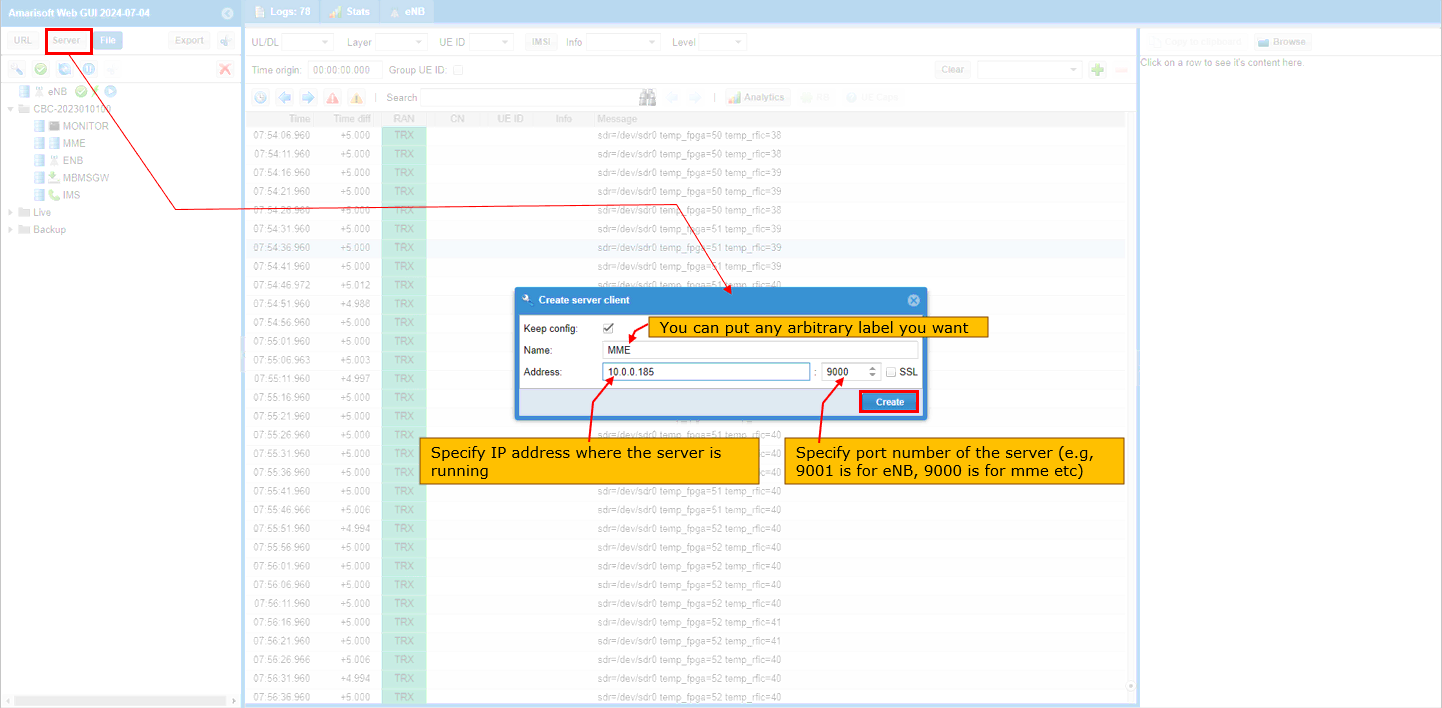
You can specify a particular server from which the WebGUI should collect logs. This is especially useful when the server generating the logs is running on a different machine from the one where the WebGUI is running. However, this feature can be used regardless of whether the server is local or remote.
To configure this, add a new server entry in the WebGUI and provide the necessary connection information. You can assign any label you want for the server name. Then specify the IP address where the server is running and enter the port number used by that server. For example, port 9001 is typically used for eNB and port 9000 is used for MME.
After entering the server name, address, and port number, create the server entry and the WebGUI will connect to that server and start collecting logs from it.
In this tutorial two servers were added, one for eNB and one for MME, but you can add additional servers in the same way if needed.
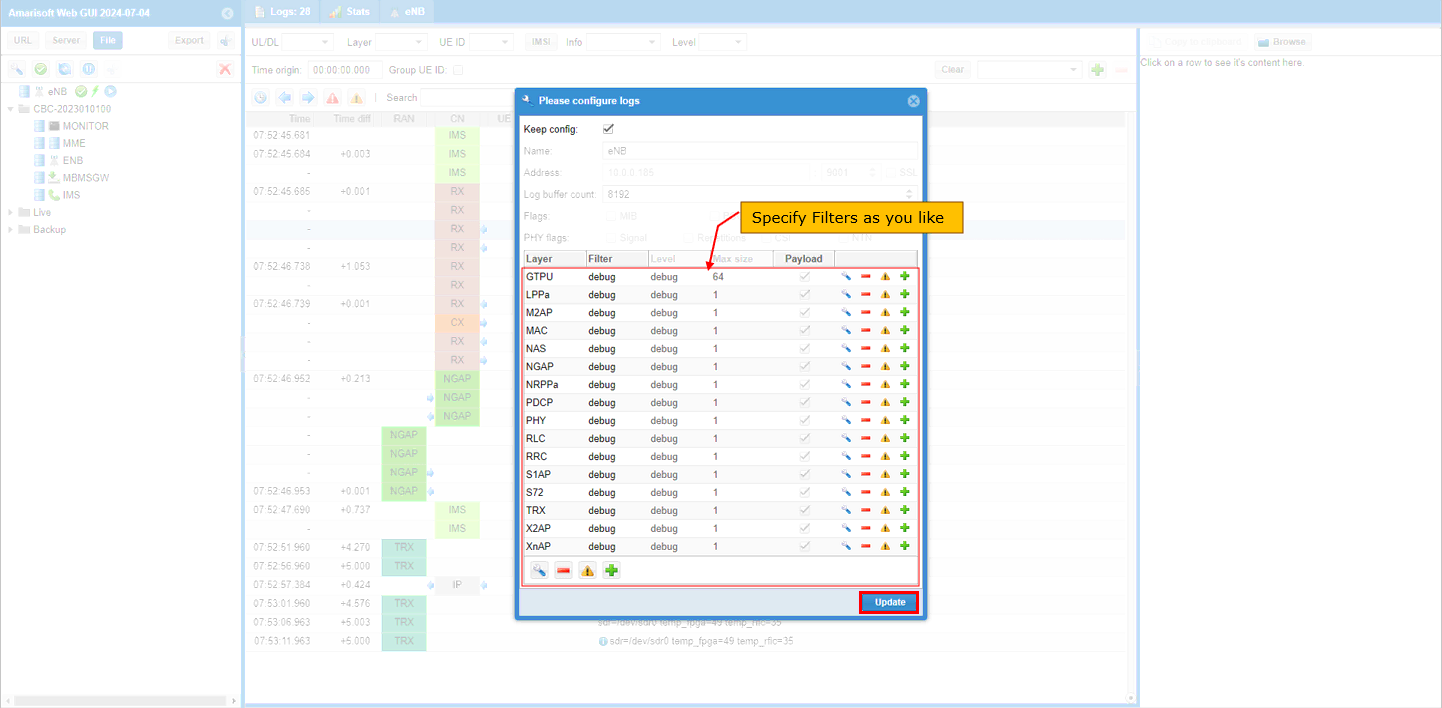
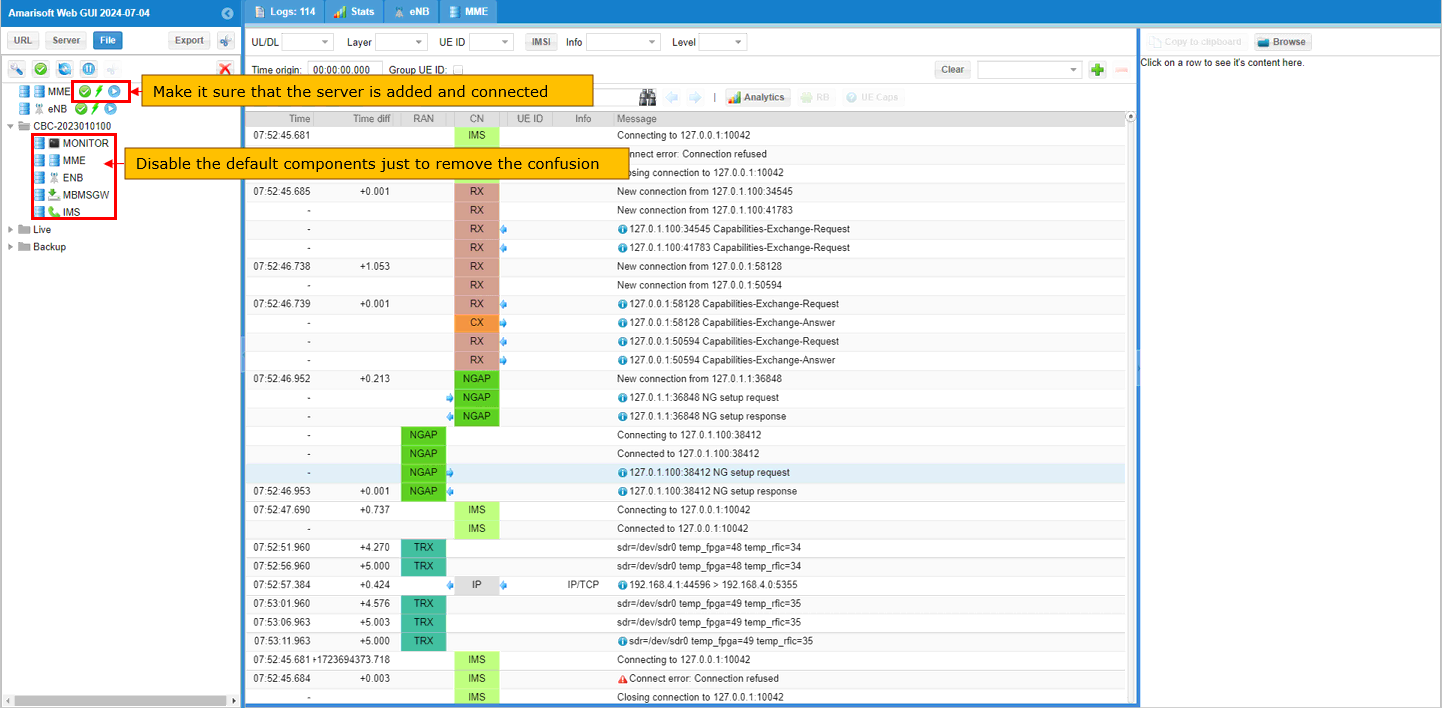
After connecting to the server, configure the log settings. In the log configuration window you can specify filters for each protocol layer. Set the filter and level according to the type of information you want to capture. For example, setting the level to debug allows the WebGUI to capture the most detailed logs for that layer.
You can configure the filters independently for layers such as GTPU, LPPA, M2AP, MAC, NAS, NGAP, PDCP, PHY, RLC, RRC, S1AP, TRX, X2AP, and others. This allows you to focus on specific protocol layers depending on the type of analysis you want to perform.
Once the desired filters and levels are configured, press the Update button to apply the settings. The WebGUI will then start collecting logs from the selected server using the specified configuration.
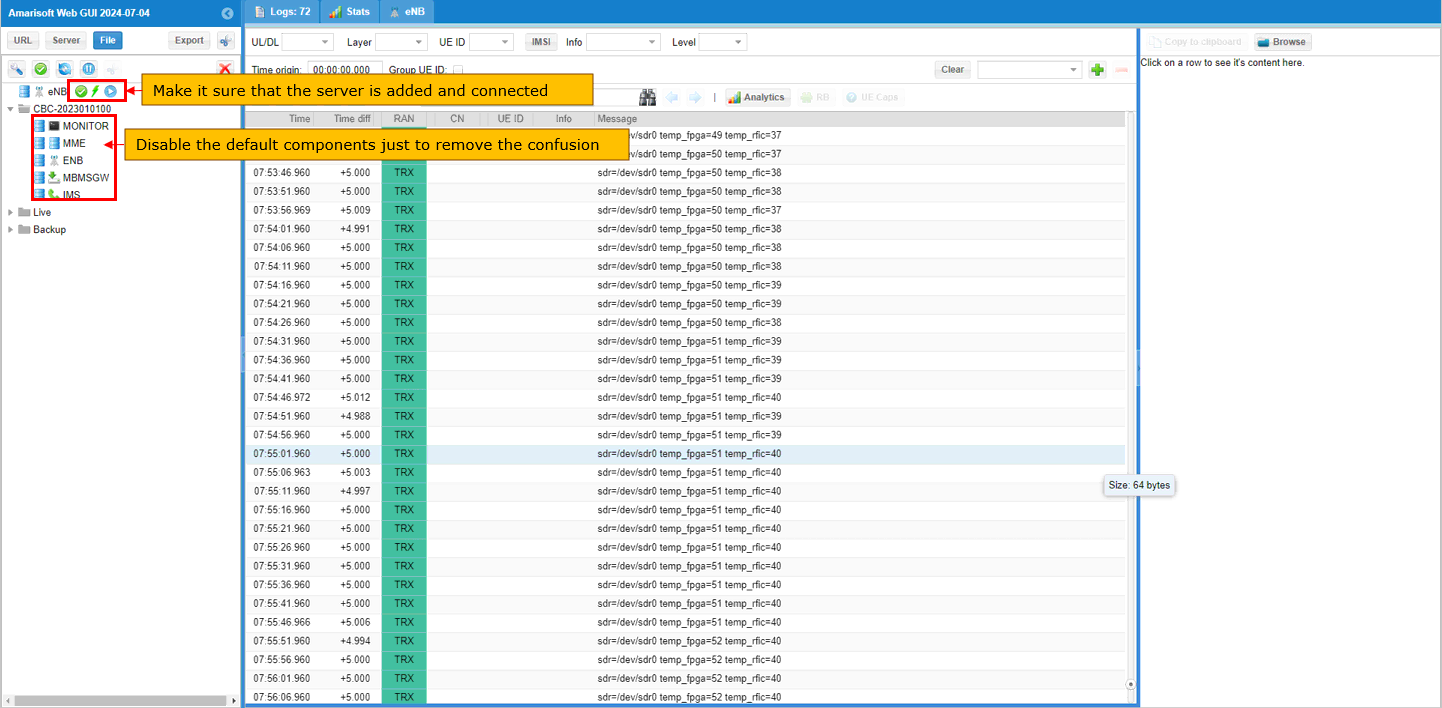
After adding the server, make sure that the server is properly connected in the WebGUI. The connection indicator next to the server name should show that the connection is active.
To avoid confusion, it is recommended to disable the default components that appear in the WebGUI. This helps ensure that the logs being displayed are only coming from the newly added server. By disabling unnecessary default components such as MONITOR, MME, ENB, MBMSGW, or IMS, the log view becomes cleaner and easier to analyze.
To collect logs from another server, click the Server button and create a new server client entry. In the configuration window, you can assign any label you want for the server name. This name is only used for identification in the WebGUI.
Next, specify the IP address of the machine where the server is running. Then enter the port number used by that server. For example, port 9001 is typically used for eNB and port 9000 is used for MME.
After entering the server name, IP address, and port number, click Create. The WebGUI will then add the server to the list and attempt to connect to it so that logs can be collected from that server.
After adding the server entry, verify that the server is successfully added and connected in the WebGUI. The connection indicator next to the server name should show that the connection is active.
To keep the interface clear, it is recommended to disable the default components that appear in the WebGUI. Disabling items such as MONITOR, MME, ENB, MBMSGW, or IMS helps avoid confusion and ensures that the displayed logs come only from the servers that you intentionally configured. This makes the log view easier to understand and analyze.
Tips : Callbox(gNB/eNB/Core Network)
In this section, several practical tips are introduced to help you better utilize the detailed functions and features provided by the WebGUI when working with the Callbox, including the gNB, eNB, and core network components. These tips can help make log collection, analysis, and troubleshooting more efficient during testing and development.
Enabling BCCH (SIB) logging
To capture SIB information in the WebGUI, enable BCCH logging in the ENB configuration as shown below. Once BCCH logging is enabled, the WebGUI will capture the BCCH messages that contain the system information blocks.
However, if BCCH logging remains enabled for the entire duration of the test, the log file size will continuously increase without providing much additional information. In many cases it is sufficient to enable BCCH logging only for a short period at the beginning of the test, such as before powering on the UE. After capturing the required SIB information, you can disable BCCH logging and continue with the rest of the test procedure.
Make sure to uncheck the Keep Config checkbox when enabling BCCH logging through the WebGUI. If the Keep Config option is checked, the BCCH logging configuration from the enb.cfg file will be applied instead of the settings configured in the WebGUI.

Set the Layer filter as shown below to make the analysis of SIBs and other RRC messages easier. By selecting the appropriate layer such as RRC, you can quickly locate the relevant messages related to system information and RRC signaling. This helps reduce unnecessary log entries and makes it easier to focus on the messages that are important for SIB and RRC analysis.

Then click on the specific SIB message that you want to examine. When you select the message, the decoded SIB content will appear in the right panel of the WebGUI window. This panel displays the detailed decoded structure of the SIB message, allowing you to review the system information parameters contained in that message.

For example you can configure it like this. log_options: all.level=debug,all.max_size=1,bcch=1
With this setting BCCH messages are enabled from the configuration file itself, so the ENB will generate BCCH related logs without requiring the option to be enabled manually from the WebGUI.

A practical way to use this is to enable BCCH logging only for a short time at the beginning of the test. For example you can set log bcch=1, wait a few seconds so that the BCCH and SIB information is captured, and then set log bcch=0 before powering on the UE. This allows you to collect the required BCCH information only at the beginning of the log without unnecessarily increasing the log size for the rest of the test.
Example commands are shown below.
(enb) log bcch=1
(enb) log bcch=0
![]()
Enabling MIB logging
You can enable MIB logging from the WebGUI by selecting the MIB option in the ENB configuration window as shown below. Once this option is enabled, the WebGUI will capture and display the Master Information Block messages transmitted by the cell.
If you do not see the MIB option in your WebGUI, it means your callbox software version may be outdated. In that case, upgrade the callbox software to a newer version to get this feature.
After enabling MIB logging, make sure the RRC layer is also configured appropriately so that the decoded MIB messages can be properly displayed and analyzed in the log view.

Once MIB logging is enabled, you will see multiple Master Information Block messages appearing in the log as shown below. These messages are typically carried on BCCH and decoded under the RRC layer.
You can click on any of the Master Information Block entries to view the decoded contents in the right panel. The decoded information includes key system parameters such as system frame number, bandwidth configuration, and scheduling information.
This allows you to quickly verify the broadcasted system configuration of the cell without manually decoding the raw message.

Enabling full log in eNB/gNB
You can enable full logging for eNB or gNB with a single action in the WebGUI. This sets all protocol layers to debug level so that detailed logs are collected across the full stack. This configuration can be changed at any time. However, if you want the full log from the beginning of the test such as from the initial attach, you need to configure this and press update before starting the test or before powering on the UE. Make sure to uncheck the Keep Config option so that the logging configuration set in the WebGUI is applied. If Keep Config is checked, the settings from the configuration file will override the WebGUI settings.
When full logging is enabled, logs will be captured for all layers from PHY up to RRC and also for signaling toward the core network. This provides a complete view of the system behavior for detailed analysis and troubleshooting.(You can do fine control of each of the component if you like as explained in the section : Setup Properties and Get the log )

log_options: "all.level=debug,all.max_size=1",
Enabling full log in MME
You can enable full logging for MME with a single action in the WebGUI. This sets all protocol layers in MME to debug level so that detailed logs are collected. You can change this configuration at any time. However, if you want to capture logs from the beginning of the test such as from the initial attach, you should configure this and press update before starting the test or before powering on the UE. Make sure to uncheck the Keep Config option so that the logging configuration set in the WebGUI is applied. If Keep Config is checked, the settings from the mme.cfg file will override the WebGUI settings.
When full logging is enabled, logs will be collected across all MME related interfaces and protocols, providing a complete view of signaling between the radio network and the core network for detailed analysis and troubleshooting.(You can do fine control of each of the component if you like as explained in the section : Setup Properties and Get the log )

log_options: "all.level=debug,all.max_size=1",
Enabling full log in IMS
You can enable full logging for IMS by clicking a single button in the WebGUI. This sets all IMS related components to debug level so that detailed signaling and media related logs are collected. You can change this configuration at any time. However, if you want to capture logs from the beginning of the test such as from the initial registration or call setup, you should configure this and press update before starting the test or before powering on the UE. Make sure to uncheck Keep Config so that the logging configuration set in the WebGUI is applied. If Keep Config is checked, the settings from ims.cfg will be used instead.
When full logging is enabled, logs will be collected for all IMS related protocols such as SIP, IMS core procedures, media handling, and security related exchanges. This provides full visibility into VoLTE or VoNR call setup, registration, and session handling for detailed analysis and troubleshooting. (You can do fine control of each of the component if you like as explained in the section : Setup Properties and Get the log )

Capture and Display Corenetwork Interfaces
You can capture various core network interfaces by enabling the corresponding items in the configuration window. Each interface represents a specific protocol or reference point in the core network, and enabling them allows you to monitor detailed signaling exchanged between network elements. The list of available interfaces may increase depending on the software version, so it is recommended to use the latest release to access the most up to date set of interfaces. You can modify this configuration at any time. However, if you want to capture signaling from the very beginning of the procedure such as initial attach or registration, you should configure the interfaces and press update before starting the test or before powering on the UE. By enabling selected interfaces such as S1AP, NGAP, NAS, HTTP2, GTPU, or others, you can observe end to end signaling across the radio access network and core network. This helps in correlating messages across layers and understanding full call flows including attach, session establishment, mobility, and service procedures.
This feature provides a unified view of signaling across multiple interfaces, making it easier to troubleshoot issues and analyze interactions between different network functions.. (

Once the log is captured, you can filter specific network interfaces to focus on the messages you are interested in. You can use the Layer dropdown to select a specific interface such as N1, N2, N12, NGAP, NAS, or others. After selecting a layer, only the messages belonging to that interface will be displayed in the log window. This helps reduce clutter and allows you to concentrate on a particular signaling flow. For example, selecting NGAP shows only radio access to core signaling, while selecting NAS shows UE to core signaling.
By switching between different layers, you can follow the end to end procedure step by step and correlate how messages flow across different interfaces during attach, registration, or session setup

Launching Screen Window within WebGUI
You can launch a screen window directly inside the WebGUI to access and control the callbox without leaving the interface.
By clicking the screen icon, a terminal window opens within the WebGUI. This window connects to the underlying system and allows you to execute commands as if you were using a local console.
Once connected, you can monitor logs, check system status, and run commands such as configuration checks or runtime controls. This is especially useful for quick debugging and validation without switching to an external SSH session.
The screen window provides a convenient way to interact with eNB, gNB, or core network components while simultaneously observing logs and statistics in the WebGUI.

Displaying UE Capability Information Table
If the log contains a UE capability information message, the [UE Caps] button becomes active. By clicking this button, you can view the UE capability information in a structured table format. The table presents detailed capability parameters of the UE, making it easier to understand supported features such as bands, bandwidth, MIMO capability, modulation schemes, and various protocol features. This view simplifies analysis compared to reading raw ASN decoded text, because it organizes the information into readable fields. It is especially useful when verifying UE support for specific features or when troubleshooting compatibility issues between the UE and the network.

The contents of the UE capability information message are summarized in a tabular format for easier analysis.
The table organizes the capability information into categories such as supported LTE bands, NR bands, and carrier aggregation combinations. Each entry clearly shows the band combinations, MIMO configuration, and uplink or downlink capabilities. This structured view allows you to quickly understand what features the UE supports without going through raw decoded ASN data. You can browse through different combinations and capability groups to verify support for specific configurations such as carrier aggregation, modulation schemes, and antenna configurations. This makes it much easier to validate UE capability against network configuration and to troubleshoot feature compatibility issues.

Tx gain and Rx Gain Change
If you are using the WebGUI while it is connected to a running eNB/gNB, you can change the TX power and RX power by changing tx_gain and rx_gain directly from the GUI as shown below.
When WebGUI is connected to a running eNB or gNB, you can adjust TX power and RX power directly from the GUI by changing tx_gain and rx_gain.
Go to the ENB tab and select the eNB icon. This opens the RF configuration window. In this window, you can see the TX and RX gain values for each RF port. You can increase or decrease the gain by clicking the plus or minus buttons.
Changing tx_gain affects the transmit power of the base station. Changing rx_gain affects the receive sensitivity. This allows quick tuning of RF conditions during testing without modifying configuration files or restarting the system.
Hit [ENB] tab and select eNB icon, then you will bet RF configuration popup as shown below. You can increase or decrease tx_gain or rx_gain by clicking on [+] / [-] icon.

Analyze Constellation
You can plot the constellation of received physical signals using WebGUI. For eNB or gNB logs, the plotted signal corresponds to PUSCH. For UEsim logs, it corresponds to PDSCH.
To use this feature, you first need to enable PHY signal capture. Open the ENB configuration window and enable the Signal option. Once enabled, the system saves the captured PHY samples into a separate binary file.
Both log file and binary file must be saved if you want to analyze the constellation later.
After capturing, the constellation plot shows modulation quality of the received signal. This helps evaluate signal conditions, noise, distortion, and overall link quality.
This feature is useful for debugging PHY layer issues such as poor SNR, incorrect modulation, or RF impairments.
In order to plot the constellation, first you need to enable the capture of the phy signal by selecting 'Signal' option on ENB configuration window as shown below. If you enable PHY signal capture, the captured data will be saved in a separate file with the name of *.bin. Don't forget to store both *.log and *.bin file if you want to plot the constellation later.

Once PHY signal capture is enabled, you can view the constellation of the received signal by clicking the Constellations button in the WebGUI.
When you click this button, a new window opens showing the constellation plot of the received signal. The plot represents modulation points of the received symbols.
Each cluster of points corresponds to modulation schemes such as QPSK, 16QAM, or 64QAM. The spread of the points indicates signal quality. Tight clusters indicate good signal quality, while scattered points indicate noise, interference, or RF issues.
This visualization helps you quickly assess modulation accuracy and overall PHY performance during the test.


01:59:06.311 [PHY] UL 0001 01 4601 929.18 PUSCH: harq=2 prb=2:47 symb=0:14 CW0: tb_len=2370 mod=4 rv_idx=0 cr=0.65 retx=0 crc=OK snr=16.0 epre=-83.3 ta=0.1 re_symb=564,564,282,564,564,564,564,564,564,564,564,282,564,564 chan_symb=2,11
Link: re@4364472
Link: chan@4393812
re_symb, chan_sym, Link:re, Link:chan are the meta data indicating the start position of PDSCH, PUSCH, DMRS and re_symb is the number of symbols for PDSCH, PUSCH and chan_symb is the symbol number where DMRS is transmitted.
Analyze Channel Response
You can analyze uplink channel characteristics using the channel analysis features in WebGUI. If this feature is not available, you may need to upgrade to a newer software version.
The analysis is based on DMRS symbols. For DMRS, the receiver knows both the expected value and the measured value. By comparing these two, the system can estimate how the channel affects the signal. Each DMRS sample is a complex value consisting of I and Q components. By dividing the expected DMRS value by the measured value, you can estimate channel effects such as phase shift and amplitude variation.
If you plot the result on the complex I Q plane, you get the channel constellation. This shows how the channel distorts the signal. If you separate the result into amplitude and phase, you get the channel norm and phase plot. This shows gain variation and phase rotation over time or frequency. If you apply inverse FFT to the same data and plot it in dB, you get the channel impulse response. This shows multipath characteristics such as delay spread.
In callbox logs, this analysis is available only for uplink channels. To analyze downlink channels such as PDSCH, you need to use UEsim logs.
Before using these features, enable PHY signal capture by selecting the Signal option in the configuration.
Basically Channel Constellation, Channel Norm/Phase, Channel Impulse Responser shows the same data in different perspective. Followings are some highlights on how these are plotted.
- All of these are based only on DMRS symbols
- In case of DMRS, we (gNB or UE depending on which log you are analyzing) knows what is the ideal value (expected value based on 3GPP spec) and measured value (the value recieved/percieved by the reciever (gNB or UE depending on which log you are analyzing)
- Each of these data points are complex number (i.e, I/Q data)
- If you take '[expected DMRS value / measured DMRS value]' (where '/' indicates 'complex number division'), you can figure out how much each of the DMRS symbol is delayed in time(phase) and is fluctuated in gain. You can consider this as the difference between the expected DMRS value and measured DMRS value.
- If you plot the result of '[expected DMRS value / measured DMRS value]' in complex plan (I/Q plane), you get Channel Constellation plot
- If you plot the same result in two different plot (amplitude and phase), you get Channel Norm/Phase plot.
- If you do IFFT to the resulting data and plot it in dB, you get Channel Impulse Responser.
First, enable Signal option to capture PHY signal data.

Select the reciever physical channel constellation (PUSCH Channel Constellation in this case). This plots the constellation of DMRS (PUSCH DMRS in this case). You can plot the DMRS for each DMRS symbol and antenna port.
Click on the uplink channel entry and use the star icon to access analysis options. From there, select the channel constellation view. The plotted points represent DMRS symbols for the selected transmission. You can choose different DMRS symbols and antenna ports to view their constellations.
Each plot shows how the received DMRS symbols are distributed in the I Q plane. This helps you understand channel distortion, noise, and overall uplink signal quality. By comparing different symbols and antenna ports, you can analyze how the channel varies across time and spatial layers.

You can plot the amplitude and phase of the channel response by selecting the PUSCH or PDSCH Norm Phase tab.
This view separates the channel response into two components. One plot shows the amplitude which represents the gain variation of the channel. The other plot shows the phase which represents the phase rotation introduced by the channel. The results are derived from DMRS based channel estimation. By analyzing amplitude and phase separately, you can better understand channel fading, distortion, and phase noise.
This is useful for identifying issues such as frequency selective fading, phase instability, or RF impairments across symbols and antenna ports.

You can plot the channel impulse response for PUSCH or PDSCH by selecting the PUSCH Channel Impulse Response tab.
This plot is obtained by applying FFT to the channel norm and phase data derived from DMRS based channel estimation. The impulse response shows how the signal energy is distributed over time due to multipath propagation. Peaks in the plot indicate different signal paths arriving with different delays.
This helps you understand channel characteristics such as delay spread, multipath components, and reflection effects. It is useful for analyzing channel conditions, identifying severe multipath environments, and debugging performance issues related to timing and equalization.

Checking UL Power
You can check EPRE for each uplink channel from the trace log. This is optional, but it becomes much easier if you filter the log to show only PHY layer entries and select specific channels in the Info field.
Select uplink related channels such as PUSCH, PUCCH, PRACH, SRS, or SRB1 from the Info filter. This reduces unnecessary log entries and allows you to focus only on uplink transmissions. In the filtered log, each PHY message contains EPRE information. This value represents the effective transmit power of the uplink signal. By observing EPRE across different transmissions, you can verify uplink power control behavior, check consistency of transmit power, and identify issues such as power imbalance or unexpected attenuation.
This is useful for validating power control algorithms and troubleshooting uplink performance problems.

You can plot the uplink EPRE for a specific UE using the analytics feature.
First select the desired UE ID from the UE list. Then open the Analytics window and select the SNR or related tab where UL EPRE is included. The graph shows EPRE values over time for different uplink channels such as PUSCH and PUCCH, along with control channel EPRE. This allows you to observe how the UE transmit power changes over time. You can analyze power control behavior, compare different channel powers, and detect abnormalities such as sudden drops or fluctuations.
This is useful for validating uplink power control and troubleshooting RF or link adaptation issues.

If you are using a software version later than 2022 02 10, you can also plot SRS along with other uplink data.
Select a specific UE ID and open the analytics view. In addition to PUSCH and PUCCH, you will see SRS related measurements. The graph shows SRS SNR and SRS EPRE together with PUSCH and PUCCH metrics. This provides a more complete view of uplink channel conditions. SRS reflects the channel quality across frequency and is often used for scheduling and beam management. By comparing SRS with PUSCH and PUCCH, you can analyze consistency between sounding reference signals and actual data transmission.
This helps in understanding channel estimation accuracy, uplink link adaptation, and overall radio performance.

Plotting TPC command values
You can plot TPC command values for a specific UE using the analytics feature.
Select a UE ID and open the Analytics window, then choose the TPC tab. This displays the transmit power control commands sent in each DCI. The dots represent individual TPC command values for each transmission. The solid line represents the moving average of these commands over time. By observing this plot, you can understand how the network adjusts uplink transmit power. Positive commands indicate power increase, while negative commands indicate power decrease.
This helps you analyze power control behavior, stability of uplink power adjustment, and how the system reacts to changing channel conditions.

CRC Error Check with RB Map
You can visually check CRC errors using the resource block map view.
Open the RB tab to display the allocation map. Each block represents resource allocation over time and frequency. PDSCH or PUSCH transmissions without CRC errors are shown with a solid color background. Transmissions with CRC errors are shown with a hashed pattern. These typically indicate retransmissions or decoding failures. By scanning the map, you can quickly identify where errors occur in time and frequency. This helps in correlating errors with specific resource allocations, channel conditions, or interference.
This visualization is useful for troubleshooting link reliability issues and understanding HARQ retransmission behavior.

BWP Switching Verification
If multiple BWPs are configured with different bandwidths or frequency locations, the RB map can be used to verify BWP switching.
Open the RB view to display resource allocation over time and frequency. Changes in the allocation position or bandwidth indicate switching between BWPs. You can visually observe that resource blocks suddenly shift to a different frequency region or expand or shrink in bandwidth. This reflects the UE switching from one BWP to another. For easier analysis over long durations, use the scroll control to move across frames quickly.
This method provides a clear visual way to confirm that BWP switching is happening as expected and helps validate configuration and scheduling behavior.

From the trace log, you can verify BWP switching by checking the DCI fields.
Filter the log to show only PDCCH messages. This allows you to focus on DCI information where BWP related parameters are included. In each DCI message, look for the bwp field. This indicates which bandwidth part is being used for that transmission. By tracking changes in the bwp value over time, you can identify when switching occurs. A change from one bwp index to another indicates that the UE has switched to a different bandwidth part. You can also use search filters such as bwp to quickly locate switching points in the log.
This method provides a precise way to verify BWP switching behavior at the control signaling level, complementing the visual verification from the RB map.

If you are doing BWP switching with high data rate, throughput change can be used as an indicator of the switching.
When the UE is transmitting or receiving high traffic, the throughput reflects the effective bandwidth being used. If two BWPs have different bandwidth sizes, the achievable throughput will also be different. If radio conditions are similar for both BWPs, a sudden increase or decrease in throughput typically indicates a switch between BWPs. For example, switching from a narrow BWP to a wider BWP results in a noticeable jump in throughput. Switching in the opposite direction results in a drop. In the throughput graph, this appears as a step change. The flat region before and after the step corresponds to operation within a specific BWP. The transition point between these regions indicates the switching moment.
This method is useful as a quick visual check, especially when analyzing high data rate scenarios, but it should be used together with DCI analysis or RB map for precise verification.

Enabling CSI Decoding
Enabling CSI decoding can be done in two ways.
The first method is through WebGUI. Open the ENB configuration window. Make sure that Keep config is unchecked. If this option is checked, the WebGUI settings are ignored because configuration is taken from the config file. Then enable the CSI flag under PHY options. Once this is enabled, CSI related information will be included in the PHY logs.
The second method is through the configuration file. In this case, you explicitly enable CSI logging in the log_option or PHY configuration section. This is useful when running without GUI or when you want persistent settings.
After enabling CSI decoding, the logs will include CSI-related measurements and reports. This allows you to analyze channel quality, PMI/RI/CQI, and other CSI feedback information directly from the trace logs.
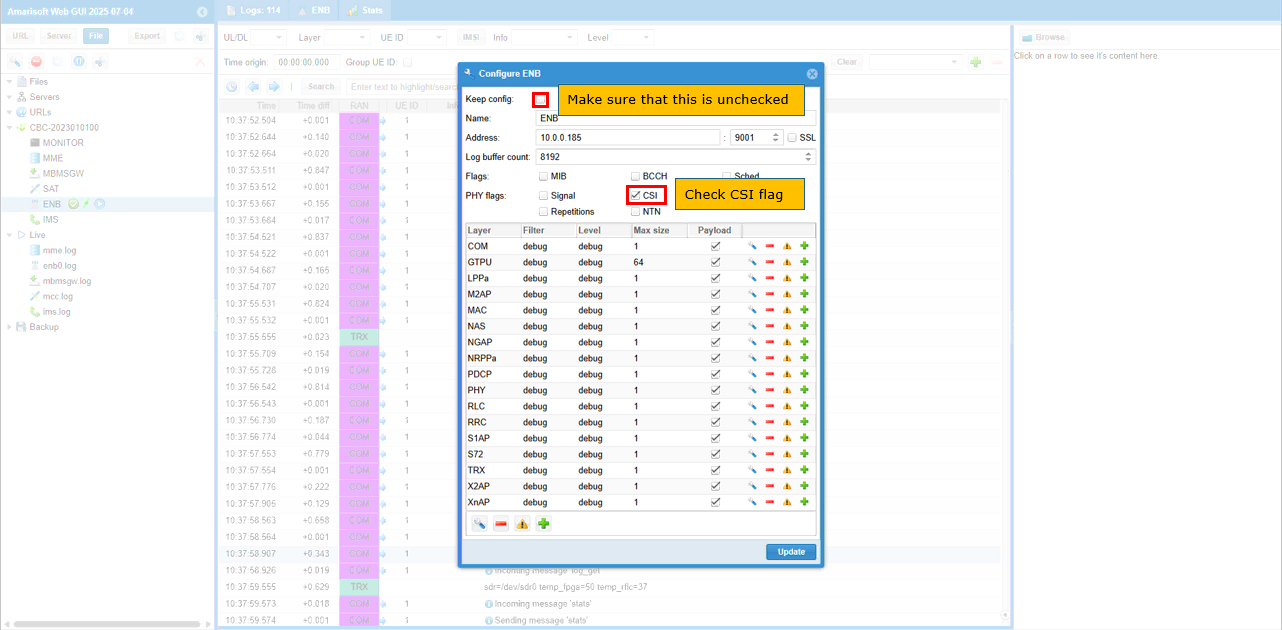
After enabling CSI decoding, you will see a new Info item called CSI in the PHY log. (
This CSI entry shows the decoded CSI report. Typical fields include CRI, RI, PMI, and CQI. These represent the UE�s feedback about channel condition, preferred beam, rank, and modulation capability. Each CSI log corresponds to a CSI reporting event. For example, periodic CSI reports will appear regularly in the log, while aperiodic reports appear when triggered. Even with CSI decoding enabled, the CSI information carried inside PUCCH or PUSCH messages is still printed in non-decoded raw format. The decoded version is provided separately as the CSI Info entry.
This separation allows you to easily read the interpreted CSI values while still having access to the original raw signaling for deeper analysis if needed.

Finding the cause of RRC Release
You can find the cause of RRC Release from the log.
First, enable NGAP logging in the ENB configuration. Open the configuration window and make sure NGAP is enabled in the log options. This is important because the release reason is usually carried in NGAP signaling between gNB and core network.

Once NGAP logging is enabled, check the log around the time when RRC Release happens. Look for messages like UE Context Release Request or UE Context Release Command. Inside these NGAP messages, find the cause field. This field indicates why the session is being released. Typical causes include user inactivity, normal release, radio connection loss, or network-triggered reasons.
For example, if the cause shows user-inactivity, it means the UE was released due to inactivity timer expiry. If it shows radio-related cause, it indicates link failure or radio issue.
This method gives you the exact root cause from the core network perspective. It is more reliable than looking only at RRC messages, because RRC Release itself often does not include detailed cause information.

You can confirm the same information in the UE Context Release Command message as well.
In the NGAP log, locate the UE Context Release Command message. This message is sent from the core network to the gNB to trigger the release of the UE context. Inside this message, check the cause field. This field clearly indicates the reason for the release.
For example, if the cause shows user-inactivity, it means the network decided to release the UE because no data activity was detected for a certain period.
This message provides confirmation of the release reason from the network side. It is consistent with the UE Context Release Request and helps validate the root cause of the RRC Release.

PHY Scheduling Analysis
What I want to show you here is how to analyze the downlink and uplink scheduling for PHY layer. To do this, you need to collect the low layer (I want to suggest you to enable full stack log if you want to analyze on this kind of details).
To perform this analysis, you need to collect low layer logs. It is recommended to enable full stack logging so that all PHY related details are captured. If the throughput is low, you can analyze logs in real time using WebGUI. However, for high throughput scenarios such as peak data tests, it is better to collect logs without WebGUI and analyze them later. This avoids performance impact and prevents log loss.
Before starting the analysis, filter the logs to focus only on PHY layer. Select PHY in the Layer filter. This helps isolate scheduling-related messages such as PDCCH, PDSCH, PUSCH, and PUCCH.
From these PHY logs, you can observe scheduling decisions. For downlink, PDCCH indicates scheduling assignments and PDSCH shows actual data transmission. For uplink, PDCCH carries uplink grants and PUSCH shows UE transmission.
By correlating these messages over time, you can understand how resources are assigned, how frequently scheduling occurs, and how efficiently the system is utilizing available bandwidth.
This is not mandatory, but it would be helpful to filter the PHY channel that you are interested in before you analyze it.
Select PHY in Layer dropdown box.

Select the physical channels that you want to analyze from the Info dropdown.
In this case, select PDCCH, PUCCH, PUSCH, and PDSCH. PDCCH shows the scheduling decisions. It carries DCI which tells the UE when and how to transmit or receive. PDSCH shows the actual downlink data transmission assigned by PDCCH. PUSCH shows the uplink data transmission from UE based on uplink grant. PUCCH shows uplink control information such as ACK/NACK, CSI, and scheduling request.
By filtering these channels, you remove unnecessary logs and focus only on scheduling-related activity. This makes it easier to track the relationship between control signaling and actual data transmission.. In this case, I selected PDCCH, PUCCH, PUSCH, PDSCH

You can check the NR UL Grant by clicking on entries like dci=0_1 or dci=0_0 in the PDCCH logs.
These entries represent uplink DCI formats. When you click one of them, the right panel shows the detailed contents and metadata of the UL grant. Key fields to look at include rb_alloc which indicates the allocated resource blocks, time_domain_rsc which shows the time domain allocation, mcs which determines modulation and coding, ndi and rv which relate to HARQ process, and harq_process which identifies the HARQ ID. You can also check tpc_command for power control and antenna_ports or dmrs related parameters for transmission configuration. By analyzing these parameters, you can understand how the gNB schedules uplink transmission, including resource size, timing, modulation level, and retransmission behavior.
This is essential for verifying whether uplink scheduling is correctly configured and whether the UE is using the granted resources as expected.

You can check the NR DL Grant by clicking on entries like dci=1_1 or dci=1_0 in the PDCCH logs.
These entries represent downlink DCI formats. When you select one, the right panel shows the contents and metadata of the DL grant. Key fields include rb_alloc which indicates the allocated downlink resource blocks, time_domain_rsc which defines the OFDM symbol allocation, and mcs which determines modulation and coding for PDSCH. You can also check ndi and rv for HARQ operation, and harq_process to track the HARQ process ID. The tpc_command may also appear for uplink power control related to this scheduling. Additional parameters such as dmrs configuration and antenna_ports define how the PDSCH is transmitted and how the UE should decode it. By analyzing these fields, you can understand how the gNB schedules downlink data, including resource size, timing, modulation level, and retransmission behavior.
This allows you to verify whether downlink scheduling is properly configured and whether the UE is receiving data as expected.

If you click on a PUSCH entry in the PHY log, you can see the detailed metadata for that uplink transmission.
The right panel shows parameters such as scheduled PRBs, which indicate the frequency resources assigned to the UE, and scheduled symbols, which define the time domain allocation. You can also see the modulation and coding scheme, which determines how data is encoded and transmitted. This reflects the link adaptation decision based on channel quality. Additional fields include HARQ related parameters such as rv and harq_process, as well as DMRS configuration and power related information.
By analyzing this metadata, you can understand exactly how the UE transmission was configured in terms of resource allocation, timing, and modulation. This helps verify whether uplink scheduling and link adaptation are working as expected.

If you click on a PDSCH entry in the PHY log, you can see the detailed metadata for that downlink transmission.
The right panel shows parameters such as scheduled PRBs, which indicate the frequency resources allocated for downlink data, and scheduled symbols, which define the time domain allocation. You can also check the modulation and coding scheme, which determines how the data is transmitted over the air. This reflects the link adaptation based on channel conditions. Additional fields include HARQ related parameters such as rv and harq_process, as well as DMRS configuration and transmission-related settings.
By analyzing this metadata, you can understand how the gNB configured the downlink transmission in terms of resource allocation, timing, and modulation. This helps verify whether downlink scheduling and link adaptation are operating correctly.

Description on PHY Info
This section explains how to read the main fields printed in the PHY log. These fields describe how uplink and downlink transmissions are scheduled and received at the physical layer. By understanding these parameters, you can interpret resource allocation, modulation, coding, retransmission behavior, signal quality, and timing related information directly from the trace log. This helps you analyze how the radio link is operating and makes it easier to troubleshoot PHY layer behavior in detail.
- PDSCH/PUSCH
- HARQ : HARQ Processor Number
- PRB : PRB location (Eg, PRB=27:22 indicates that 22 PRBs allocated starting from PRB 27)
- symb : OFDM symbol numbers (E.g, symb=0:14 indicates that 14 OFDM symbols are allocated starting from the symbol 0)
- CW : Codeword Index
- tb_len : Transport block size in Bytes
- mod : Modulation Order. This corresponds to Qm value in 3GPP spec (NOTE : this is different from mcs value. mcs value is in DCI/PDCCH info)
- rv_idx : Redundancy Version
- cr : Code Rate
- snr : SNR
- epre : Energy Per Resource Element which indicates a power of single resource element, roughly speaking it is similar to RSRP
- ta : Timing Advance in TA units
- PDCCH/DCI - NR
- rb_alloc : Frequency domain resource assignment in 3GPP spec. RB allocation (check this out for details)
- time_domain_rsc : Time domain resource assignment in 3GPP sepc (check this out for details)
- vrb_to_prb_map : VRB-to-PRB mapping in 3GPP sepc (check this out for details)
- mcs : Modulation and coding scheme in 3GPP sepc (check this out for details)
- rv_idx : Redundancy version
- si_indicator : Indicates whether the DCI is for SIB PDSCH or User traffic PDSCH
Tips : UEsim
This section provides practical tips for using the WebGUI with UEsim. Since the same WebGUI is used for both Callbox and UEsim, the overall usage and interface are almost identical. The main difference lies in the content of the logs, depending on whether the perspective is from the network side or the UE side. Understanding this helps you apply the same analysis methods across both environments with minimal adjustments.
Checking DL Power
For easy checking (not required), filter DL Physical channels and check epre power from the trace log print (For now, only PDSCH epre is printed in the log).
Select PDSCH in the Info filter so that only downlink data channels are shown. In the log message, look for the epre field, which represents the energy per resource element. This value indicates the power level of the transmitted signal for each resource element. By monitoring epre over time, you can get a quick understanding of downlink power behavior. Currently, only PDSCH epre is printed in the log, so this method focuses on downlink data channel power rather than control channels.

You can make plot for the PDSCH power epre and snr as shown below.
Select a specific UE ID and open the Analytics view. In the SNR tab, you can see plots for PDSCH snr and DL data EPRE. The SNR plot shows the signal quality over time, while the EPRE plot shows the transmit power per resource element. By observing both together, you can understand how power and channel quality vary over time and how they impact downlink performance.

Plotting TPC command vlaues
You can plot the TPC command specified in each DCI by selecting [TPC] tab as shown below. The solid line is moving average of the sequence of TPC command value and the dots are TPC command value in each DCI.
Select a specific UE ID and open the Analytics view. Then go to the TPC tab. This shows the TPC command values over time. Each dot represents a TPC command sent in a DCI. The solid line represents the moving average of these commands. By observing this plot, you can understand how transmit power is being adjusted dynamically. Stable values indicate steady power control, while frequent changes indicate active power adjustments due to varying channel conditions.

Troubleshoot
This section provides basic guidance for troubleshooting issues when accessing the WebGUI. It outlines common checks and simple actions you can take to identify and resolve connectivity or configuration problems, helping you quickly restore access and continue your analysis.
Check if http service is running OK
: Check if httpd.service is running OK. Following is an example showing the case of httpd service operating properly. If it does not run properly, you may get some errors or warnings that would help troubleshoot.
Use the command systemctl status httpd.service. If the service is operating normally, you should see the status as active (running). If the service is not running, or shows failed or inactive status, check the error messages in the output. These messages often indicate configuration issues, port conflicts, or missing dependencies. If needed, restart the service using systemctl restart httpd and check the status again.
This step helps ensure that the web server itself is functioning correctly before investigating other possible issues.

Restart Service
If the WebGUI is not accessible, try restarting the http service.
Run systemctl restart httpd.service to restart the web server. This can resolve temporary issues such as stalled processes or configuration reload problems. After restarting, verify the status using systemctl status httpd.service. Make sure the service shows active (running).
This simple step often resolves common WebGUI access issues.
Try restart the httpd using following command
systemctl restart httpd.service
Check if the service is ruuning OK
systemctl status httpd.service
Check Out Error Contents
If you get 'failure' of running the httpd server, you would get something like below. In many cases, you may find some hints for the root cause of the failure. In this specific example, I got an important hints saying "DocumentRoot '/var/www/html' is not a directory or is not readable. In my case, it turned out that the html directory in /var/www was deleted somehow and I just created the html directory there. It solved problem. However, this is only an example and you may have different root cause for the failure. You may continue to troubleshoot until the problem is resolved.
In this example the important hint is that DocumentRoot /var/www/html is not a directory or is not readable. This means the web server configuration expects that directory to exist and be accessible, but it cannot find or use it. In this case the problem was solved by recreating the missing html directory under /var/[www](http://www).
This is only one example. In your case the actual reason may be different. The main point is that the error messages printed by service httpd status or systemctl status httpd.service often contain the information needed to continue troubleshooting. Read those messages carefully and fix the reported issue one by one until the service starts normally.
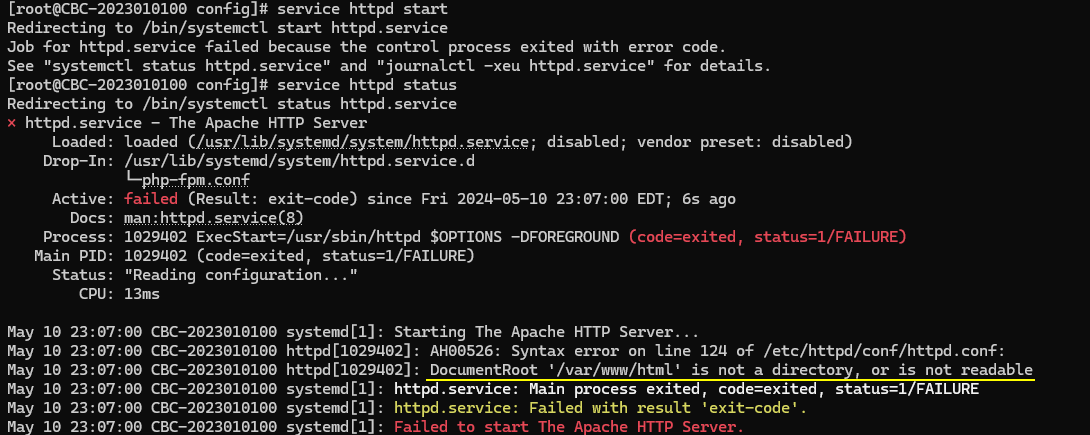
Reinstall Packages
If previous troubleshooting steps do not resolve the issue, you can reinstall the httpd package. First remove the existing package using dnf remove httpd. Then reinstall it using dnf install httpd and also install php-fpm if required. After installation, start the service using service httpd start and verify that it runs properly. Once httpd is working correctly, it is recommended to reinstall the Amarisoft package so that the proper WebGUI configuration is restored.
Remove the existing httpd service and intall it again using follows commands
dnf remove httpd
dnf install httpd
dnf install php-fpm
Start the httpd service
service httpd start