
Out of the Box Test - Command Line Commands
The purpose of this tutorial is to give you tips on how to best utilize the command line commands in Amari callbox / UE sim screen to operate the box or analyze / troubleshoot various issues. This tutorial assumes that you are already familiar with the basic operation of the callbox software (e.g, start/restart the service and launching the screen). If you are not familiar with this very basic operation, refer to this tutorial first. You don't have to read and memorize all the commands listed here. Just use this as a cheatsheet and check it out when you are not sure of which command you need to use and what is the syntax of the command.
Command Line Command is at the core of utilizing Amarisoft Product (both eNB/gNB and UEsim) and the more you know of those commands and the better you can use or troubleshoot the product. So the command line tool would be the first thing you need to learn from Day 1 and the thing you have to live forever with the Amarisoft Product. It may be a little bit intimidating to use the command line tool but we would get used to the power of the command line tool as you play more with it. There are a few categories of the operations you can do with the command line command as listed below.
- Getting the real time status and statistics : You can get various configuration information and statistics. I think this category is what you get the most familiar with. t , t spl, t cpu, tx_gain, rx_gain, rf_info , cell, cell_phy are the commands that belong to this category. These are the commands that I am personally using everytime when I use Amarisoft product.
- Changing Configuration : You can change the configuration while you are running the callbox (eNB/gNB) or UEsim. Most of the configurations are static and should be configured in *.cfg files for each components but there are some of the commands that can be changed dynamically via command line tool. tx_gain, rx_gain, log are some of the examples in this category. tx_gain, rx_gain would be the commands that you would use most frequently.
You can use the command line commands in a few different ways as listed below.
- In [screen] window : Probably you would use this way most of the time. run 'screen -x' and run the commands in the screen window as explained in this tutorial .
- Command line tool in WebGUI : Not so frequently used, but you may want to use this way if you likes to do more in WebGUI without switching back to Screen window. As shown here, you can run a command line window from WebGUI and run all the commands as you do in the [screen] window.
Table of Contents
- Out of the Box Test - Command Line Commands
Introduction
Amarisoft Callbox and UE Simulator are sophisticated test platforms designed for wireless network development, validation, and troubleshooting. At the heart of these products lies a powerful command line interface (CLI), which provides direct, granular control over both the base station (eNB/gNB) and UE simulation environments. The CLI exposes commands for real-time monitoring, dynamic configuration adjustments, and comprehensive diagnostics, enabling users to interact with the underlying software stack, radio hardware, and protocol layers. This flexibility is essential in the context of 4G LTE and 5G NR research, interoperability testing, and field troubleshooting, where rapid insight and control can dramatically accelerate development cycles. The CLI operates as a bridge between the user and the Amarisoft software architecture, interfacing with modular components such as protocol stacks, PHY/MAC layers, and radio frontends. Due to its central role, mastering the command line is fundamental for maximizing the effectiveness of Amarisoft products. Through targeted commands, users can query status, gather statistics, modify operational parameters, and investigate abnormal behaviors, making the CLI indispensable for both routine operation and advanced problem analysis. This tutorial focuses on practical usage patterns, best practices, and troubleshooting strategies related to the Amari Callbox/UEsim CLI, equipping users with the expertise necessary to fully leverage these tools in real-world scenarios.
-
Context and Overview
- Amarisoft Callbox and UE Simulator are used in wireless network R&D, providing a flexible software-defined environment for 4G/5G testing.
- The command line interface is the primary means to interact with the system's core components, offering immediate access to configuration, status, and diagnostic data.
- CLI usage spans a range of activities, from daily operation and configuration to deep troubleshooting and performance analysis.
-
Relevance and Importance
- Efficient use of CLI commands is crucial for rapid prototyping, debugging, and maintenance in both lab and field settings.
- Understanding CLI operations enables users to react promptly to network events, analyze protocol behaviors, and optimize system performance.
- The CLI is often required for tasks that cannot be performed through graphical interfaces, especially in headless or automated deployments.
-
Learning Outcomes
- Gain hands-on experience with essential CLI commands for monitoring system status, gathering real-time statistics, and modifying configurations.
- Develop troubleshooting skills by interpreting command outputs and identifying common issues in wireless network operation.
- Learn best practices for command line usage in both screen-based and WebGUI-integrated environments.
- Understand command categories and their application in everyday workflow and advanced scenarios.
-
Prerequisite Knowledge
- Familiarity with basic operation of Amarisoft Callbox/UEsim software (e.g., starting/restarting services, accessing screen sessions).
- General understanding of LTE/5G network architecture and protocol layers.
- Basic proficiency with Linux shell environments and command line interfaces.
Summary of the Tutorial
This tutorial provides procedures and methodologies for using command line commands to test, monitor, and troubleshoot a cellular test setup involving eNB/gNB, MME/AMF, and UEsim components. The summary below outlines the key test and monitoring steps as described for each system element, focusing on the use of command line utilities and their intended diagnostic or configuration functions.
-
Test Setup
- Default configuration file used; no changes made for out-of-the-box testing.
- Standard SIM card provided with the system utilized.
- Configuration changes, if necessary, are referenced in a separate configuration guide.
-
(enb) Command Procedures
- help: Lists all available commands and descriptions to assist with operation navigation.
- t: Prints logs with UE and cell info, signal quality, data rate, and CRC errors for troubleshooting.
- t ue [interval] [UE_ID]: Similar to 't', but can filter logs by UE or set log print intervals for specific UEs.
- t cpu: Displays CPU utilization and real-time processing status; high values (>100%) indicate multicore usage.
- t g: Shows global statistics including some RRC/UE information.
- cell: Displays brief info about configured cells.
- cell phy: Shows PHY-layer details for cells.
- cell main: Provides info about the main cell; generally matches 'cell' command output.
- ue: Lists UEs currently in communication with the eNB/gNB (attached and not in idle).
- m2: Executes as shown for additional monitoring (details referenced in images).
- hwcaps: Summarizes the call box hardware capabilities.
- s1: Shows core (MME/AMF) connections for eNB, listing all configured servers.
- ng: Displays core (MME/AMF) connections for gNB; not populated in NSA configurations.
- rf_info: Provides status and information of SDR cards in use.
- t spl: Monitors per-port TX/RX power in dBFS; helps detect RX chain saturation (recommend reducing rx_gain if RX MAX is 0).
- t spl dbm: Like 't spl', but outputs power in dBm (converted from dBFS).
- rx_gain: Views or sets RX gain per port or channel; essential for resolving high BLER in the receive path. Can be specified globally or per channel.
- tx_gain: Views or sets TX gain for all or individual TX ports, useful for troubleshooting downlink BLER issues. Syntax varies for command line versus configuration file use.
- cell_gain: Adjusts cell power via software (callbox), not SDR chipset. Used for multi-cell SDR scenarios.
- handover: Triggers handover between cells; requires at least two cells configured and UE in connected mode.
- pcap: Starts and stops PCAP capture (LTE only). Used to log traffic for further analysis.
-
(mme) Command Procedures
- help: Lists all supported commands and descriptions for the current software version.
- ue: Lists UEs attached to the core network, even if in RRC idle, including assigned IPs.
- ng_ran: Lists all gNBs connected to the core network (AMF).
- enb: Lists all eNBs connected to the core network (MME).
-
(UEsim) Command Procedures
- help: Lists all available commands for UEsim control and monitoring.
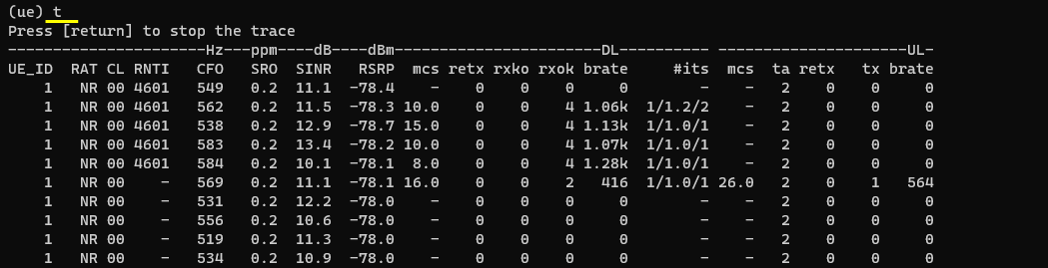
- t: Prints trace logs with detailed UE status; columns defined in documentation. Includes indicators like RSRP, HARQ stats, CFO, SRO.
- cells: Lists all configured cells; missing PCI implies a cell is configured but not synchronized.
- t spl: Prints TX/RX power per TRX port in dBFS; RX MAX value of 0 indicates saturation, suggesting to reduce rx_gain. Also monitors DAC saturation events via the 'SAT' column.
-
For high TX power or nonzero SAT count:
- Enable power_control_enabled
- Adjust tx_gain_offset
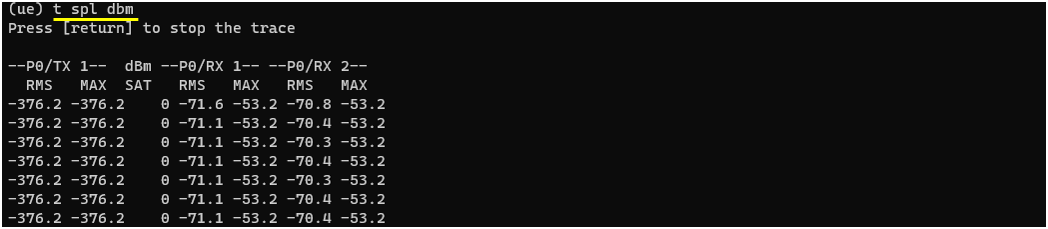
- t spl dbm: Outputs TX/RX power in dBm for each TRX port.
- ue: Lists status for each UE, indicating RRC and EMM state.
- t cpu: Monitors CPU utilization and real-time processing (values >100% indicate multicore operation).
The tutorial focuses on utilizing command line interfaces for configuration, monitoring, and troubleshooting of different network functions. It emphasizes step-by-step procedures for each command, their intended outputs, and practical considerations for interpreting results or resolving common issues.
Test Setup
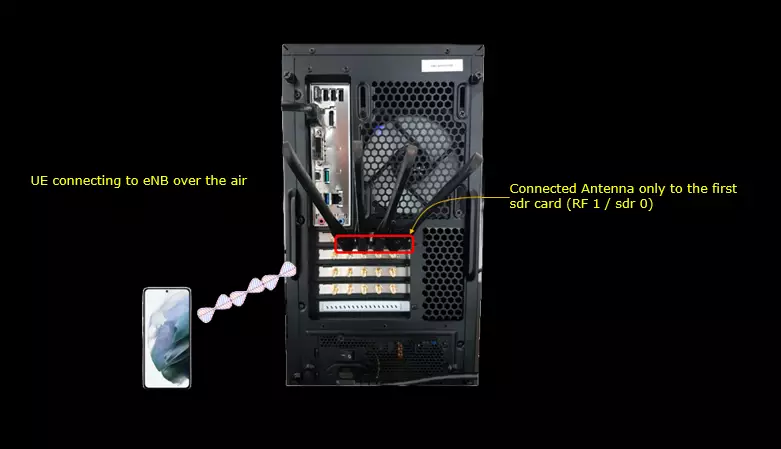
Test setup for this tutorial is as shown below. (NOTE : Basically it doesn't matter with exact hardware setup to utilize the Command Line Commands. You can use the information in this page for any test setup you are using)
- Since this test is for Out of the box testing, I used the default configuration(cfg) file without changing anything in it
- SIM Card used in this tutorial is the one delivered with the system as it is.
- If you want to change the configuration, The tutorial Information_Config_Guide.pdf would help
(enb) commands
In this section, I will show some examples of command line commands used in (enb) mode.
help
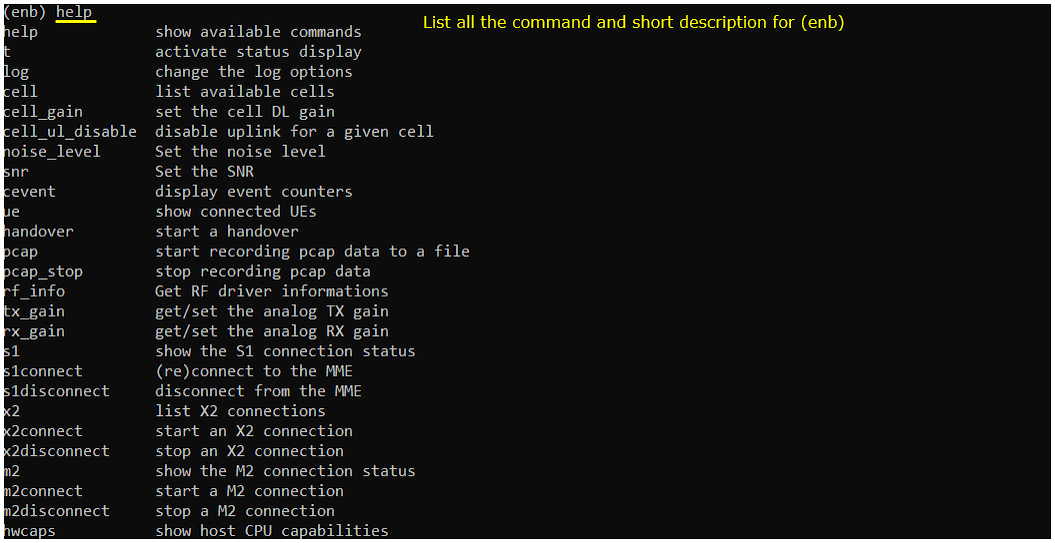
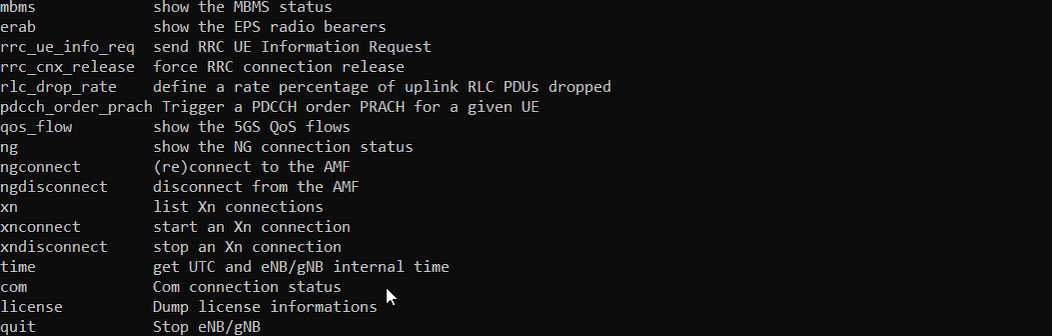
this command list all the commands you can use and short descriptions about the command.
When you enter the enb command line interface, you can type help to see the list of commands supported by the current eNB or gNB instance.
The help command is usually the first command to try because it shows what kind of control is available from the console. It gives a short description for each command, so you can quickly find the command you need.
For example, some commands are related to cell control. cell shows the list of available cells. cell_gain changes the downlink gain of a cell. cell_ul_disable disables uplink for a specific cell. cell phy shows the current cell-level PHY status.
Some commands are related to radio and RF control. abs_tx_power is used to get or set the absolute transmit power for 0 dBFS. noise_level sets the noise level. rf_info shows RF driver information. rf_cal stores the current VCXO calibration value in the SDR board calibration.
Some commands are related to network interface status. m2 shows the M2 connection status. m2connect starts the M2 connection. m2disconnect stops the M2 connection. ng shows the NG connection status. ngconnect reconnects to the AMF. ngdisconnect disconnects from the AMF.
Some commands are related to UE and protocol operation. erab shows EPS radio bearers. handover starts a handover. pdch_order_prach triggers a PDCCH order PRACH for a given UE. rrc_cnx_release forces RRC connection release. rrc_ue_info_req sends an RRC UE Information Request.
Some commands are related to logging and debugging. log changes log options. pcap starts recording packet capture data into a file. pcap_stop stops packet capture recording. qos_flow shows 5GS QoS flows.
There are also commands for system-level operation. license dumps license information. hwcaps shows CPU capabilities. quit stops the eNB or gNB process.
So this help output is not a command for changing the system by itself. It is a command reference shown directly from the running Amarisoft process. It is useful because the exact command list can depend on the Amarisoft version, enabled features, license, and whether the process is running as LTE eNB, NR gNB, or both.
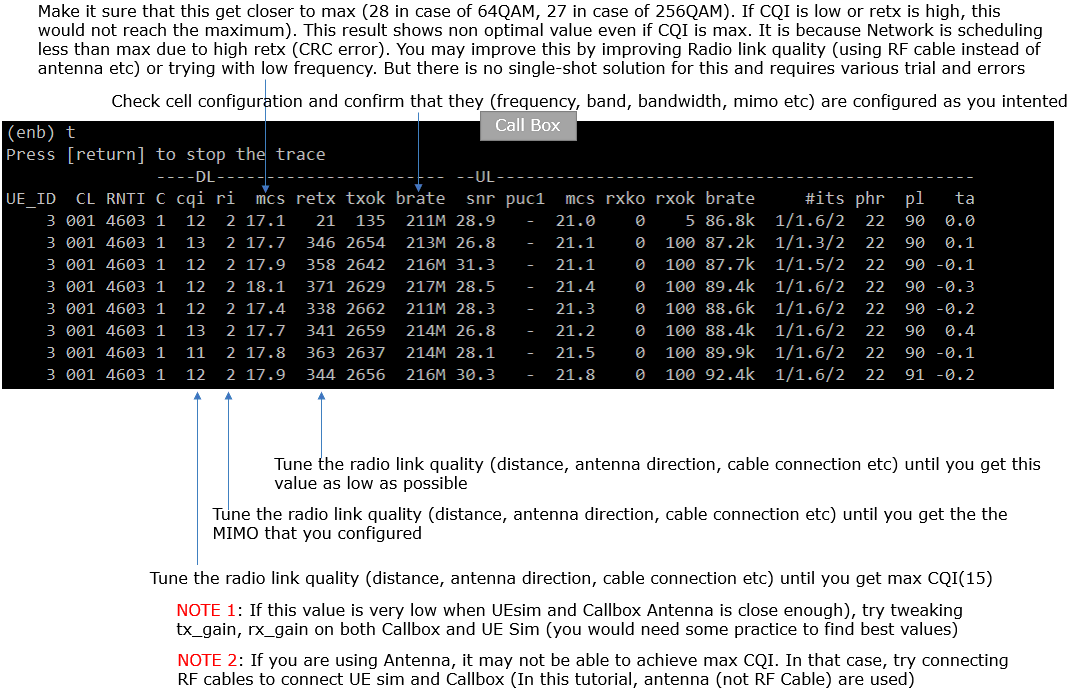
t
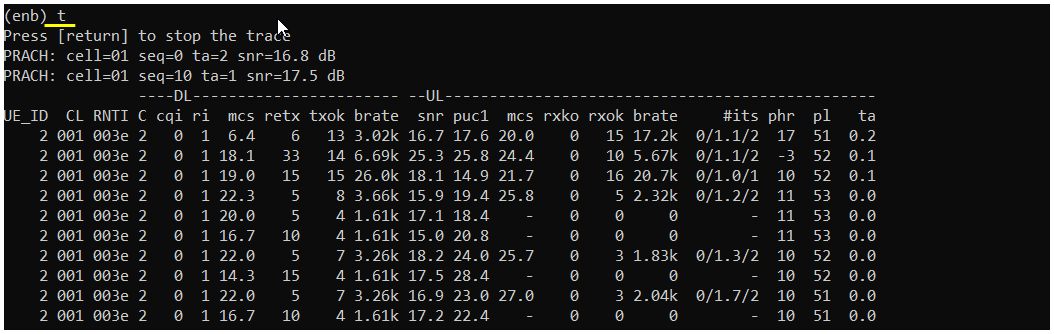
't' means 'trace'. it print out logs showing ue and cell information, signal quality, data rate, crc error etc. this is the most commonly used command and you can do a lot of troubleshooting just with this command.
This is one of the most commonly used commands in Amarisoft eNB or gNB console.
When you type t, the console starts printing live trace information. The output is refreshed continuously until you press Enter. This makes it very useful for quick troubleshooting because you can monitor UE status, cell status, radio quality, throughput, retransmission, and error behavior in real time.
At the beginning of the trace, you may see PRACH information. This shows that the base station has detected a random access preamble from the UE. The log shows the cell number, PRACH sequence number, timing advance, and SNR. This part is useful when checking whether the UE is reaching the cell and whether initial access is working properly.
After that, the trace shows a table for connected UE activity. Each row usually represents the current status of a UE at a specific trace interval.
UE_ID identifies the UE inside the Amarisoft system. CL indicates the cell. RNTI is the radio network temporary identifier assigned to the UE. These values help you know which UE the line belongs to.
The DL part shows downlink related status. cqi indicates the channel quality reported by the UE. ri indicates rank indicator. mcs shows the downlink modulation and coding scheme. retx shows downlink retransmission activity. txok shows successful downlink transport blocks. brate shows downlink bit rate.
The UL part shows uplink related status. snr shows uplink signal quality. puc1 indicates PUCCH related received quality or power-related measurement. mcs shows uplink modulation and coding scheme. rxko shows failed uplink reception. rxok shows successful uplink reception. brate shows uplink bit rate.
The remaining fields give additional physical layer and timing related information. #its is related to iteration or decoding effort. phr shows the power headroom reported by the UE. pl indicates path loss. ta shows timing advance.
This command is very useful because it gives a compact view of both radio quality and traffic activity. For example, if the UE is attached but throughput is low, you can check CQI, MCS, retransmission, SNR, and bit rate together. If random access is failing, you can check whether PRACH is detected and whether the SNR and timing advance look reasonable. If uplink is unstable, you can check UL SNR, rxko, rxok, PHR, path loss, and timing advance.
So t is a quick live monitoring command. It does not change the configuration. It simply shows the current radio and UE behavior, so it is often the first command to use when debugging Amarisoft LTE or NR operation.
You can use the result of this command and do various troubleshoot as shown below.
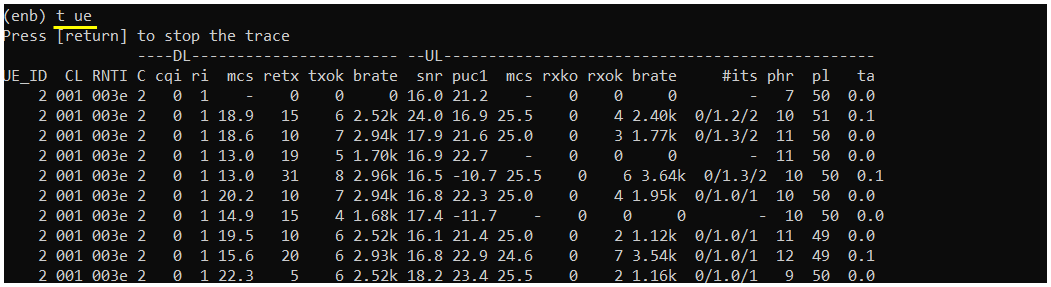
t ue
this is a variation of 't' command shown above. Unless you specify a specific UE ID, the result of this command would be similar to 't'
The basic t command shows live trace information for UE and cell activity. The t ue command focuses more on UE-related trace information.
If you do not specify a specific UE ID, the output is usually similar to the normal t command. It shows the current status of active UE or UEs in a compact table.
The command keeps printing the trace continuously. To stop it, press Enter.
In this example, UE_ID 2 is connected on cell 001 with RNTI 003e. Each line shows the radio and traffic status of the UE at that moment.
The DL part shows downlink status such as CQI, RI, MCS, retransmission, successful transmission, and downlink bit rate.
The UL part shows uplink status such as SNR, PUCCH-related value, MCS, failed reception, successful reception, and uplink bit rate.
Other fields show additional radio information such as decoding iteration, power headroom, path loss, and timing advance.
So t ue is useful when you want to monitor UE behavior in real time. It is commonly used to check radio quality, MCS, retransmission, throughput, uplink stability, and timing alignment.
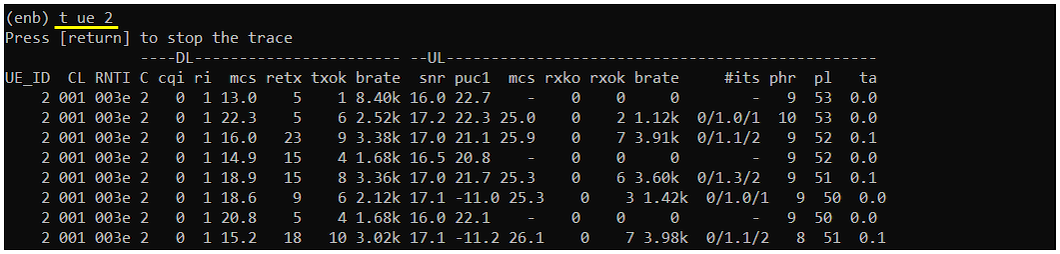
: you can control trace log print interval by specifying the interval (in sec) after t ue command as shown below. 't ue 2' mean update the log for all UEs at every 2 seconds
In this example, the command is t ue 2. This means Amarisoft prints the UE trace every 2 seconds.
The output format is the same as t ue. It shows UE ID, cell ID, RNTI, downlink status, uplink status, bit rate, retransmission, radio quality, power headroom, path loss, and timing advance.
The main difference is the refresh period. Without specifying the interval, the trace may update more frequently. By adding 2, the output becomes easier to read because each line is printed every 2 seconds.
This is useful when you want to monitor the UE for a longer time without generating too many log lines. It is also useful when you want to observe slow changes, such as MCS variation, throughput change, uplink SNR fluctuation, PHR change, or timing advance change.
So t ue 2 means start UE trace and update the trace every 2 seconds until Enter is pressed.
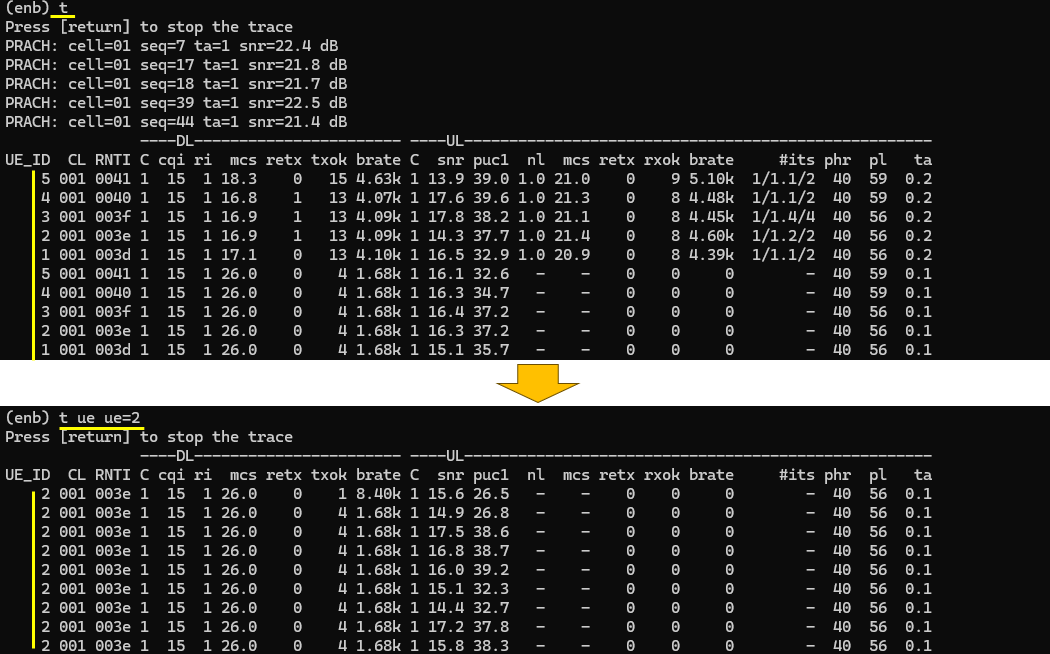
: If you specific UE_ID, you can print the log only for the UE that you specified. This can be useful for the case where multiple UEs are connected and you want to print out the log for a specific UE that you are interested.'
This is useful when multiple UEs are connected and you want to monitor only one specific UE.
In the first trace, the normal t command shows several UEs together. For example, UE_ID 1, 2, 3, 4, and 5 are shown in the same output. This is useful for checking the overall system, but it can be hard to follow one UE in detail.
In the second trace, the command is t ue ue=2. This means Amarisoft prints the trace only for UE_ID 2.
The output format is similar to the normal UE trace. It still shows downlink status, uplink status, MCS, retransmission, bit rate, SNR, PUCCH value, power headroom, path loss, and timing advance. But all the lines belong only to the selected UE.
This makes the log easier to read when you are debugging a specific UE. For example, you can use it when one UE has low throughput, unstable uplink, many retransmissions, or abnormal timing advance, while other UEs are working normally.
So t ue ue=2 means start UE trace only for UE_ID 2. The trace continues until Enter is pressed.
t cpu
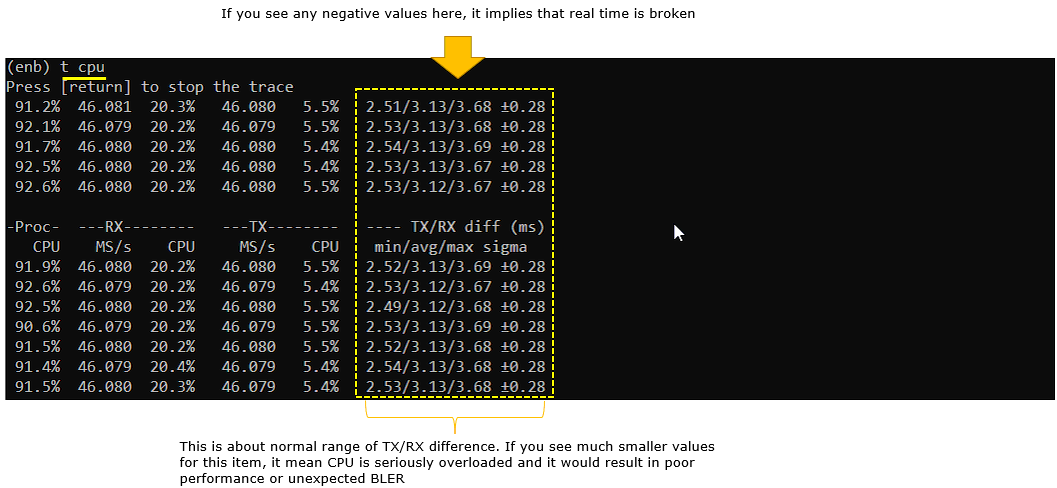
This is a good indicator showing the CPU utilization and real-time processing status. (NOTE : sometimes you would see CPU utilization goes above 100%. Even if it goes over 100%, it is completely normal. It just indicates that more than one CPU is being used. For example, if it is 210%, it mean 3 CPU cores are being used)
This command is useful when you want to check whether the system has enough CPU resource to run the radio stack in real time.
The trace keeps printing until you press Enter.
The output shows CPU usage for different processing parts such as general processing, RX processing, TX processing, and TX/RX timing difference.
The CPU value can be higher than 100%. This is normal because Amarisoft can use multiple CPU cores. For example, if the CPU value is around 210%, it means the workload is using a little more than two CPU cores.
The MS/s field shows the sample processing rate. This is related to how much baseband sample processing is being handled by the system.
The TX/RX diff field is very important for real-time operation. It shows the timing difference between transmit and receive processing. In a normal condition, this value stays in a stable positive range.
If this value becomes too small, the system may be close to real-time processing limit. If you see negative values here, it usually means real-time processing is broken. In that case, the system is overloaded or delayed, and this can cause poor performance, missed timing, or BLER increase.
So t cpu is a quick health-check command for CPU load and real-time stability. It is commonly used when debugging performance problems, unstable radio behavior, high BLER, or throughput degradation.
t g
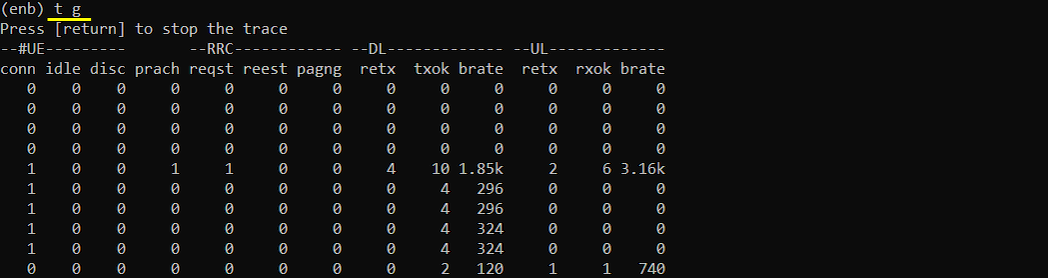
This shows a list of general statistics (global statistics) as shown below. It carries some information like 't' command and some additional information like RRC / UE information.
This command gives a compact system-level view of the current eNB or gNB activity. It includes some information similar to the normal t command, but it is summarized at a more global level instead of showing detailed per-UE radio information.
The trace keeps printing until you press Enter.
The output includes UE status, RRC status, downlink statistics, and uplink statistics.
The UE part shows how many UEs are connected, idle, or disconnected. This is useful to check the overall UE state quickly.
The RRC part shows RRC-related activity such as PRACH, RRC request, RRC reestablishment, and paging. This helps you see whether UEs are trying to access the cell or whether RRC procedures are happening.
The DL part shows downlink retransmission, successful transmission, and downlink bit rate. The UL part shows uplink retransmission or failed reception, successful reception, and uplink bit rate.
So t g is useful when you want a quick global summary of system activity. It is not as detailed as t ue, but it is easier to read when you want to check the overall status of the cell, RRC activity, and traffic flow.
cell
this commands show you the brief information about the cells that are configured.
cell shows brief information about the cells configured in the Amarisoft eNB or gNB.
This command is useful when you want to quickly check what cells are currently defined and what basic radio parameters are being used.
In this example, the output shows the PLMN and eNB ID first. PLMN=00101 indicates the configured mobile network identity. eNB ID=0x1a2d0 indicates the eNB identifier used by this eNB instance.
After that, each configured cell is listed in a table.
Cell indicates the internal cell identifier. RAT shows the radio access technology. In this example, both cells are LTE cells. BAND shows the LTE operating band. TAC is the tracking area code. dl_arfcn is the downlink EARFCN. pci is the physical cell ID. prach_seq is the PRACH root sequence index. dl_gain shows the downlink gain value. ul_dis indicates whether uplink is disabled. plmn shows the PLMN assigned to the cell.
In the example, two LTE cells are configured. Cell 0x001 is using LTE band 3 with downlink EARFCN 1575 and PCI 1. Cell 0x002 is using LTE band 7 with downlink EARFCN 3350 and PCI 2.
So cell is a quick configuration check command. It does not show detailed runtime performance. It simply confirms which cells are configured and what key cell parameters are currently active.

cell phy
This an variation of 'cell' command and it give more of phy related information.
The normal cell command shows basic cell configuration. The cell phy command shows more physical-layer related information for the configured cell.
In this example, the output shows the PLMN and gNB ID first. PLMN=00101 is the configured network identity. gNB ID=0x12345 is the gNB identifier.
The table shows one NR cell.
Cell is the internal cell identifier. RAT shows that this is an NR cell. BAND shows the NR operating band. In this example, the cell is using n78. BW shows the channel bandwidth. P shows the number of antenna ports or RF paths used for the cell.
The DL section shows downlink physical-layer parameters. It includes downlink ARFCN, number of antennas, number of layers, subcarrier spacing, and modulation order. In this example, the downlink ARFCN is 632628, SCS is 30 kHz, and QAM is 256.
The UL section shows uplink physical-layer parameters. It includes uplink ARFCN, number of antennas, number of layers, subcarrier spacing, and modulation order. In this example, uplink also uses ARFCN 632628 and 30 kHz SCS.
The SSB section shows SSB-related frequency information. It includes SSB ARFCN and SSB subcarrier spacing.
So cell phy is useful when you want to quickly confirm the PHY configuration of an NR cell, such as band, bandwidth, ARFCN, antenna configuration, layer configuration, SCS, modulation, and SSB placement.

cell main
This command shows the cell information about the main cell. In most case, this shows the same result as cell;
In most simple configurations, this command gives almost the same result as the cell command because there is only one main serving cell.
The output first shows the PLMN and gNB ID. PLMN=00101 indicates the configured network identity. gNB ID=0x12345 indicates the gNB identifier.
The table then shows the main cell configuration.
Cell is the internal cell identifier. RAT shows the radio access technology. In this example, the cell is NR. BAND shows the NR band, which is n78. TAC is the tracking area code. dl_arfcn is the downlink NR-ARFCN. pci is the physical cell ID. prach_seq is the PRACH root sequence index. dl_gain shows the downlink gain. ul_dis indicates whether uplink is disabled. plmn shows the PLMN assigned to the cell.
In this example, the main NR cell is cell 0x001. It uses band n78, TAC 0x00064, downlink ARFCN 632628, PCI 500, and PRACH sequence 1.
So cell main is a quick way to check the primary or main cell configuration. It is especially useful when the system has multiple cells, carrier aggregation, or more complex cell configuration, and you want to confirm which cell is treated as the main cell.

ue
This shows the list of UEs that is in communication with eNB/gNB. If UE is not attached or attached but in RRC idle state, you would not see the UE here.
This command is useful when you want to quickly check whether a UE is currently connected to the base station.
In this example, one UE is shown.
RAN_UE_ID is the internal UE identifier used by the Amarisoft RAN side. CN_UE_ID is the UE identifier associated with the core network side. Cell shows the serving cell where the UE is connected. RNTI shows the radio network temporary identifier assigned to the UE.
In the example, RAN_UE_ID is 3, CN_UE_ID is 123, the UE is connected on cell 0x001, and the assigned RNTI is 0x003f.
If the UE is not attached, or if the UE is attached but already released to RRC idle state, it may not appear in this list. So this command is mainly useful for checking UEs that are currently in active communication with the eNB or gNB.

m2
m2 shows the M2 connection status.
M2 is used for MBMS related communication between the eNB and the MCE or MBMS control side, depending on the network setup.
In this example, the output shows the M2 connection state. The server entry shows ss_family=0 and state=disconnected.
This means the M2 interface is not currently connected.
In many normal LTE test setups, this can be expected because MBMS is not always configured or used. If your test is only for normal LTE attach, data transfer, VoLTE, or general eNB operation, a disconnected M2 state may not indicate a problem.
This command becomes important when you are testing MBMS or eMBMS features. In that case, you can use m2 to check whether the M2 connection is established before checking MBMS service behavior.
So m2 is a simple status check command for the M2 interface. It does not start or stop the connection by itself. It only shows the current M2 connection state.

hwcaps
This shows the brief information of hardware capabilities of the call box
This command is mainly used to check which CPU instruction set features are available on the system.
In this example, the output shows CPU flags such as sse3, ssse3, sse4_1, sse4_2, aes, avx, and avx2.
These features are important because Amarisoft uses optimized signal processing routines. If the CPU supports advanced instruction sets such as AVX or AVX2, the baseband processing can run more efficiently.
This command does not show radio configuration or UE status. It simply shows the processor capability detected by the Amarisoft software.
So hwcaps is a quick hardware check command. It is useful when verifying whether the callbox or server has enough CPU capability for real-time LTE or NR processing, especially when debugging performance-related issues.

s1
This command shows that the list of core (mme or amf) that the eNB connected to. In most case you would see only one servers shown here but if you configure the eNB to multiple mme, you will get multiple items as the result of this command.
In LTE, the eNB connects to the MME through the S1 interface. This command shows which MME server the eNB is connected to and what the current connection state is.
In this example, the eNB is connected to server 127.0.1.100:36412. The state is setup_done, which means the S1 connection has been established successfully. PLMN=00101 shows the PLMN associated with this connection.
In most basic test setups, you usually see only one server in this output. If the eNB is configured with multiple MMEs, then multiple S1 connection entries can appear.
This command is useful when checking whether the eNB is properly connected to the LTE core network. If the state is disconnected or setup is not completed, the UE may detect the cell, but attach or registration through the core network will fail.
So s1 is a quick command to confirm the LTE core connection status from the eNB side.

ng
This command shows that the list of core (mme or amf) that the gNB connected to. In most case you would see only one servers shown here but if you configure the gNB to multiple mme, you will get multiple items as the result of this command.
In NR standalone mode, the gNB connects to the AMF through the NG interface. This command shows which AMF server the gNB is connected to and what the current connection state is.
In this example, the gNB is connected to server 127.0.1.10:38412. The state is setup_done, which means the NG connection has been established successfully. PLMN=00101 shows the PLMN associated with this connection.
In most basic test setups, you usually see only one AMF server in this output. If the gNB is configured with multiple AMFs, then multiple NG connection entries can appear.
This command is useful when checking whether the gNB is properly connected to the 5G core network. If the state is disconnected or setup is not completed, the UE may detect the NR cell, but registration through the 5G core can fail.
In NSA mode, you may not see this NG connection because the NR gNB does not directly connect to the core network. In NSA, the LTE eNB has the direct core network connection, and the NR side is added through dual connectivity.
So ng is a quick command to confirm the 5G core connection status from the gNB side.

rf_info
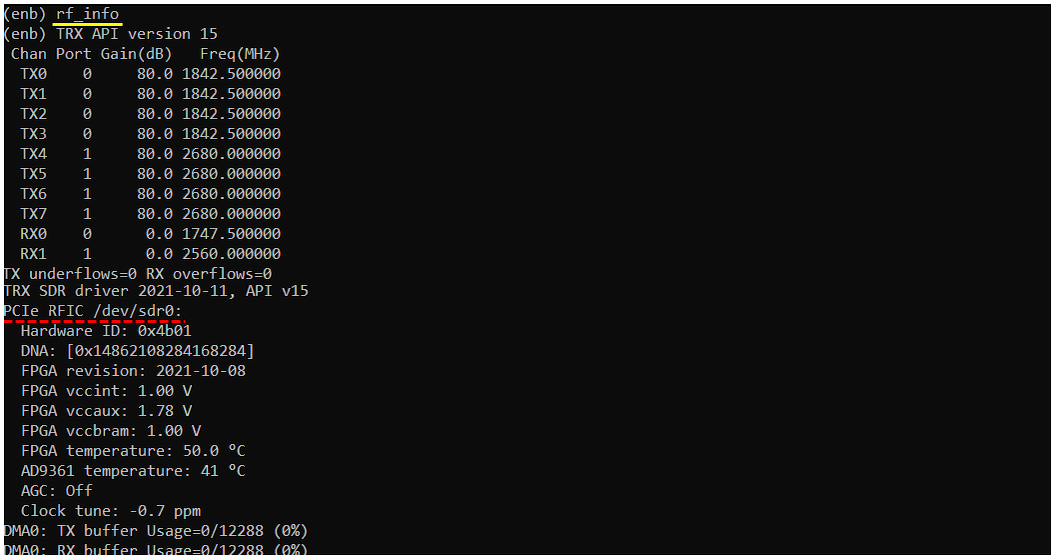
this command shows you about the information / status of the sdr cards that are being used.
This command is useful when you want to check whether the RF device is detected correctly and whether the TX and RX channels are configured as expected.
The output first shows the TRX API version. This indicates the radio driver API version used between Amarisoft software and the SDR hardware.
Then it shows TX and RX channel information. Each line shows the channel name, port number, gain value, and frequency. For example, TX0 to TX3 are using port 0 at 1842.5 MHz, and TX4 to TX7 are using port 1 at 2680 MHz. RX0 and RX1 show the receive-side frequency configuration.
The output also shows TX underflows and RX overflows. These values are important for real-time RF operation. TX underflow means the software could not provide transmit samples to the SDR fast enough. RX overflow means received samples were not processed or transferred fast enough. In this example, both are 0, so there is no underflow or overflow problem at this moment.
The later part shows SDR hardware details, such as SDR driver version, device path, hardware ID, DNA value, FPGA revision, FPGA voltage values, temperature, AGC status, clock tuning, and DMA buffer usage.
These values are useful for checking the health of the SDR board. For example, FPGA temperature can be used to check whether the board is overheating. DMA buffer usage can be used to check whether sample transfer is stable.
So rf_info is a hardware and RF status check command. It is commonly used when debugging SDR detection, RF frequency setup, gain setup, TX/RX sample flow, underflow, overflow, temperature, or FPGA-related issues.
t spl
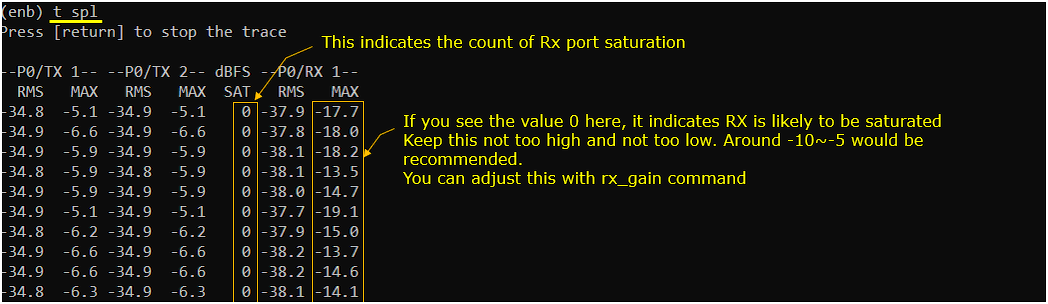
this command shows you the power related information for each and every Tx/Rx port. This is also one of the most frequently used commands. If you see 0 in RX MAX power, it indicates the RX chain is saturated and it may lead to high BLER for the received physical channel. In this case, it is recommended to tweak rx_gain to get the RX MAX to go below 0. (
The command continuously prints the power-related trace until you press Enter.
The output shows power values for each port. For TX ports, it shows RMS and MAX values. For RX ports, it also shows RMS and MAX values. RMS gives the average signal level. MAX shows the peak sample level.
The value is shown in dBFS, not dBm. dBFS means dB Full Scale. It is relative to the maximum digital sample level that the ADC or DAC can represent. So 0 dBFS means the signal has reached the maximum sample value.
For RX, this is very important. If RX MAX becomes 0, it means the RX chain is saturated. In that condition, the received signal can be clipped, and this may cause high BLER or unstable physical channel decoding.
In normal operation, RX MAX should not be too close to 0. It also should not be too low. A rough practical range around -10 to -5 dBFS can be a reasonable target, depending on the setup.
If RX MAX is too high and close to 0, you may need to reduce rx_gain. If RX MAX is too low, you may need to increase rx_gain.
The SAT column shows the count of RX saturation events. If this value increases, it means the RX port has experienced saturation. This is a strong indication that the received signal level is too high.
So t spl is mainly used to check whether TX and RX power levels are in a safe range. It is especially useful when adjusting RF gain, debugging high BLER, checking RX saturation, or verifying whether the RF input level is too strong or too weak.
t spl dbm
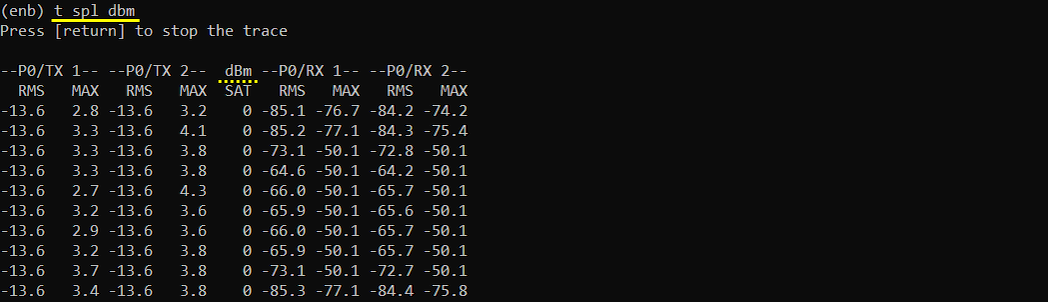
The role / meaning of this command is exactly same as 't spl' command shown above, the only difference is the unit of the power value. This command shows the power in the unit of dBm. (
The output still shows power information for each TX and RX port. For each port, RMS means average power level, and MAX means peak power level. The SAT column shows the RX saturation count.
This command is useful when you want to read the power level in a more familiar RF unit. However, the dBm value shown here is converted from the dBFS value used internally by the SDR system. It is not always the same as an absolute power value directly measured by an external power meter or spectrum analyzer.
So t spl dbm is useful for checking relative TX and RX power level in dBm-style display. It can help you monitor whether the RX signal is too strong, too weak, or close to saturation, while using a unit that is easier to understand from an RF point of view.
rx_gain
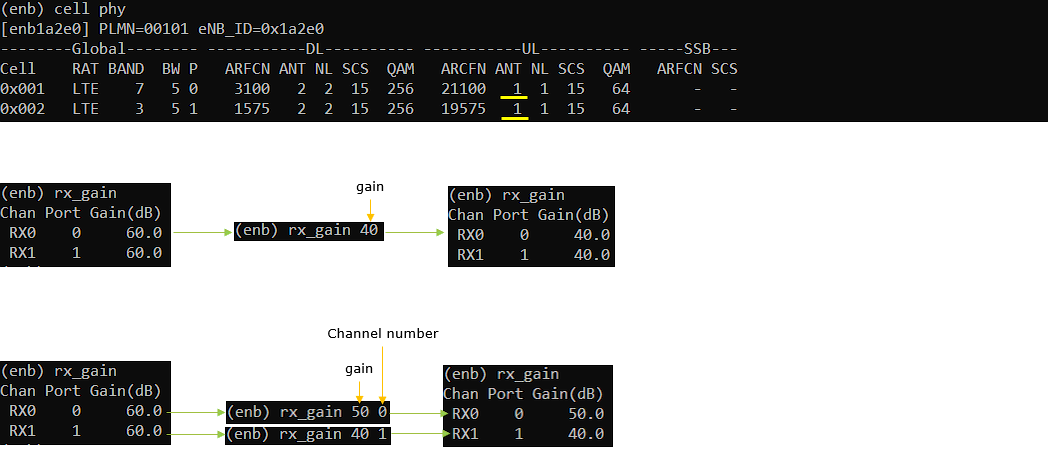
rx_gain is used to view or set the receive gain of the SDR RX port.
This is one of the most commonly used commands when troubleshooting uplink reception problems or high BLER on received physical channels.
If you run rx_gain without any parameter, Amarisoft prints the current RX gain setting for each RX port.
In this example, the output shows RX0 with port 0 and gain 60.0 dB. This means the receive gain for RX0 is currently set to 60 dB.
This command is closely related to t spl. You can first use t spl to check the RX RMS, RX MAX, and saturation status. Then you can adjust rx_gain if the received signal level is too high or too low.
If RX MAX is close to 0 dBFS, the RX chain may be saturated. In that case, rx_gain should usually be reduced. If RX level is too low, rx_gain may need to be increased.
So rx_gain is a practical RF tuning command. It is mainly used to control the receive-side signal level and improve uplink decoding stability.

If you use rx_gain with a value, Amarisoft changes the RX gain to the specified value.
In this example, the command is rx_gain 40. This sets the receive gain to 40 dB for the RX port.
After setting the value, rx_gain is executed again without parameter. This confirms the current setting. The output shows RX0 port 0 gain is now 40.0 dB.
This command is useful when the received signal level is too high or too low.
If t spl shows RX MAX close to 0 dBFS or the SAT count increases, the RX input may be saturated. In that case, you should reduce rx_gain.
If the RX level is too low and uplink decoding is unstable, you may need to increase rx_gain.
So rx_gain with a value is used to tune the receive signal level. It is often used together with t spl when troubleshooting uplink BLER, weak uplink signal, or RX saturation.

If the system has multiple RX channels, rx_gain can be applied either to all RX channels together or to each RX channel separately.
First, you can use cell phy to check how many RX antennas or RX paths are configured. In this example, two cells are shown, and the UL section shows the antenna configuration. This helps you understand which RX channels are being used.
If you run rx_gain without any parameter, Amarisoft shows the current gain for all RX channels. In the example, RX0 and RX1 are both set to 60.0 dB.
If you use rx_gain 40, the same gain value is applied to all RX channels. After the command, both RX0 and RX1 are changed to 40.0 dB.
If you want to set different gain values for different RX channels, you can add the channel number after the gain value. For example, rx_gain 50 0 sets RX channel 0 to 50 dB. rx_gain 40 1 sets RX channel 1 to 40 dB.
This is useful when each RX path has a different input level. For example, one antenna path may be close to saturation, while another path may be too weak. In that case, you can tune each RX channel separately.
So rx_gain can be used in two ways. With only a gain value, it changes all RX channels together. With gain value and channel number, it changes only the specified RX channel.
In case of command line
Specify in the form of 'rx_gain [gain] [channel' (Example, rx_gain 40, 0 ==> set rx gain 40 to the first channel/first antenna, rx_gain 40, 1 ==> set rx gain 40 to the second channel/second antenna)
For 4 cells with 1 UL antenna and 2 DL antenna as an example
rx_gain : [Cell0Ant1, Cell1Ant1, Cell2Ant1, Cell3Ant1]
tx_gain : [Cell0Ant1, Cell0Ant2, Cell1Ant1, Cell1Ant2, Cell2Ant1, Cell2Ant2, Cell3Ant1, Cell3Ant2]
tx_gain
tx_gain is used to view or set the transmit gain of the SDR TX ports.
This command controls the transmit-side gain, so it affects the downlink signal level sent from the eNB or gNB to the UE.
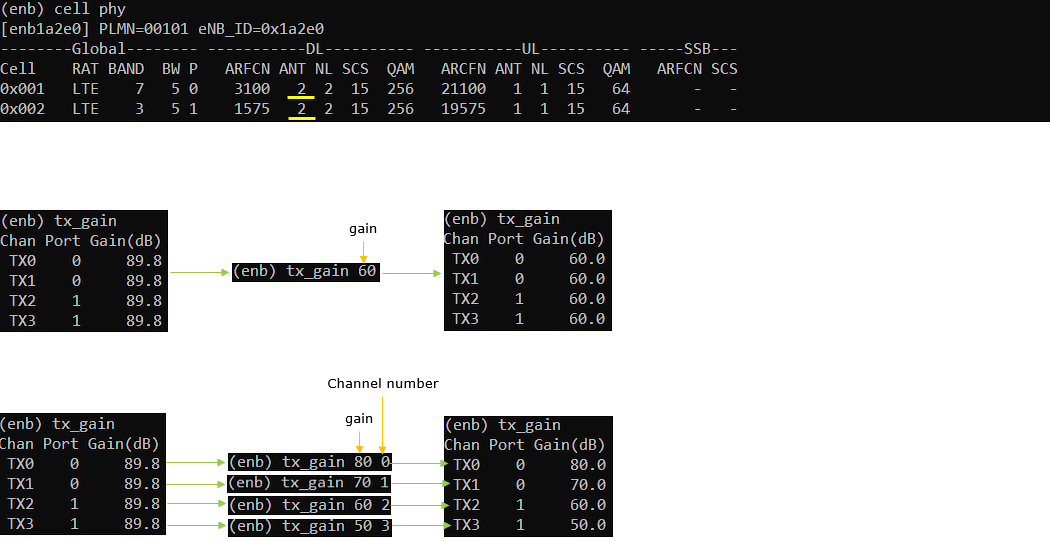
If you run tx_gain without any additional parameter, Amarisoft prints the current TX gain setting for all TX ports being used.
In this example, TX0 and TX1 are both using port 0, and both are set to 89.8 dB.
This command is useful when troubleshooting downlink reception problems at the UE side. For example, if the UE reports poor downlink quality, low CQI, low MCS, or high downlink retransmission, you may try adjusting tx_gain.
However, tx_gain should be adjusted carefully. If the TX gain is too low, the UE may receive a weak downlink signal. If it is too high, the transmitted signal may become distorted or may cause unwanted RF issues.
So tx_gain is a practical command for checking and tuning the downlink transmit power level from the Amarisoft side.

: If you use tx_gain with a value, Amarisoft changes the TX gain to the specified value.
In this example, the command is tx_gain 70. This sets the transmit gain to 70 dB for all TX ports.
After that, tx_gain is executed again without additional parameter. This confirms the current setting. The output shows that both TX0 and TX1 are now set to 70.0 dB.
This command is useful when you want to adjust the downlink transmit level from the eNB or gNB.
If the UE receives weak downlink signal, or if CQI and downlink MCS are low, you may increase tx_gain. If the transmit level is too high and causes distortion or RF-related issues, you may reduce tx_gain.
So tx_gain with a value is used to tune the downlink power level for the active TX ports. It is commonly used when troubleshooting downlink BLER, retransmission, weak UE reception, or downlink throughput problems.

If the system has multiple TX channels, tx_gain can be changed for all TX channels together or for each TX channel separately.
You can first use cell phy to check the physical configuration of the cells. In this example, the DL section shows that each cell uses two TX antennas. So multiple TX channels are being used.
If you run tx_gain without parameter, Amarisoft shows the current gain of all TX channels. In the example, TX0, TX1, TX2, and TX3 are all set to 89.8 dB.
If you use tx_gain 60, the same gain value is applied to all TX channels. After this command, all TX channels are changed to 60.0 dB.
If you want to set different gain values per TX channel, you can add the channel number after the gain value. For example, tx_gain 80 0 sets TX channel 0 to 80 dB. tx_gain 70 1 sets TX channel 1 to 70 dB. tx_gain 60 2 sets TX channel 2 to 60 dB. tx_gain 50 3 sets TX channel 3 to 50 dB.
This is useful when each TX path has a different RF condition or when you want to balance the output level between multiple antennas.
So tx_gain can be used in two ways. With only a gain value, it changes all TX channels together. With gain value and channel number, it changes only the specified TX channel.
In case of command line
Specify in the form of 'tx_gain [gain] [channel' (Example, tx_gain 40, 0 ==> set tx gain 40 to the first channel/first antenna, tx_gain 40, 1 ==> set tx gain 40 to the second channel/second antenna)
For 4 cells with 1 UL antenna and 2 DL antenna as an example
rx_gain : [Cell0Ant1, Cell1Ant1, Cell2Ant1, Cell3Ant1]
tx_gain : [Cell0Ant1, Cell0Ant2, Cell1Ant1, Cell1Ant2, Cell2Ant1, Cell2Ant2, Cell3Ant1, Cell3Ant2]
cell_gain
cell_gain is used to change the downlink gain of a specified cell.
This gain is applied by the Amarisoft callbox software, not directly by the SDR RF chipset.
In this example, the system has two NR cells. At first, both cells have dl_gain set to 0.0 dB.
The command cell_gain 1 -20 changes the gain of cell ID 1 to -20 dB. After running cell again, cell 0x001 shows dl_gain = -20.0, while cell 0x002 remains 0.0.
Then the command cell_gain 2 -40 changes the gain of cell ID 2 to -40 dB. After checking with cell again, cell 0x001 shows -20.0 dB and cell 0x002 shows -40.0 dB.
So cell_gain is useful when you want to control the relative downlink power per cell. This is especially useful when multiple cells are running on the same SDR card and you want to make one cell stronger or weaker than another cell.
The main difference from tx_gain is the control point. tx_gain changes the transmit gain at the SDR/RF side. cell_gain changes the cell-level downlink gain inside the Amarisoft software.
So tx_gain is more like RF output gain control, while cell_gain is more like per-cell digital gain control.
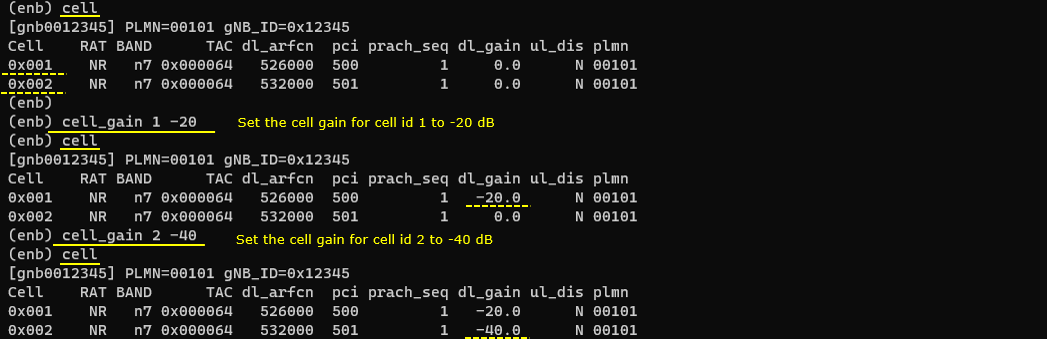
- tx_gain change tx power by Analog Device Chipset, but cell_gain change cell power by callbox software
- tx_gain changes broadcasting cell reference power in SIB message (check this out on how cell reference power works)
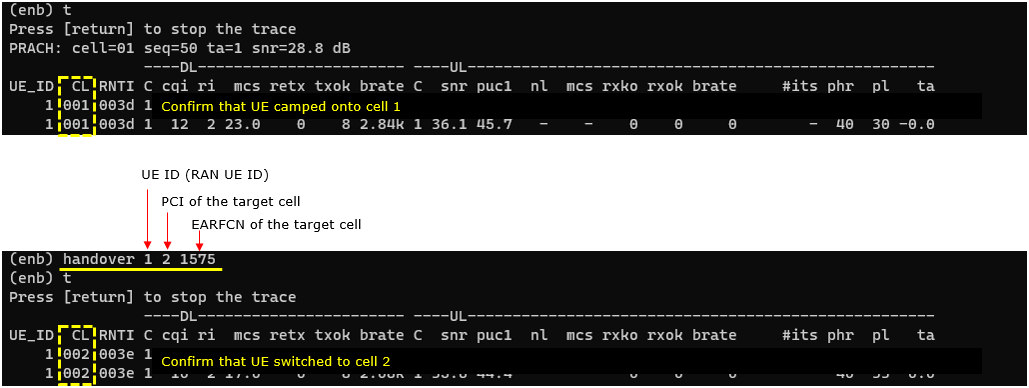
handover
handover is used to manually trigger handover for a connected UE.
Before using this command, at least two cells should be configured. The UE should also be in connected mode. If the UE is not connected, there is no active UE context to hand over.
In the first trace, UE_ID 1 is camped on cell 1. This confirms the current serving cell before handover.
The handover command takes UE ID, target cell PCI, and target cell EARFCN. In this example, handover 1 2 1575 means that UE_ID 1 is requested to move to the target cell with PCI 2 and EARFCN 1575.
After the command, the trace shows that UE_ID 1 is switched to cell 2. This confirms that the handover procedure has been triggered and the UE has moved from the original cell to the target cell.
This command is useful when you want to test handover behavior without relying on automatic measurement-based handover. It is also useful for checking whether the target cell is configured correctly, whether the UE can move to the target cell, and whether the radio connection remains stable after handover.
pcap
pcap is used to start packet capture from the Amarisoft eNB.
In this example, the command pcap -w /tmp/pingtest.pcap starts recording packet capture data and stores it into the file /tmp/pingtest.pcap.
After the command is executed, Amarisoft prints a message saying that pcap data is being recorded. The capture continues until you stop it manually. (

To stop the capture, use pcap_stop. After this command, Amarisoft stops recording and closes the pcap file.

After stopping the capture, you can check the file from Linux shell. In this example, ls /tmp/*.pcap confirms that /tmp/pingtest.pcap was created successfully.

This command is useful when you want to analyze LTE packet-level behavior with an external tool such as Wireshark.
One important note is that this pcap command is supported only for LTE. It is not generally used for other radio access technologies. In many cases, Amarisoft built-in logs are more convenient and more powerful for protocol troubleshooting, but pcap can still be useful when you want to save packets into a standard capture file.
(mme) commands
(mme) command mode is used to control and monitor the Amarisoft core network process.
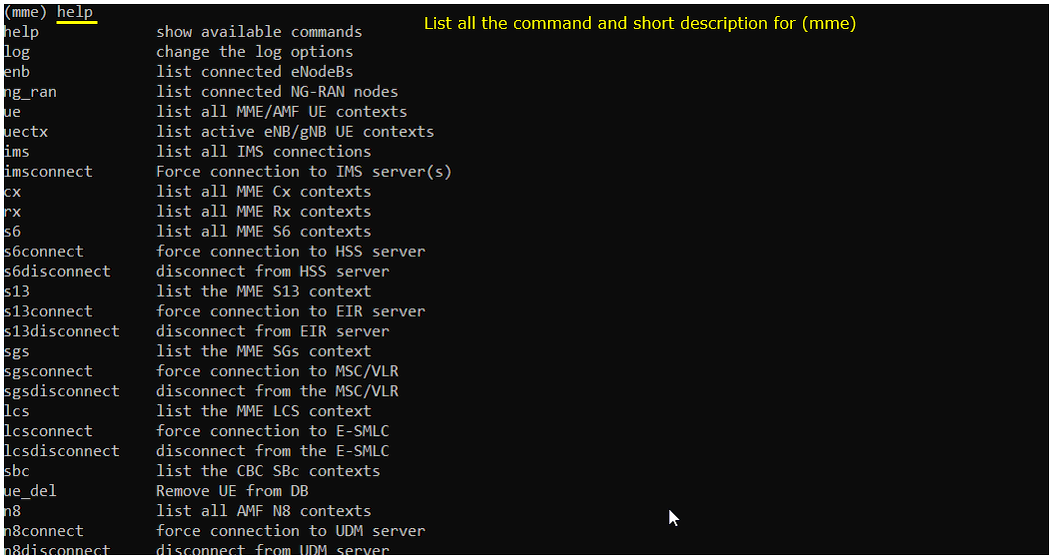
help
This will give you the list of all the commands and short descriptions that you can use in (mme). (
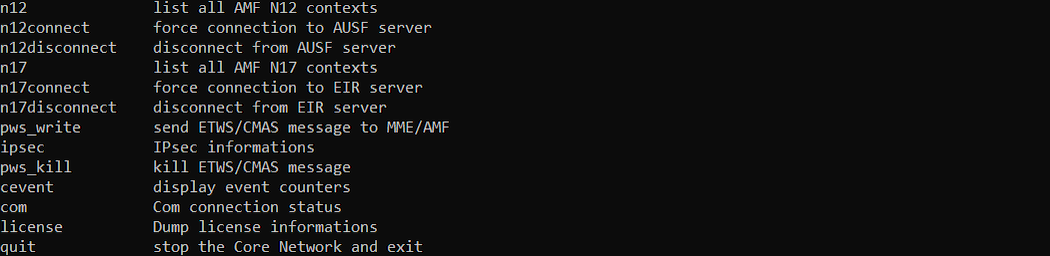
When you type help in mme mode, it prints the list of commands supported by the current MME or AMF instance. The exact list can be different depending on the Amarisoft version, license, and enabled features. So it is always useful to check help directly on your system.
The command list includes LTE EPC related commands, 5GC related commands, IMS related commands, location service commands, broadcast message commands, and general monitoring commands.
For LTE EPC, commands such as s1, s6, s13, sgs, rx, and ue are used to check contexts or connections related to MME operation. For example, s1 shows MME S1 contexts, s6 shows HSS connection contexts, and ue lists MME or AMF UE contexts.
For 5GC, commands such as n1, n2, n8, n12, n17, and ng_ran are used to check AMF related contexts. For example, n2 lists AMF N2 contexts, n8 shows UDM connection contexts, n12 shows AUSF connection contexts, and ng_ran lists connected NG-RAN nodes.
There are also connect and disconnect commands. For example, s6connect can force connection to the HSS server, and s6disconnect can disconnect from the HSS server. Similarly, n8connect and n8disconnect are used for UDM connection control.
Some commands are related to IMS and service functions. ims shows IMS connections, imsconnect forces connection to IMS servers, and imsdisconnect disconnects from IMS servers. apn shows PDN or DNN information.
Some commands are related to UE and context management. ue lists MME or AMF UE contexts. uectx lists active eNB or gNB UE contexts. ue_del removes a UE from the database.
There are also commands for logging, counters, license, version, and system operation. log changes log options. count displays event counters. license dumps license information. version shows the software version. quit stops the core network process and exits.
So help in mme mode is the starting point for checking what you can do from the Amarisoft core network console. It gives a quick command reference for EPC, 5GC, IMS, UE context, external interface connection, and troubleshooting commands.
ue
: ue in mme mode shows the list of UEs known by the core network.
This is one of the most commonly used commands in mme mode because it shows whether the UE completed attach or registration and what IP address was assigned to the UE.
This command is different from the ue command in enb mode. In enb mode, ue mainly shows UEs currently active at the radio connection level. In mme mode, ue shows core network UE context. So even if the UE moves to RRC idle state, the UE can still appear here as long as the core network context remains.
In this example, one UE is listed. SUPI shows the subscriber identity. IMEISV shows the device identity. CN indicates whether the UE is using EPC or 5GC. M-TMSI or 5G-TMSI shows the temporary identity assigned by the core network. REG indicates the registration or attach state. TAC shows the tracking area code.
#BEARER shows the number of bearers associated with the UE. IP_ADDR shows the IP addresses assigned to the UE. In this example, the UE has IPv4 addresses such as 192.168.3.2 and 192.168.4.2, and also an IPv6 prefix.
These IP addresses are important for data testing. Before running ping, iperf, or throughput test, you usually check this command first to confirm that the UE has received the expected IP address.
So ue in mme mode is a quick command to check UE core registration status, subscriber identity, bearer count, and assigned UE IP address.

ng_ran
: ng_ran in mme mode shows the list of NG-RAN nodes connected to the core network.
In NR standalone mode, this usually means the list of gNBs connected to the AMF through the NG interface.
In this example, one NG-RAN node is shown.
PLMN shows the network identity used by the connected gNB. RAN_ID shows the gNB identifier. IP:Port shows the IP address and port of the connected gNB side. #UEctx shows the number of UE contexts currently associated with this NG-RAN node. TACs shows the tracking area code supported by this gNB.
In the example, the gNB with RAN_ID 0x12345 is connected from 127.0.1.1:35007. The TAC is 0x64. The #UEctx value is 0, so there is no UE context currently active through this gNB at that moment.
This command is useful when checking whether the AMF has successfully received and accepted the NG setup from the gNB.
So ng_ran is a quick core-side command to confirm that the gNB is connected to the AMF and to check its PLMN, RAN ID, IP address, UE context count, and TAC information.

enb
: enb in mme mode shows the list of eNBs connected to the core network.
In LTE, this means the list of eNBs connected to the MME through the S1 interface.
In this example, one eNB is shown.
PLMN shows the network identity used by the connected eNB. eNB_ID shows the eNB identifier. IP:Port shows the IP address and port of the connected eNB side. #UEctx shows the number of UE contexts currently associated with this eNB. TACs shows the tracking area code supported by this eNB.
In the example, the eNB with eNB_ID 0x1a2d0 is connected from 127.0.1.1:47324. The TAC is 0x1. The #UEctx value is 0, so there is no active UE context through this eNB at that moment.
This command is useful when checking whether the MME has successfully received and accepted the S1 setup from the eNB.
So enb is a quick core-side command to confirm that the LTE eNB is connected to the MME and to check its PLMN, eNB ID, IP address, UE context count, and TAC information.

(UEsim) commands
(UEsim) command mode is used to control and monitor the Amarisoft UE simulator.
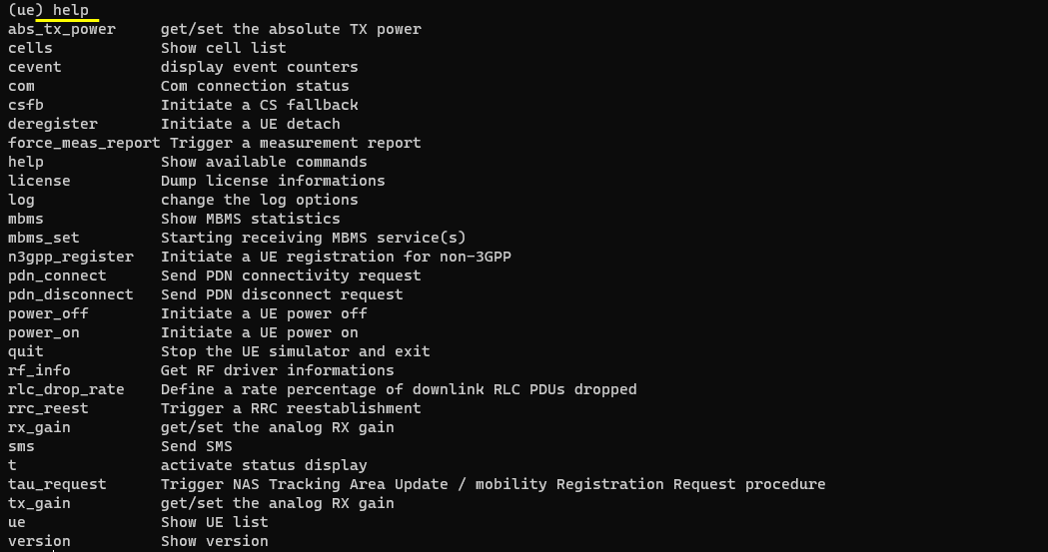
help
list all the commands available.
When you type help in ue mode, it prints the list of commands available in the UE simulator console.
This command is usually the first command to try because it shows what kind of UE control is supported by the current UEsim version and configuration.
Some commands are related to UE registration and mobility. power_on initiates UE power on. power_off initiates UE power off. deregister initiates UE detach. tau_request triggers Tracking Area Update or mobility registration request. rrc_reset triggers RRC reestablishment.
Some commands are related to packet data connection. pdn_connect sends a PDN connectivity request. pdn_disconnect sends a PDN disconnect request. These commands are useful when testing bearer setup, IP address allocation, and data session behavior.
Some commands are related to voice and messaging service. csfb initiates CS fallback. sms sends SMS. sms_command sends SMS-COMMAND.
Some commands are related to measurement and radio behavior. force_meas_report triggers a measurement report. rlc_drop_rate defines a rate percentage of downlink RLC PDUs dropped. rx_gain and tx_gain are used to get or set analog RF gain. rf_info shows RF driver information.
Some commands are related to monitoring and debugging. t activates the status display. ue shows the UE list. ue_sim lists simulations. log changes log options. count displays event counters. version shows the software version. license dumps license information.
There are also commands for non-3GPP and MBMS operation. n3gpp_register initiates UE registration for non-3GPP access. n3gpp_power_off powers off non-3GPP. mbms shows MBMS statistics. mbms_set starts receiving MBMS services.
So help in ue mode gives a quick command reference for the UE simulator. It is useful for checking what UE actions can be triggered manually, such as registration, detach, PDN connection, SMS, measurement report, mobility update, RF gain control, and status monitoring.
t
t in UE simulator mode prints the live UE trace log.
This command is used to monitor the current radio and traffic status from the UE side. The trace continues until you press Enter.
The output shows one line per update interval. Each line gives the current status of the simulated UE, including serving RAT, cell index, RNTI, frequency offset, radio quality, downlink status, and uplink status.
UE_ID identifies the simulated UE. RAT shows the radio access technology, such as NR or LTE. CL shows the cell index. RNTI shows the radio temporary identifier assigned to the UE.
The radio quality part shows values such as CFO, SRO, STNR, and RSRP. CFO indicates carrier frequency offset. SRO indicates sampling rate offset. STNR indicates signal-to-noise related quality. RSRP shows the received reference signal power.
The DL part shows downlink reception status. It includes MCS, retransmission count, failed reception, successful reception, downlink bit rate, and decoding iteration information. These values are useful when checking how well the UE is receiving downlink data.
The UL part shows uplink transmission status. It includes uplink MCS, timing advance, retransmission, successful transmission, and uplink bit rate. These values are useful when checking UE uplink behavior.
So t in UE simulator mode is the basic live monitoring command. It is commonly used to check whether the UE is synchronized, connected, receiving downlink data, transmitting uplink data, and maintaining stable radio quality.
Meaning of each column is described in UEsim doc. (
cells
cells in UE simulator mode shows the list of configured cells from the UE side.
This command is useful when you want to check which cells are configured in UEsim and whether the UE has detected them correctly.
In this example, one NR cell is shown as Cell #0.
PCI shows the physical cell ID detected by the UE. In this example, the PCI is 500. TDD shows the TDD configuration information. EARFCN shows the downlink and uplink ARFCN values. RB shows the configured downlink and uplink bandwidth in resource blocks.
If PCI is missing in this output, it usually means the cell is configured in UEsim, but the UE has not detected or synchronized to the cell yet.
So cells is a quick command to check the configured cell list and confirm whether the UE simulator can see the target cell. It is useful when debugging cell search, synchronization, ARFCN mismatch, PCI mismatch, or bandwidth configuration problems.

t spl
t spl in UE simulator mode shows TX and RX power level for each TRX port.
The values are shown in dBFS scale. This is not dBm. dBFS means dB Full Scale, so 0 dBFS means the signal reaches the maximum digital sample level.
The most important value to check is RX MAX.
If RX MAX becomes 0, it means the RX port is saturated. In that condition, the received signal can be clipped, and the UE may have decoding problems. This can lead to high BLER, unstable synchronization, or poor downlink reception.
In this example, RX MAX values are around -6 dBFS to -4 dBFS. This is close to the upper range but still below 0, so it is not saturated in the shown output.
If RX MAX is too close to 0, you should reduce rx_gain. A practical target is often around -10 to -5 dBFS, depending on the setup.
The SAT column shows the saturation count. If this value increases, it means the RX path has experienced saturation.
So t spl is useful when checking whether the UE simulator is receiving the signal with a proper input level. It is commonly used together with rx_gain when debugging downlink BLER, weak reception, or RX saturation.

The sat column counts the number of times the UE simulator had to limit the TX power of an uplink signal (e.g. PUCCH or PUSCH) so that it does not give a saturated output on the DAC. These saturations do not degrade the signal as the saturation at the sample level (see t spl monitor command) but they indicate that the UE received power at the eNodeB will be lower than expected by the channel simulator.
- enable power_control_enabled
- set tx_gain_offset
t spl dbm
t spl dbm in UE simulator mode shows TX and RX power level for each TRX port in dBm format.
This command is similar to t spl. The main difference is the displayed unit.
In t spl, the power level is shown in dBFS. In t spl dbm, the power level is shown in dBm-style value.
The output shows RMS and MAX values for each TX and RX port. RMS indicates the average power level. MAX indicates the peak power level. The SAT column shows the saturation count.
This command is useful when you want to read the UE simulator power level in a more familiar RF unit.
However, the value shown here should be interpreted carefully. It is derived from the SDR power scale and may not be exactly the same as the value measured by an external power meter or spectrum analyzer.
So t spl dbm is mainly used as a convenient power monitoring command. It helps you check whether the UE simulator RX input level is reasonable and whether any RX port is getting close to saturation.
ue
ue in UE simulator mode shows the status of every configured UE.
This command is useful when you want to check the UE state from the simulator side.
In this example, one NR UE is shown.
UE_ID is the internal UE identifier in UEsim. CL shows the cell index. RNTI shows the radio temporary identifier. RRC_STATE shows the radio connection state with the RAN, such as idle or connected. EMM_STATE shows the core network registration state. #ERAB shows the number of active bearers. IP_ADDR shows the IP address assigned to the UE.
In this example, the UE is in RRC idle state, but EMM_STATE is registered. This means the UE has completed registration with the core network, but it is not currently in active RRC connected mode.
The IP address is 192.168.2.2. This is important for data testing, such as ping or throughput test.
So ue in UE simulator mode is a quick command to check whether the simulated UE is registered, whether it is RRC idle or connected, how many bearers are active, and what IP address has been assigned.

t cpu
t cpu in UE simulator mode shows CPU utilization and real-time processing status.
This command is useful when you want to check whether the UEsim process has enough CPU resource to run the simulated UE in real time.
The trace continues until you press Enter.
The output shows processing load for the UE simulator. Proc shows the general CPU usage. RX shows receive-side sample processing rate and CPU usage. TX shows transmit-side sample processing rate and CPU usage.
The CPU value can be higher than 100%. This is normal because the process can use more than one CPU core. For example, 210% means a little more than two CPU cores are being used.
The TX/RX diff field is important for real-time operation. It shows the timing difference between transmit and receive processing. In a normal condition, this value should stay positive and stable.
If this value becomes too small, the system may be close to its real-time processing limit. If it becomes negative, it usually means real-time processing is broken. This can cause unstable UE behavior, poor throughput, or radio decoding problems.
So t cpu is a quick health-check command for UEsim CPU load and real-time stability. It is commonly used when debugging performance problems, timing issues, or unstable UE simulation behavior.
