SDR Spectrum Analyzer
The purpose of this tutorial is to shows how to use sdr card on callbox or UE as a spectrum analyzer. It is useful tool to check up the receiver functionality of the specified sdr card and check up the transmission functionality of other sdr (neighbouring) cards.
you don't need to have any separate hardware for the spectrum analyzer introduced in this tutorial. You can use any sdr cards that you already have installed in your Callbox or UEsim if you don't use it for any other purpose. For example, let's assume that you have two sdr cards in your system and you are running an LTE cell using the first sdr card (i.e, sdr0). Then you can use the second sdr cards (i.e, sdr1) as a spectrum analyzer. If you are not running lte service meaning that you are not activating any cell (i.e, no LTE cell, no NR cell), you can use both cards (i.e, sdr0 and/or sdr1) as spectrum analyzer. So if you have a callbox or UEsim with multiple SDR cards, it is same as you have multiple spectrum analyzer for free.
Major features that SDR spectrum analyzer provides are listed below.
- Plot the signal power in time domain, frequency domain or in waterfall in real time
- Walk through the spectrogram(waterfall). It can display spectrogram and waveform plot on the same screen and allow you to walk through(scroll through) each frequency on spectrogram (see this)
- Capture I/Q data from the incoming signal and save it into files
- Plot the signal power in time domain, frequency domain or in waterfall from the saved binary file (
NOTE : This binary file should be the ones that ware captured by Amarisoft software.)
In some aspect, this spectrum analyzer is not like dedicated spectrum analyzer. Followings are what you should not expect in comparision to a dedicated spectrum analyzer
- It does not provide wide frequency range. The frequency rate in this spectrum analyzer is a little bit limited. It is up to sample rate. Simply put, the frequency range would be barely enough for displaying the full bandwidth (e.g, 20 Mhz for LTE, 50 Mhz for NR with sdr 50, 100 Mhz for NR with sdr100).
- It does not have capability to show the constellation. (NOTE : If you want to show the constellation for incoming uplink while a call is connected, you can use WebGUI to display constellation. check out this tutorial for the constellation).
- It does not have Pre Amplifier
Table of Contents
- SDR Spectrum Analyzer
- Introduction
- Summary of the Tutorial
- Why Spectrum Analyzer on Protocol Box ?
- Test Setup
- Key Command Line
- Running on Callbox
- Running on ssh
- Test 1 : LTE on sdr 0 and Spectrum on sdr 1
- Configuration
- Run Lte Service
- Running Spectrum Analyzer with basic parameters
- Running Spectrum Analyzer with more parameters
- Test 2 : LTE on sdr 0 with different frequencies and Spectrum on sdr 1
- Configuration
- LTE Band 1 at 2140.0 Mhz
- LTE Band 2 at 1960.0 Mhz
- LTE Band 3 at 1842.0 Mhz
- LTE Band 4 at 2130.0 Mhz
- LTE Band 5 at 881.5 Mhz
- LTE Band 7 at 2680.0 Mhz
- LTE Band 20 at 806.0 Mhz
- LTE Band 71 at 634.4 Mhz
- LTE Band 72 at 463.4 Mhz
- Test 3 : LTE on sdr 0 (and 1) with different bandwidth and Spectrum on a remaining sdr
- Configuration
- LTE with BW 1.4 Mhz in Band 7
- LTE with BW 3 Mhz in Band 7
- LTE with BW 5 Mhz in Band 7
- LTE with BW 10 Mhz in Band 7
- LTE with BW 15 Mhz in Band 7
- LTE with BW 20 Mhz in Band 7
- LTE with 2 x BW 20 Mhz in Band 7
- Test 4 : sdr_test-generated OFDM signal on sdr 0 and sdr_spectrum on sdr 1
- Configuration
- OFDM BW 5 Mhz at Center Frequency = 500 Mhz
- OFDM BW 5 Mhz at Center Frequency = 1000 Mhz
- OFDM BW 5 Mhz at Center Frequency = 1500 Mhz
- OFDM BW 5 Mhz at Center Frequency = 2000 Mhz
- OFDM BW 5 Mhz at Center Frequency = 2500 Mhz
- OFDM BW 5 Mhz at Center Frequency = 3000 Mhz
- OFDM BW 5 Mhz at Center Frequency = 3500 Mhz
- OFDM BW 5 Mhz at Center Frequency = 4000 Mhz
- OFDM BW 5 Mhz at Center Frequency = 4500 Mhz
- OFDM BW 5 Mhz at Center Frequency = 5000 Mhz
- OFDM BW 5 Mhz at Center Frequency = 5500 Mhz
- OFDM BW 5 Mhz at Center Frequency = 5990 Mhz
- Test 5 : sdr_test-generated CW signal on sdr 0 and sdr_spectrum on sdr 1
- Enabling AGC / Finding Optimal Spectrum
- Power with Frequency Range
- Time Domain Waterfall Plot
- Trigger Mode
- Mixed Mode
- Analyzing LTE CRS
- Full Frequency Spectrum
- Channel Scan
- Saving I/Q Data into a file
- Spectrum from a file
- Signal Generation from a file
Introduction
Software Defined Radio (SDR) technology has revolutionized the way wireless communication systems are designed, tested, and analyzed, providing unprecedented flexibility and programmability across a broad range of radio frequencies and protocols. In advanced test environments such as Callbox or UE simulation platforms, SDR cards serve as versatile transceivers capable of emulating network nodes, user equipment, or even acting as diagnostic tools, such as spectrum analyzers. An SDR-based spectrum analyzer leverages the inherent capability of SDR hardware to digitize wide swaths of radio spectrum and process them in real time using powerful software algorithms. This enables engineers and researchers to visualize signal power in time or frequency domains, capture I/Q data, and analyze RF behavior without the need for dedicated, often costly, spectrum analysis equipment. By repurposing installed SDR cards—whether in a Callbox test system or a UE simulator—users can monitor RF environments, validate receiver and transmitter functionality, and troubleshoot wireless setups. While SDR-based spectrum analyzers may not fully match the sensitivity, bandwidth, or feature set of specialized commercial analyzers, they offer a highly accessible and integrated alternative for quick diagnostics and educational exploration within the constraints of SDR hardware. In the broader wireless ecosystem, such tools are essential for rapid prototyping, functional verification, and gaining hands-on RF intuition, especially in lab and development settings where flexibility and cost-efficiency are paramount.
-
Context and Background
- SDR technology decouples radio functionality from fixed hardware, enabling software control over modulation, demodulation, and signal processing.
- Modern test platforms, such as Callbox and UEsim, often incorporate multiple SDR cards for enhanced flexibility in testing various wireless protocols and scenarios.
- Utilizing SDR cards as spectrum analyzers eliminates the need for separate, dedicated hardware, streamlining test bench setups and reducing costs.
-
Relevance and Importance of the Tutorial
- Understanding SDR-based spectrum analysis is crucial for RF engineers, wireless developers, and researchers involved in protocol verification, device validation, and wireless troubleshooting.
- This tutorial demonstrates practical methods to leverage existing SDR infrastructure for RF spectrum visualization and analysis, maximizing the utility of available resources.
- It empowers users to perform essential receiver and transmitter checks, signal monitoring, and data capture without disrupting ongoing network simulation tasks.
-
Tutorial Outcomes
- Learn how to configure and operate SDR cards as spectrum analyzers within Callbox and UE simulation environments.
- Gain hands-on experience in visualizing signal power over time, frequency, and waterfall spectrograms in real time.
- Understand how to capture and analyze I/Q data for deeper RF investigations and post-processing.
- Develop intuition about RF signal behavior under different operational conditions using software-based tools.
-
Prerequisite Knowledge and Skills
- Basic understanding of wireless communication principles and RF signal characteristics.
- Familiarity with SDR concepts and operation, including installation and configuration on Callbox or UEsim platforms.
- General experience with software-based signal analysis tools and interpreting spectrum plots.
- Awareness of the hardware limitations and safety requirements for SDR devices, such as maximum allowable input power.
Summary of the Tutorial
This tutorial demonstrates various test procedures and methodologies for analyzing RF signals using the Amarisoft Callbox and its integrated spectrum analyzer software (sdr_spectrum). The procedures cover setup, configuration, execution, and analysis across multiple test scenarios involving different signal types, frequencies, and bandwidths. Below is a structured summary preserving the original content's formatting and technical details.
- Test Setup
- Setup A: Antenna or RF cables are connected to multiple SDR cards as needed. SDR1 measures power from SDR0 via antenna (for higher accuracy and stability, use RF cable for conductive measurement).
- Setup B: SDR 0 TX1 → SDR 1 RX1 and SDR 0 TX2 → SDR 1 RX2 (used for certain tests requiring direct cable connection).
- Key Command Line Tools
sdr_spectrum- Used for spectrum analysis.sdr_test- Used for generating OFDM or CW signals for test purposes.sdr_play- Used to play IQ files through SDR hardware.
- Running Spectrum Analyzer
- On Callbox: Switch to graphics mode and open separate terminals for LTE service and spectrum analyzer.
- Via SSH: Use
ssh -Xto enable X11 forwarding for remote spectrum display (works on X11-based systems).
- Test 1: LTE on SDR0 and Spectrum on SDR1
- Run LTE (eNB/gNB) on SDR0, measure spectrum on SDR1.
- Use
./sdr_spectrum -args "dev0=/dev/sdr1" -rx_freq <frequency>to observe the spectrum. - Adjust RX gain using Up/Down keys. Switch display modes (power vs time, time scale) using 'o', '+/-', and other keys.
- For advanced visualization, enable waterfall plot and adjust color/contrast with keys.
- Test 2: LTE on SDR0 with Different Frequencies, Spectrum on SDR1
- Repeat Test 1 across various LTE bands (e.g., Band 1 at 2140 MHz, Band 2 at 1960 MHz, etc.).
- Document and compare resulting spectrum plots for each frequency.
- Test 3: LTE on SDR0 (and 1) with Different Bandwidths, Spectrum on Remaining SDR
- Transmit LTE signals with varying channel bandwidths (e.g., 1.4, 3, 5, 10, 15, 20, and 2x20 MHz).
- Observe the impact of bandwidth changes on the measured spectrum.
- Test 4: SDR_Test-Generated OFDM Signal on SDR0, Spectrum on SDR1
- Generate OFDM signals with
sdr_testand observe withsdr_spectrum. - Use direct RF cable for accuracy. Vary center frequency and record results (e.g., 500 MHz to 5990 MHz).
- Generate OFDM signals with
- Test 5: SDR_Test-Generated CW Signal on SDR0, Spectrum on SDR1
- Generate CW (continuous wave) signals with
sdr_test, observe withsdr_spectrum. - Test both user-defined and default tone_offset parameters. Ensure parameter constraints are met.
- Generate CW (continuous wave) signals with
- Additional Features & Methodologies
- AGC (Automatic Gain Control): Optimize RX gain by pressing 'a' key; observe spectrum changes before and after AGC.
- Power in Frequency Range: Available in software release 2022-04-01 or later; measures power within a selected frequency span.
- Time Domain Waterfall Plot: Access by pressing 't' in spectrum analyzer; visualizes power variations over time.
- Trigger Mode: Level trigger for event detection (e.g., PRACH detection in LTE); advisable to separate UL/DL in TDD with RF circulator.
- Mixed Mode: From 2023-09-08 release, supports combined waterfall and frequency spectrum display; toggle with 'x' key, scroll with arrow keys, and analyze by time/frequency correlation.
- LTE CRS Analysis: Use cable connections for clear analysis of multiple MIMO antenna ports; visualize reference signals in both time and frequency domains using sdr_spectrum.
- Full Frequency Spectrum: Use
-zoomoption to scan the entire frequency range supported by SDR hardware. - Channel Scan: Detect all active channels within a specified band or frequency range; results can be saved to a file for further analysis.
- Saving I/Q Data:
- From command line using
-save-and-exit; saves IQ samples as little-endian 32-bit floats in I/Q order. - From spectrum plot using 's' key; recommended to enable AGC first for optimal capture.
- From command line using
- Spectrum from a File:
- Analyze previously captured IQ data with
sdr_spectrum -iq <filename>. - Time vs power mode enabled with '-t 1'. Waterfall available in recent releases.
- Analyze previously captured IQ data with
- Signal Generation from a File:
- Use
sdr_playto transmit IQ files via SDR hardware, either once or in a loop. - Observe resulting hardware signal with
sdr_spectrum.
- Use
The tutorial provides a comprehensive, step-by-step approach to conducting spectrum analysis and signal verification using SDR hardware and Amarisoft tools, supporting a range of configurations, frequencies, and signal types. It emphasizes practical troubleshooting, multi-band/multi-bandwidth measurements, and advanced visualization for both development and validation purposes.
Why Spectrum Analyzer on Protocol Box ?
Based on my first and second hand experience in the field of testing in Protocol, RF and even in baseband, I experienced and saw many cases of verification/validation engineers struggling with troubleshooting their issues just because of the lack of cheap troubleshooting tools while they are using sub million dollar test equipment. For example, a lot of RF test fails because of protocol issues, not RF issues. In this case, relatively small investment for quick protocol test equipment (or selecting RF test equipment with better protocol analysis option) would save a lot of time and effort to troubleshoot and find root cause of the fails. On the contrary, many of protocol fails not because of protocol issues but because of RF (radio link) issues. Usually most of the protocol equipment is very expensive (usually starting from a few hundred K USD to over million dollars). When some test with such a super expensitive box fails and no clear root cause is found in terms of protocol itself, in many cause such a super expensive box goes idle and expensive verification engineers tend to get lost in wrong direction. In many cases when I see this kind of situation, I was wondering why it is so difficult for them to make such a small investment like just a few 10K USD for some basic spectrum analyzer to troubleshoot sub million dollar test equipmemt.
I think most of the readers would know why.. but it is what it is. The best case would be to have a protocol box and spectrum analyzer in a bundle. That's what Amarisoft Callbox (UEsim as well) does.
Amarisoft box does not provide the spectrum analyzer as a separate hardware only for spectrum analyzer. It provides a special program (sdr_spectrum) that can convert a SDR card installed in the box into a spectrum analyzer. For example, if you have a Amarisoft callbox with 4 SDR cards. When you are using only one of the SDR cards for a specific test, you can use any one (or all) of the remaining 3 SDR card as spectrum analyzer. You can use it as a quick troubleshooting or visualization tool as introduced in this tutorial or you can use them to capture I/Q signal for your algorithm test or verification software.
Test Setup
Test setup for this tutorial is as shown below. I would suggest you to connect antenna (or RF cables) to as many sdr cards as possible as per your needs. (NOTE : In this setup, sdr1 is measuring power from sdr0 via antenna. so the measured spectrum would not be as accurate and stable as RF cable. If you need more accurate / stable spectrum, connect the two sdr in conductive way (RF cable)). I just want you to build up some intuitions on the output power of a sdr depending on center frequency, channel bandwidth etc.
Setup A

Setup B
SDR 0 : TX1--------> SDR 1 : RX1 AND SDR 0 : TX2 --------> SDR 1 : RX2

Key Command Line
Followings are the list of the important command used in this tutorial. You may copy and paste these examples and modify the parameter values as you need
- sdr_spectrum.
- /sdr_spectrum -args "dev0=/dev/sdr1" -rx_freq 2680e6
- ./sdr_spectrum -args "dev0=/dev/sdr1" -rx_freq 2680e6 -rate 50.0e6 -dft_sample_ratio 1
- ./sdr_spectrum -args "dev0=/dev/sdr1" -rx_freq 2680e6 -save-and-exit -duration 3.0 -save_path "/tmp"
- ./sdr_spectrum -iq filename
- sdr_test
- ./sdr_test -c 0 rfic_tx_test 30.72e6 500e6 30 ofdm 5e6
- sdr_play
- ./sdr_play -args "dev0=/dev/sdr0" -rate 50.0e6 -tx_freq 2680e6 -tx_gain 90 iq_file_name
Running on Callbox
If you want to run this directly on Callbox, you need to switch to graphics mode to launch spectrum window.
Switch to the graphics mode using the command startx. This command is commonly used on Linux systems to manually start the X Window System, which launches the GUI. This step is typically required on systems that boot into multi-user text mode or on minimal installations where the GUI is not automatically started during boot. Running startx manually provides a way to start the graphical environment only when needed.

Open up two (or more) Terminals. One for running lte service and another for running spectrum analyzer

Running on ssh
If you want to run the spectrum from a remote PC via ssh. you can run the spectrum without running startx on the callbox. However, to run the spectrum (display the spectrum) on the remote PC, the remote PC should be running on X11. The only restriction you have to do is to connect ssh with -X option as in following example.
# ssh -X root@10.0.0.185
A couple of example setup that works or does not work with ssh -X are as follows.
Example 1 > Remote PC running on Fedora GUI (or any other X11 based Linux) mode ==> OK
Example 2 > Remote PC running on Windows ==> NOT OK. This would give you the message 'Could not display' when you run './sdr_spectrum'
Example 3 > Remote PC running on Windows with Virtual box running X11 based GUI (e.g, Ubuntu) ==> OK
Test 1 : LTE on sdr 0 and Spectrum on sdr 1
Configuration
You may use any configuration. In this tutorial, I used the configuration for basic LTE attach as shown here . In this test, I am measuring the spectrum for an LTE cell without any UE connected. It means the cell is just transmitting PSS/SSS/PBCH and SIB messages and there is no user traffic going on in this test.
Run Lte Service
In this tutorial, I will run a eNB/gNB on sdr0 and run the spectrum analyzer on another sdr (sdr 1 or 2 or 3) and measure spectrum of the signal transmitted by the tx port of sdr 0


Running Spectrum Analyzer with basic parameters
Go to /root/trx_sdr directory

Run sdr_spectrum program as follows. Notice that sdr1 is used and the center frequency is set to the tx frequency of sdr card to measure
./sdr_spectrum -args "dev0=/dev/sdr/sdr1" -rx_freq 2680e6
The command runs the executable sdr_spectrum and passes configuration parameters through the -args option. In this case, the SDR device /dev/sdr/sdr1 is selected as the receiver device, which indicates that the system may have multiple SDR devices and this specific one is chosen for measurement. The parameter -rx_freq 2680e6 sets the center frequency of the receiver to 2680 MHz. This means the spectrum analyzer will observe the radio signals around this frequency and display the surrounding bandwidth in the spectrum window. The value is written in scientific notation, where 2680e6 represents 2.68 GHz.

This application displays the real-time radio spectrum captured by an SDR device. The large graph on the right represents the power spectrum of the received RF signal, where the horizontal axis shows frequency offset around the tuned center frequency and the vertical axis shows signal power in dBm. The blue trace represents the measured RF energy across the observed bandwidth. Peaks in this trace indicate the presence of active radio signals within that frequency range.
On the left side of the window, the program displays keyboard commands and current configuration parameters. The key commands allow the user to interactively adjust certain runtime settings such as receiver gain, frequency tuning, AGC control, pause, or saving samples to disk. These commands provide quick control of the spectrum view while the SDR is running.
Below the command list, the SDR configuration parameters are shown. These include the center frequency, sample rate, channel configuration, receiver gain, bandwidth, synchronization source, and clock source. These parameters define how the SDR hardware is operating. Unlike the keyboard controls, most of these parameters cannot be changed while the program is running and must be specified when launching the spectrum application.
The lower status area shows real-time signal statistics for the received samples. It displays metrics such as RMS signal level and maximum IQ amplitude in dBFS. These values help verify that the receiver gain is properly adjusted so that the signal is strong enough but does not saturate the ADC. In practice, the gain is tuned so that the IQ peak remains below 0 dBFS to avoid clipping.
Overall, this screen confirms that the SDR device is actively receiving RF samples, performing an FFT to compute the spectrum, and displaying the signal energy distribution across the monitored bandwidth in real time.

Change rx gain by Up/Down keys from previous screen to get this waveform

Press 'o' key (show sample power) on previous screen to switch to 'power vs time' mode as below

Press '+/-' key (change time scale) on previous screen to change time scale

If you are using the Callbox or UEsim later than the release 2022-02-23, you can get the waterfall plot as shown below. You can get the waterfall plot by pressing 'w' key. +/- keys for color change by shifting the power offset and 'Ctrl and +/-' keys for color contrast change. Use Left/Right arrow key to shift the plot on horizontal axis. Press 'n' key to capture only one radio plot and pause (i.e, capture the snapshot of one radio frame).

Running Spectrum Analyzer with more parameters
Run sdr_spectrum program with more parameters as follows. Notice that sdr1 is used and the center frequency is set to the tx frequency of sdr card to measure
This example shows how to launch the sdr_spectrum program with additional runtime parameters. As in the earlier example, the command selects sdr1 through dev0=/dev/sdr/sdr1, so this specific SDR device is used as the receiver. The center frequency is again set to 2680e6, which means the receiver is tuned to 2680 MHz, matching the transmit frequency that the user wants to observe. In this version, extra parameters are added to control how the spectrum is captured and displayed. The option -rate 50.0e6 sets the sampling rate to 50 MHz, so the SDR acquires a wider block of spectrum around the center frequency. This determines how much bandwidth can be analyzed at one time. The option -dft_sample_ratio 1 controls the FFT processing behavior used for spectrum calculation. It affects how many of the incoming samples are used for the DFT or FFT operation, which in turn influences update speed and spectral detail. Overall, this command is a more complete launch example for the spectrum analyzer. It not only selects the SDR device and tunes to the target RF frequency, but also defines the sampling bandwidth and FFT-related processing parameters so the measured spectrum can be displayed with the desired resolution and behavior.


Change rx gain by Up/Down keys from previous screen to get this waveform

Press 'o' key (show sample power) on previous screen to switch to 'power vs time' mode as below

Press '+/-' key (change time scale) on previous screen to change time scale

If you are using the Callbox or UEsim later than the release 2022-02-23, you can get the waterfall plot as shown below. You can get the waterfall plot by pressing 'w' key. +/- keys for color change by shifting the power offset and 'Ctrl and +/-' keys for color contrast change. Use Left/Right arrow key to shift the plot on horizontal axis. Press 'n' key to capture only one radio plot and pause (i.e, capture the snapshot of one radio frame).

Test 2 : LTE on sdr 0 with different frequencies and Spectrum on sdr 1
In this test, I will show you how to run the lte software and spectrum on the same PC assuming that you have multiple SDR cards on the PC and there is at least one SDR card that is not used by lte software. The idea is to use one SDR card for running the LTE software and another SDR card to observe the transmitted signal through a spectrum analyzer.
In this setup, the LTE stack operates on SDR0, which generates and transmits the LTE signal at a specific RF frequency. At the same time, another SDR device, SDR1, is used by the sdr_spectrum tool to receive and analyze the RF signal being transmitted. Because the monitoring SDR is independent from the LTE SDR, the system can capture and display the spectrum of the transmitted signal without interfering with the LTE software operation.
As mentioned, this test assumes that the PC contains multiple SDR cards, and at least one SDR device is not occupied by the LTE application. That unused SDR is then dedicated to spectrum measurement. By running both components on the same machine, the user can easily verify the transmitted LTE signal characteristics, such as bandwidth, power distribution, and spectral shape, in real time.
Configuration
You may use any configuration. In this tutorial, I used the configuration for basic LTE attach as shown here and just change frequency. In this test, I am measuring the spectrum for an LTE cell without any UE connected. It means the cell is just transmitting PSS/SSS/PBCH and SIB messages and there is no user traffic going on in this test.
In this test, any LTE configuration can be used as long as the LTE cell is running normally. In this tutorial, the configuration used is the same as the basic LTE attach configuration, and only the operating frequency is modified. This means the overall LTE setup, including the cell parameters and signaling configuration, remains unchanged except for the RF frequency at which the cell is transmitted.
For this measurement, the LTE cell is operating without any UE connected to it. In this condition, the base station still continuously broadcasts the essential LTE downlink signals that allow UEs to detect and access the cell. These signals include PSS (Primary Synchronization Signal) and SSS (Secondary Synchronization Signal), which enable cell search and synchronization, as well as PBCH, which carries the Master Information Block. The base station also periodically transmits System Information messages (such as SIBs) that provide configuration information for potential UEs.
Since no UE is attached in this test, there is no user data traffic or scheduled downlink/uplink transmissions. As a result, the transmitted spectrum mainly consists of these broadcast and synchronization signals, allowing the spectrum analyzer to observe the baseline LTE transmission characteristics without additional traffic-related activity.
Assuming that you are running the lte software on sdr0 , you may use the sdr_spectrum command as below. You may change sdr card number and frequency depending on your test setup.
./sdr_spectrum -args "dev0=/dev/sdr/sdr1" -rx_freq 2680e6
LTE Band 1 at 2140.0 Mhz
NOTE : The two channels shown on the left side is from the live network. It is captured here since I am using antenna for the test.


LTE Band 2 at 1960.0 Mhz


LTE Band 3 at 1842.0 Mhz


LTE Band 4 at 2130.0 Mhz


LTE Band 5 at 881.5 Mhz


LTE Band 7 at 2680.0 Mhz


LTE Band 20 at 806.0 Mhz


LTE Band 71 at 634.4 Mhz


LTE Band 72 at 463.4 Mhz


Test 3 : LTE on sdr 0 (and 1) with different bandwidth and Spectrum on a remaining sdr
This is almost same test as the previous test. The difference is that I sweeped frequency in previous test but I will sweep bandwidth in this test.
As in previous test, te LTE software still runs on one or more SDR devices, and another unused SDR device is used to monitor the transmitted signal with sdr_spectrum. The main difference is what parameter is being varied during the experiment.
In the previous test, the LTE carrier frequency was changed while observing how the spectrum moved to different RF locations. In this test, the carrier frequency can remain fixed, but the LTE channel bandwidth is changed. As the bandwidth is swept, the spectrum analyzer shows how the occupied LTE signal width changes accordingly. f a narrower LTE bandwidth is configured, the spectrum trace appears narrower around the center frequency. If a wider LTE bandwidth is configured, the occupied spectrum becomes broader. This allows you to directly verify that the transmitted LTE signal width matches the configured bandwidth in the LTE setup. So the purpose of this test is to confirm that, when the LTE configuration changes from one bandwidth to another, the RF spectrum observed on the remaining SDR changes in width in the expected way.
Assuming that you are running the lte software on sdr0 , you may use the sdr_spectrum command as below. You may change sdr card number and frequency depending on your test setup.
./sdr_spectrum -args "dev0=/dev/sdr/sdr1" -rx_freq 2680e6
Configuration
You may use any configuration. In this tutorial, I used the configuration for basic LTE attach as shown here and just change channel bandwidth except the last case (the last case in this test is based on gnb-2cell-ho.cfg). In this test, I am measuring the spectrum for an LTE cell without any UE connected. It means the cell is just transmitting PSS/SSS/PBCH and SIB messages and there is no user traffic going on in this test.
LTE with BW 1.4 Mhz in Band 7


LTE with BW 3 Mhz in Band 7


LTE with BW 5 Mhz in Band 7


LTE with BW 10 Mhz in Band 7


LTE with BW 15 Mhz in Band 7


LTE with BW 20 Mhz in Band 7


LTE with 2 x BW 20 Mhz in Band 7
This configuration is based on gnb-sa-ho.cfg with frequency and bandwidth changes as follows.


Test 4 : sdr_test-generated OFDM signal on sdr 0 and sdr_spectrum on sdr 1
This is a kind of loopback test between multiple sdr cards on the same box. I will use one sdr card as a signal generator and another card as single analyzer.
The program sdr_test generates an OFDM signal and transmits it through SDR0. At the same time, the sdr_spectrum tool runs on SDR1 to receive the transmitted signal and display its spectrum in real time. This allows the user to directly observe the spectral characteristics of the generated OFDM waveform. Since both SDR devices are connected to the same machine, this configuration effectively creates a local RF test environment. The transmitting SDR produces a controlled OFDM signal, while the receiving SDR analyzes the signal power distribution and bandwidth using the spectrum display. This type of test is useful for verifying the SDR hardware operation, confirming the correctness of the OFDM signal generation, and visually checking the resulting spectrum without involving a full LTE or cellular stack.
Configuration
In this test, I am not using Callbox software. I am using a generic OFDM signal generated by the tool called 'sdr_test' transmitted by sdr 0 and run sdr_spectrum on sdr 1. To get more accurate spectrum, I used RF cable connection between sdr 0 and sdr 1 for this test as shown in Test Setup B.
The two commands that I used in this test are as follows :
./sdr_test -c <sdr_no> rfic_tx_test <sample rate> <frequency> <tx_gain> ofdm <bw> <== OFDM signal generation
./sdr_spectrum -args "dev0=/dev/sdr1", -rx_freq <frequency> <== spectrum plot
OFDM BW 5 Mhz at Center Frequency = 500 Mhz
![]()

OFDM BW 5 Mhz at Center Frequency = 1000 Mhz
![]()

OFDM BW 5 Mhz at Center Frequency = 1500 Mhz
![]()

OFDM BW 5 Mhz at Center Frequency = 2000 Mhz
![]()

OFDM BW 5 Mhz at Center Frequency = 2500 Mhz
![]()

OFDM BW 5 Mhz at Center Frequency = 3000 Mhz
![]()

OFDM BW 5 Mhz at Center Frequency = 3500 Mhz
![]()

OFDM BW 5 Mhz at Center Frequency = 4000 Mhz
![]()

OFDM BW 5 Mhz at Center Frequency = 4500 Mhz
![]()

OFDM BW 5 Mhz at Center Frequency = 5000 Mhz
![]()

OFDM BW 5 Mhz at Center Frequency = 5500 Mhz
![]()

OFDM BW 5 Mhz at Center Frequency = 5990 Mhz
![]()

Test 5 : sdr_test-generated CW signal on sdr 0 and sdr_spectrum on sdr 1
This test is similar to previous test. The only difference is that we will generate/transmit CW(Continuous Wave) signal instead of OFDM singal in this test .
In this setup, the sdr_test program runs on SDR0 and is configured to produce a CW tone, which is essentially a single-frequency sinusoidal signal. At the same time, the sdr_spectrum program runs on SDR1 to receive and analyze the transmitted signal. This configuration again forms a simple loopback-style RF test using multiple SDR devices on the same system. One SDR acts as the transmitter, generating the CW signal, while the other SDR acts as the spectrum analyzer to observe the signal characteristics. When viewed in the spectrum display, the CW signal appears as a single sharp peak at the transmit frequency because all the signal energy is concentrated at one frequency. This contrasts with the OFDM test, where the signal energy spreads across a wider bandwidth due to the multiple subcarriers used in OFDM modulation. This test helps verify the basic RF transmission path and confirms that the SDR hardware and spectrum measurement tool are functioning correctly.
Configuration
In this test, I am not using Callbox software. I am using a generic CW signal generated by the tool called 'sdr_test' transmitted by sdr 0 and run sdr_spectrum on sdr 1.
The two commands that I used in this test are as follows :
./sdr_test -c <sdr_no> rfic_tx_test <sample rate> <frequency> <tx_gain> tone <tone_offset> <== CW signal generation
./sdr_spectrum -args "dev0=/dev/sdr1" -rx_freq <frequency> <== spectrum plot
- If not specified, it is set to 7.68Mhz by default
- If you want to specify your own offset frequency, consider following limitation
- cannot be 0
- multiple of 100
- sample_rate must be multiple of offset freq
CW at User Defined tone_offset


CW at default tone_offset


Enabling AGC / Finding Optimal Spectrum
This section explains how to enable Automatic Gain Control (AGC) and how to adjust the receiver gain to obtain a clean and accurate spectrum measurement.
Immediately after running the sdr_spectrum program, the receiver gain (rx_gain) may not be optimally set. If the gain is too high, the ADC inside the SDR can begin to saturate. When this happens, the spectrum display may show artificially elevated adjacent power or distorted spectral shapes that do not reflect the true RF signal. This effect is typically caused by signal clipping or nonlinear behavior in the receiver chain.
To avoid this problem, the receiver gain must be adjusted so that the signal level stays within the proper dynamic range of the SDR hardware. One convenient way to achieve this is to enable AGC, which automatically adjusts the receiver gain based on the incoming signal level. Once AGC is enabled, the system continuously adapts the gain to keep the signal amplitude within an appropriate range, preventing clipping while still maintaining sufficient signal strength.
By properly adjusting or automatically controlling the receiver gain, the spectrum analyzer can display a more accurate representation of the RF signal, with reduced distortion and more realistic power levels across the observed bandwidth.

After the application of AGC, sdr_spectrum automatically adjust rx_gain and optimum spectrum ( NOTE : press 'a' key to enable / disable AGC).

Power with Frequency Range
This feature allows you to measure signal power within a specific frequency range directly from the sdr_spectrum display. The capability is available starting from software release 2022-04-01 or later.
When the spectrum window is running, you can select a frequency region of interest using the mouse. First, right-click and hold the mouse button on the spectrum plot. Then drag the cursor across the frequency region you want to analyze. As you drag, the selected portion of the spectrum is highlighted, indicating the frequency span that will be used for the measurement.
Once the range is selected, the program calculates and displays several useful power metrics in the status panel. It shows the total power contained within the selected frequency range, which represents the integrated signal power across that portion of the spectrum. It also displays the power per RBW (resolution bandwidth), which gives a normalized power measurement based on the spectral resolution used by the FFT processing.
This feature is useful when analyzing signals such as LTE or OFDM transmissions because it allows you to measure how much power is present within the occupied bandwidth of the signal. By selecting the region corresponding to the signal bandwidth, you can quickly estimate the total transmitted power and spectral distribution without exporting samples or performing additional offline processing.

Time Domain Waterfall Plot
The Time Domain Waterfall Plot provides a visualization of how signal power changes over time. This view can be enabled in the sdr_spectrum application by pressing the t key while the program is running. Like several other advanced visualization features, it requires software release 2022-04-01 or later.
In this mode, the display shows a time-based heatmap instead of the usual frequency spectrum. The horizontal axis represents time, while the vertical axis corresponds to radio frames or time segments of the captured signal. Each colored cell represents the signal power measured at that moment. The color scale on the right side of the display indicates the signal strength in dBm, where warmer colors such as red and orange represent stronger signal power and cooler colors such as green and blue represent weaker power levels.
This type of plot is useful for observing temporal patterns in the RF signal. For example, periodic bursts, frame structures, or repeating transmission intervals become visible as repeating color patterns. In the example shown, the visualization highlights the structure of one radio frame, making it easier to identify repeating activity across frames and analyze how the signal evolves over time.
Overall, the time-domain waterfall plot helps reveal time-dependent behavior of radio signals that cannot be easily seen in a single static spectrum snapshot.

Trigger Mode
sdir_spectrum support level trigger. The Trigger Mode feature in sdr_spectrum allows the spectrum display to start capturing or highlighting signal activity only when a specified signal condition is detected. Instead of continuously displaying all incoming samples, the trigger mechanism monitors the signal level and activates the visualization when the signal exceeds a certain threshold.
This feature is useful for detecting short or intermittent radio events that might be difficult to observe in a continuous spectrum display. One practical example is the detection of PRACH (Physical Random Access Channel) transmissions in LTE. PRACH signals are transmitted by the UE only during specific random access attempts and occur as short bursts. By using the trigger mode, the spectrum analyzer can detect these bursts and display them when they appear.
In this example, the trigger is configured so that when the PRACH signal energy crosses the defined trigger level, the display captures and shows the event. This allows the user to visually identify PRACH transmissions and analyze their timing and signal characteristics without needing continuous manual observation.
In an FDD system, uplink and downlink use different frequencies. Because of this separation, the spectrum input can be tuned only to the uplink frequency, so PRACH detection is relatively straightforward. The receiver mainly sees uplink activity, and when a UE transmits PRACH, the trigger can respond to that burst with much less risk of being confused by downlink transmissions.
In a TDD system, the situation is more difficult because uplink and downlink share the same frequency and are separated only in time. If the spectrum input is connected in a simple way, it may receive both the uplink signal and the downlink signal together. In that case, the trigger may be activated not only by PRACH from the UE, but also by normal downlink transmissions from the base station such as MIB, SIB, or other always-present downlink signals. This makes it harder to isolate PRACH events reliably.
For this reason, in the TDD case it is better to use an RF circulator or another UL/DL separation method so that only the uplink signal path is connected to the spectrum analyzer input. By feeding only uplink energy into sdr_spectrum, the trigger becomes much more selective for PRACH and is less likely to turn on due to downlink activity. This improves the accuracy of PRACH detection and makes the trigger-based method much more practical in TDD deployments.
![]()


Mixed Mode
Mixed Mode is a special display feature introduced in the 2023-09-08 software release of sdr_spectrum. This mode allows the user to view both the frequency spectrum and the waterfall plot simultaneously on the same screen.
Normally, the application displays only one type of visualization at a time, such as the frequency spectrum or the waterfall view. In Mixed Mode, these two views are combined so that the frequency-domain waveform appears in the upper portion of the display, while the waterfall visualization appears below it. The spectrum view shows the current signal power distribution across frequency, while the waterfall view provides a time history of how the signal changes.
This combined visualization helps users observe both instantaneous spectral characteristics and time-varying signal behavior at the same time. For example, the spectrum portion shows the shape and bandwidth of the signal, while the waterfall portion reveals periodic bursts, timing patterns, or intermittent transmissions.
Users can toggle between the normal spectrum display and Mixed Mode by pressing the x key. This makes it easy to switch between a single detailed spectrum view and the combined time-frequency visualization depending on the type of analysis needed.

Following is a full screen showing the mixed mode display. By default, the 'frequency waveform (the upper plot)' corresponds to the frequency scan line at the top of the waterfall plot.

You can scan (scroll) up and down along the waterfall plot in 'line mode'. You can get in and out of the line mode as shown below. Once you get in the line mode, you can scroll up and down using the up/down arrow key.

Following is an example of showing a waveform corresponding to a specific time indicated by 'red line' in waterfall.

Here you see how it looks in Animation. This example is from one radio frame of LTE radio frame with 5Mhz channel bandwidth. This was captured when eNB is running but no UE is connected. So you see CRS (Cell Reference Signal), PBCH/PSS/SSS and PDSCH for SIBs as it walk down along the radio frame. Since there is no UE connected and no user traffic PDSCH, you would see some empty symbols.

Analyzing LTE CRS
This section introduces a practical example of using sdr_spectrum to analyze LTE Cell Reference Signals (CRS). The goal is to observe how the LTE reference signals appear in the spectrum and to visualize their structure in a real RF transmission.
In LTE, the CRS (Cell Reference Signal) is used by the UE for important receiver functions such as channel estimation, equalization, and signal quality measurements. These reference signals are transmitted continuously by the base station and are distributed across specific resource elements within the LTE resource grid.
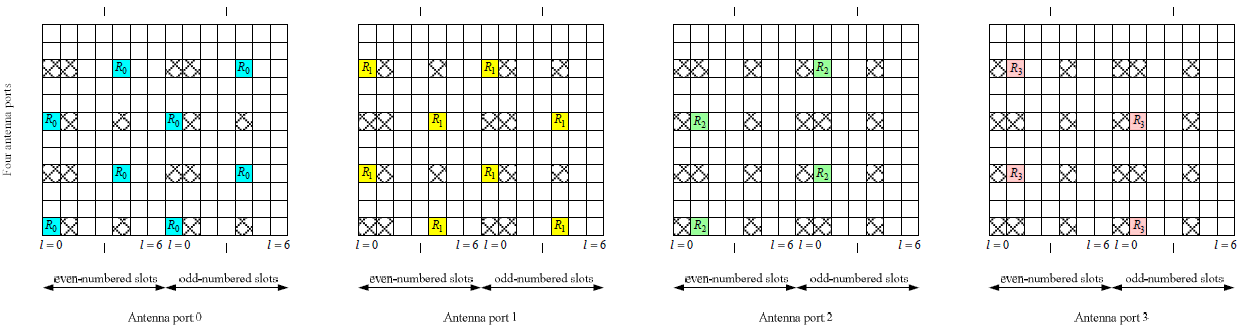
In this example, the LTE system is configured for 4�4 MIMO, meaning the base station uses four transmit antenna ports. According to the 3GPP specification, each antenna port has a predefined CRS pattern, including specific time and frequency positions within the OFDM resource grid. These patterns are carefully arranged so that the reference signals from different antenna ports do not collide with each other.
By capturing the LTE downlink signal using sdr_spectrum, it becomes possible to visualize the presence and periodic structure of the CRS signals. The spectrum analysis helps illustrate how these reference signals appear within the LTE transmission and how their placement follows the rules defined in the 3GPP standards. This provides a practical way to connect the theoretical CRS resource mapping with the actual RF signal observed in the spectrum analyzer.
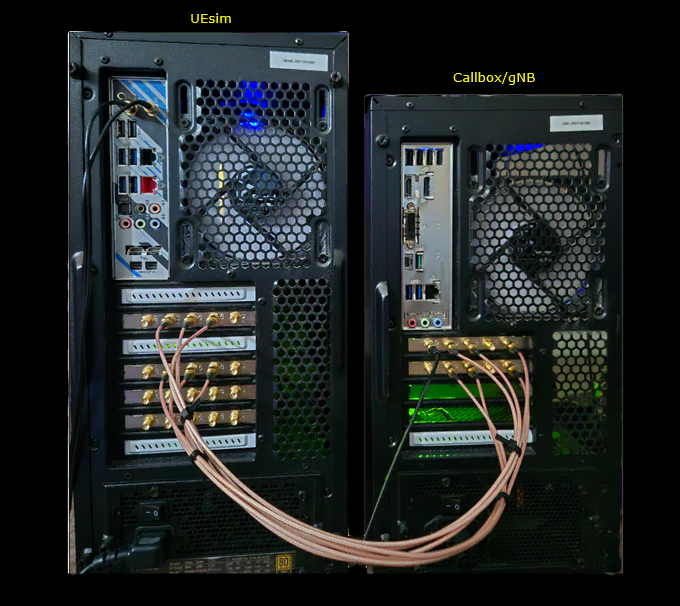
The test setup that I used for this analysis is as shown below. Here, Callbox is transmitting LTE 4x4 signal without any data meaning that it is just transmitting PSS/SSS, PBCH, PFICH, PDSCH for SIB and CRS (Cell Reference Signal). I ran enb with enb.default.cfg modified for 4 DL antenna (4x4 MIMO). I used UEsim just just as a spectrum analyzer (i.e, just to run sdr_spectrum).
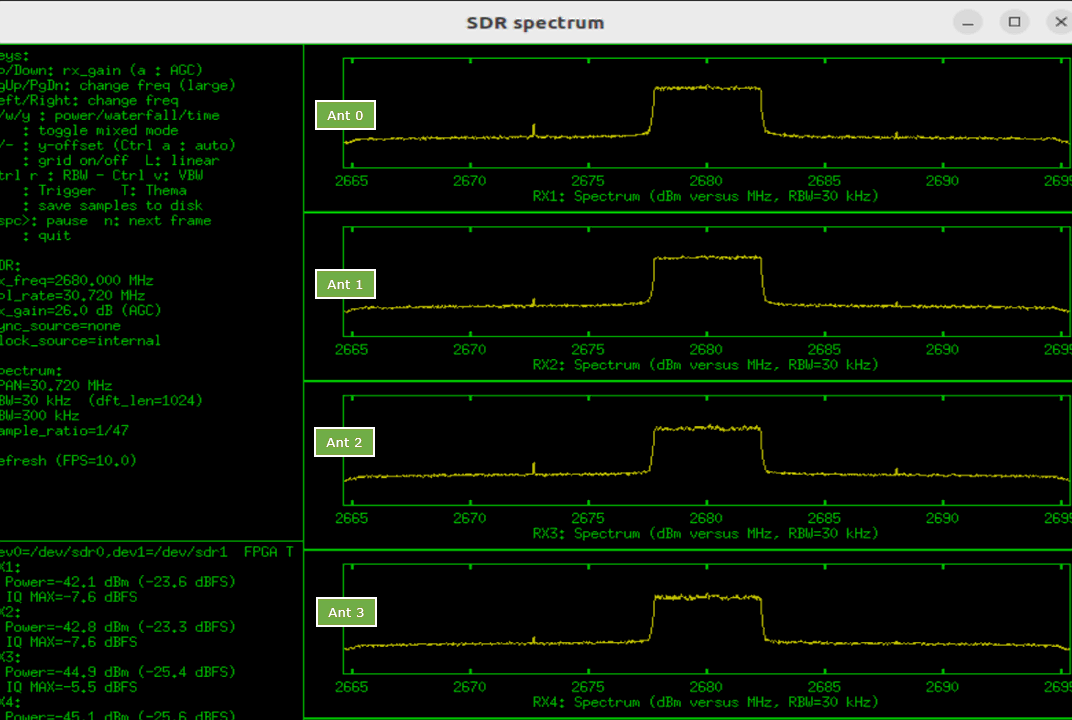
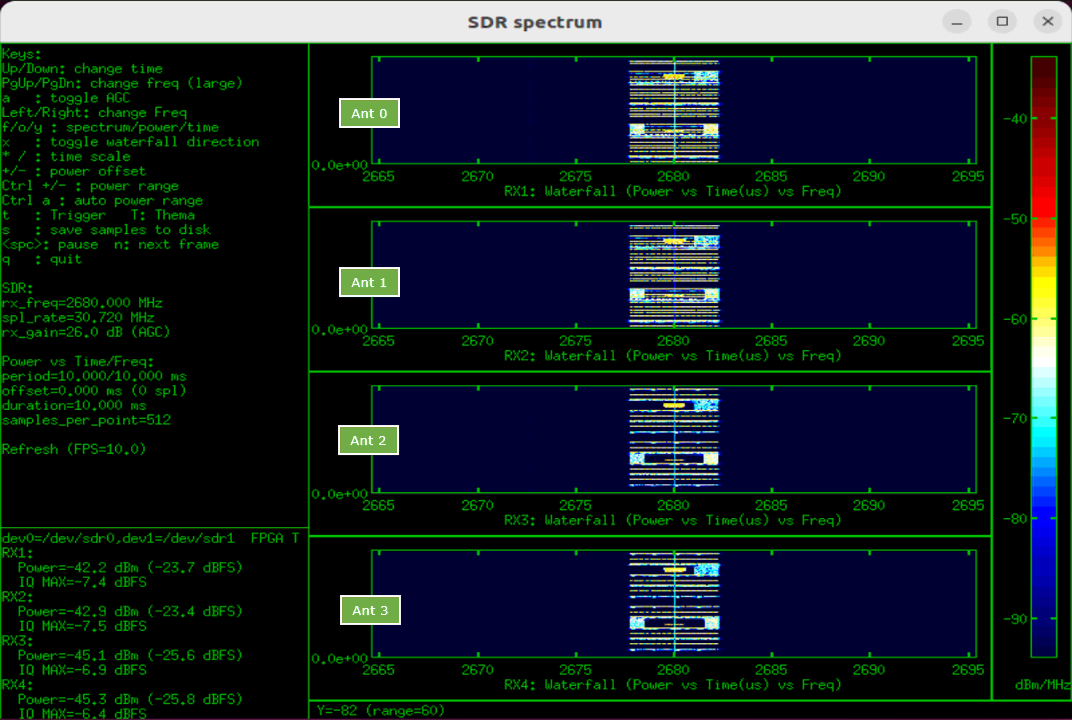
Now let's start the analysis. I will display the spectrum from all 4 RX antenna by running following command :
./sdr_spectrum -args "dev0=/dev/sdr0.dev1=/dev/sdr1" -channel 4 -rx_freq 2680e6 -rx_gain auto
The default display shows frequency spectrum for each RX channel (i.e, signal from each eNB antenna port).
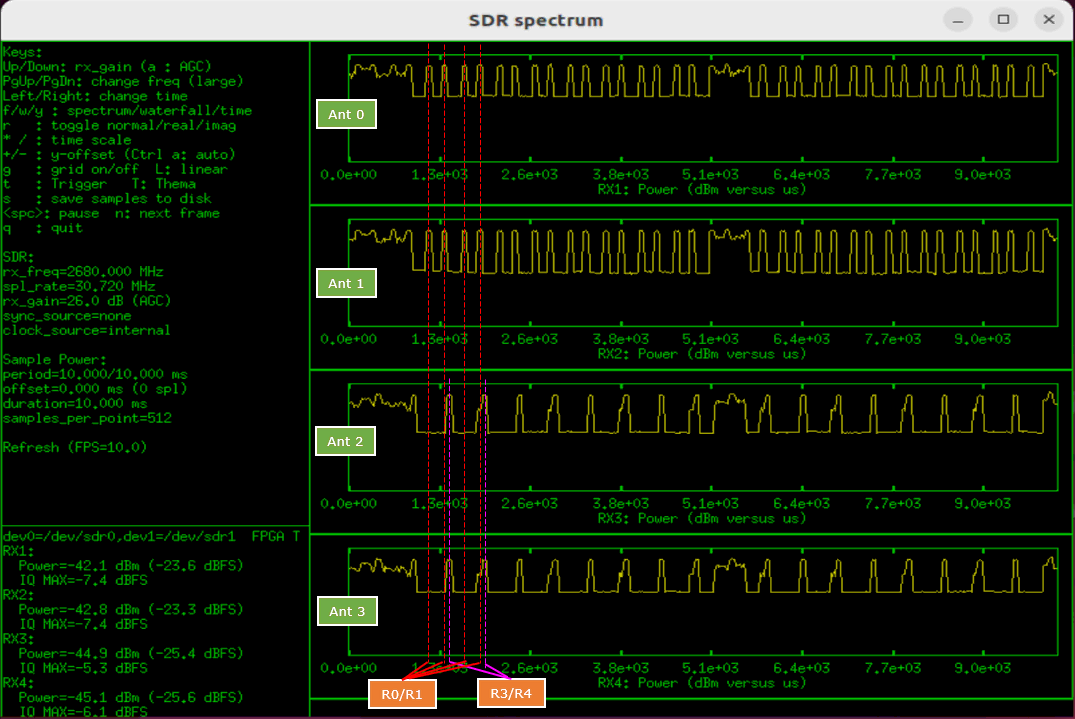
If you press 'w', you can get the time domain spectrum (power vs time, often called Zero-span plot in spectrum analyzer world). As illustrated below, you may easily figure out the pulse for R0, R1, R2, R3 by comparing the time domain location and Resource Grid shown in 3GPP document. (
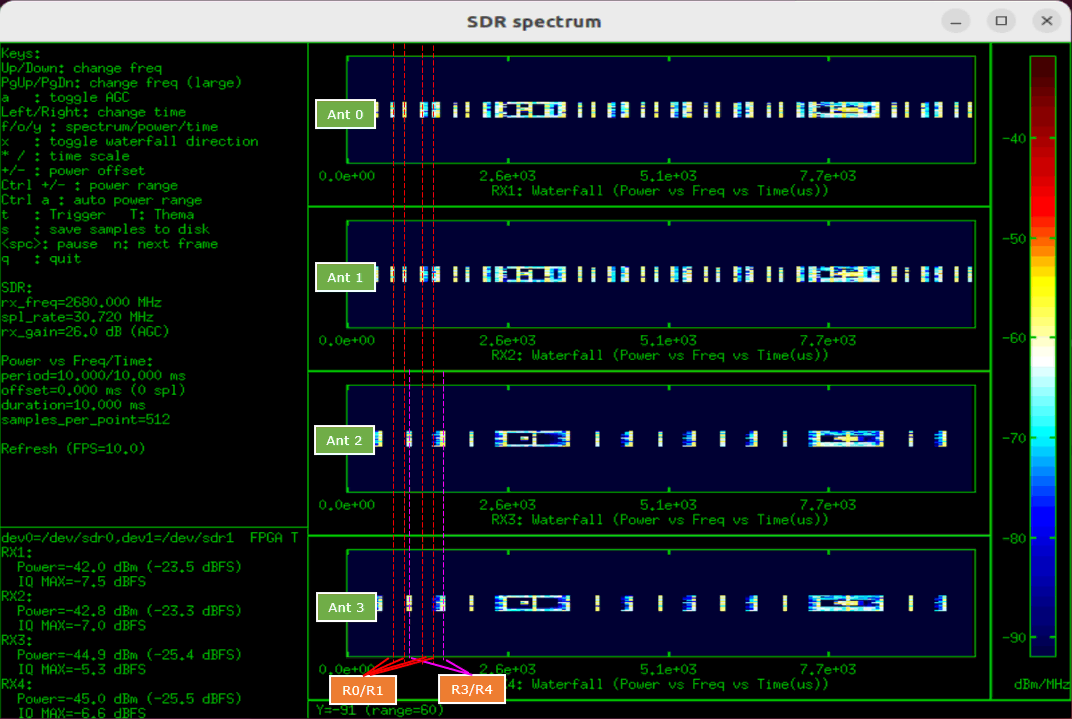
To get some visualization in both time domain and frequency domain, you can switch to waterfall mode (spectrogram mode) by pressing 'w' key. Then you can get the plot as shown below. In this plot, x axis indicates frequency and y axis indicates time.
To get higher resolution for time domain, press 'x' key to change the direction of the spectrogram. In this plot, x axis represent time and y axis represent frequency. Here you may easily identify R0, R1, R2, R3 in time domain. But you can get only high level outline of the frequency domain profile. (
Full Frequency Spectrum
This section shows how to display the full frequency range supported by the SDR hardware using the sdr_spectrum tool. Normally, sdr_spectrum observes only a limited bandwidth around a selected center frequency because the receiver processes a finite sampling bandwidth. However, by using the -zoom option, the tool can sweep across the entire tunable frequency range of the SDR device and construct a wide overview of the RF spectrum.
You can use the command like './sdr_spectrum -args "dev0=/dev/sdr/sdr2" -zoom' for this feature
![]()
In this example, the SDR device /dev/sdr/sdr2 is selected, and the program automatically scans across the supported frequency range. Instead of showing only a small bandwidth around a fixed center frequency, the display now represents a much wider span that may cover several gigahertz depending on the SDR hardware capability.
The resulting spectrum view provides a broad RF landscape, allowing the user to see signals present across a large frequency range. Peaks in the display represent active transmissions detected by the SDR during the sweep. This mode is useful for initial RF environment exploration, identifying strong signals, locating occupied bands, or determining where interesting activity exists before performing more detailed narrowband analysis.

Channel Scan
The Channel Scan feature allows sdr_spectrum to automatically scan a specified frequency band and detect active channels within that range. Instead of manually tuning to different frequencies, the program sweeps across the band and identifies regions where signal power is significantly higher than the surrounding noise level. These regions correspond to active transmissions.
![]()

After the scan is completed, sdr_spectrum prints out all the detected channels in text.

You can save the result of the scan into a file by running with a redirection to file as shown below.
![]()
When the Channel scan is done, the result is saved in the specified file as shown below.

You can specify the range of the scan in frequency rather than band using the options -scan_start and -scan_end as shown below.
![]()

Saving I/Q Data into a file
You can save the IQ data into a binary file and you can analyze it with your own program (e.g, Matlab etc). This feature allows sdr_spectrum to capture the received I/Q samples and store them in a binary file instead of using them only for real-time display. By saving the raw baseband data, you can later process the signal offline using your own analysis tools or custom programs.
The stored file contains the complex I/Q samples received by the SDR. These samples preserve the original waveform information, so they can be used for many types of post-processing such as FFT analysis, demodulation, synchronization studies, signal visualization, or custom decoding. Tools such as MATLAB, Python or other DSP software can read this binary data and perform detailed offline analysis that may be more flexible than the built-in spectrum display.
This is useful when you want to inspect the signal more carefully, repeat the same analysis multiple times, compare different algorithms, or archive captured RF data for later investigation. In other words, sdr_spectrum can work not only as a live spectrum viewer, but also as a signal capture tool for deeper offline RF analysis.
Saving I/Q with command
This example shows how to capture and save I/Q samples directly from the command line using the sdr_spectrum tool. Instead of launching the graphical spectrum display, the program runs for a specified duration, records the received samples, and then exits automatically.
You can use the command like ./sdr_spectrum -args "dev0=/dev/sdr1" -rx_freq 2680e6 -save-and-exit -duration 3.0 -save_path "/tmp"

The command will popup the spectrum window first and collect / save the IQ data into the specified folder (/tmp in this case).

NOTE : The I/Q samples are saved as little endian 32 bit float values, in I/Q order. The sample values are between -1 and 1
Saving I/Q in Spectrum Plot
This method explains how to capture and save I/Q samples directly from the running sdr_spectrum graphical display using the keyboard.
When the spectrum plot is running, the program allows the user to store the received I/Q data by pressing the s key. The key command is listed in the Keys menu on the left side of the spectrum window. Each time the s key is pressed, the program records a short segment of the received baseband signal and saves it as a binary I/Q file.
A recommended procedure for capturing good-quality I/Q data is as follows.
i) Check if you see any form of spectrum with a certain bandwidth (If you don't see any spectrum with bandwidth and everything looks like noise floor, it would be likely that there is no signal or the signal is weaker than noise floor)
ii) If you see any signal with a certain bandwidth, press 'a' key to allow sdr_spectrum software perform AGC and find the best rx_gain and best spectrum. It will take several seconds to complete AGC.
iii) then press 's' key to save the signal into file. Every time you press 's' key, the signal with the duration of 1 sec will be saved in /tmp directory.

Spectrum from a file
This section shows how to generate a spectrum plot from a previously captured I/Q file instead of receiving live samples from an SDR device. This feature is useful for offline analysis, allowing users to examine recorded signals repeatedly without requiring the SDR hardware to be connected or active. It also enables detailed investigation of previously captured RF events and supports signal processing experiments using recorded datasets.
First, assume that a binary I/Q file has already been recorded and stored in the system. The example shows a file located in the /tmp directory, which was previously captured using the sdr_spectrum save feature. The file contains raw complex baseband samples representing the received RF signal.

You can get the spectrum by using the command like ./sdr_spectrum -iq /tmp/rec-20220212-002945897-30720-268000kHz-1.bin (
![]()
In the spectrum from file, you would notice there is only a few menu available. Most of other menus especially related to hardware (e.g, rx_gain, AGC etc) are not available

If you want to plot the file in 'time vs power' mode, you have to speficy it at the command line as shown below ('-t 1' indicates 'time vs power' mode).
This example shows how to analyze a previously recorded I/Q file in time-domain mode using sdr_spectrum. Instead of displaying the usual frequency spectrum, the program can visualize the signal as power versus time. This mode is particularly useful for examining temporal characteristics of the recorded signal, such as bursts, frame timing, periodic transmissions, or other time-dependent behavior. By switching from frequency analysis to time-domain analysis, users can gain additional insight into the structure and timing of the captured RF signal.
You can use the command like ./sdr_spectrum -t 1 -iq /tmp/rec-20220212-002945897-30720-268000kHz-1.bin
![]()

If you are using the Callbox or UEsim later than the release 2022-02-23, you can get the waterfall plot as shown below. You can get the waterfall plot by pressing 'w' key. +/- keys for color change by shifting the power offset and 'Ctrl and +/-' keys for color contrast change. Use Left/Right arrow key to shift the plot on horizontal axis. Press 'n' key to capture only one radio plot and pause (i.e, capture the snapshot of one radio frame).

Signal Generation from a file
This section shows how to generate a real RF signal from a previously captured I/Q file using the sdr_play program. Instead of only analyzing the file offline, the stored baseband samples can be transmitted through an SDR device so that the waveform becomes an actual RF signal.
This command plays the file only once and quit the program. you can use the command like ./sdr_play -args "dev0=/dev/sdr0" -rate 30.72e6 -tx_freq 2680e6 -tx_gain 90 /tmp/rec-20220212-002945897-30720-268000kHz-1.bin
![]()
If continuous transmission is required, the -loop option can be added so that the file repeats indefinitely: You can use the command like ./sdr_play -args "dev0=/dev/sdr0" -rate 30.72e6 -tx_freq 2680e6 -tx_gain 90 -loop /tmp/rec-20220212-002945897-30720-268000kHz-1.bin
![]()
And you can plot the spectrum using sdr_spectrum like ./sdr_spectrum -args "dev0=/dev/sdr1" -rx_freq 2680e6
![]()
