Channel Simulator - UEsim
This tutorial is about how to configure channel simulator for UEsim and verify it using Amarisoft Callbox. Applying channel simulation to UEsim mean Uplink channel simulation. The channel model you can apply for UEsim is listed as follows
- 3GPP defined Fading Profile for LTE and NR (
NOTE : Amarisoft support TDL model only, does not support CDL) - UE distance simulation (Near / Far Simulation)
- Loss Model simulation (Modeling A + B * log10(d) )
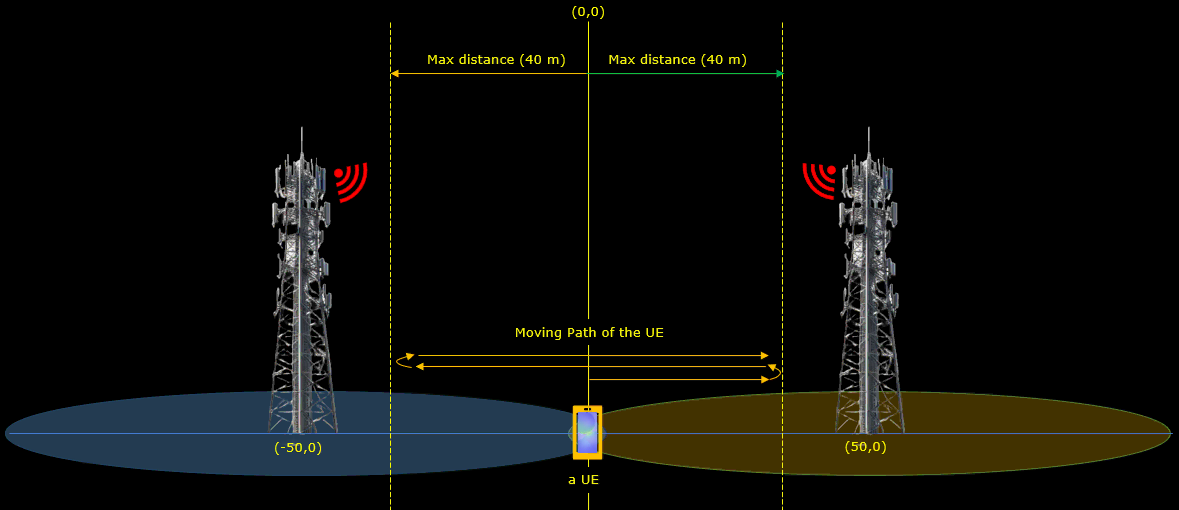
The most common channel simulation we do is Near / Far modeling as illustrated below. In this scenario, UEsim simulator a UE moving toward a certain direction at a constant speed and observe UL channel power (e.g, PUSCH, PUCCH power) and throughput from gNB.
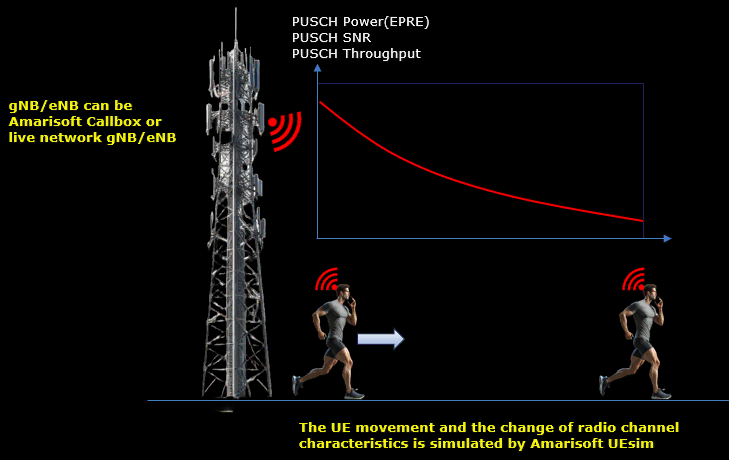
Table of Contents
- Channel Simulator - UEsim
Introduction
Channel simulation is a fundamental aspect in evaluating and validating the performance of User Equipment simulators (UEsim) within wireless communication test environments, such as those provided by Amarisoft Callbox. Accurate channel simulation allows engineers and researchers to mimic real-world radio propagation phenomena—such as fading, path loss, and distance-dependent signal attenuation—thereby enabling comprehensive testing of uplink (UL) channel conditions. In the context of LTE and 5G NR technologies, channel models such as the 3GPP-defined Fading Profiles (specifically, the Tapped Delay Line or TDL models) are used to replicate multipath fading effects according to standardized scenarios. Amarisoft Callbox supports the implementation of these TDL channel models, but not Cluster Delay Line (CDL) models. Additionally, channel simulation encompasses UE distance modeling (Near/Far simulation) and path loss modeling, where signal attenuation is mathematically represented as a function of distance (e.g., using the model: Loss = A + B * log10(d)). The most prevalent use case involves simulating a UE's movement along a trajectory at constant speed, observing the resulting variations in UL channel power (such as PUSCH and PUCCH) and throughput as measured by the gNB. This provides critical insights into system behavior under controlled, repeatable conditions, and directly supports development, troubleshooting, and optimization of wireless systems.
-
Context and Scope
- Channel simulation in UEsim is crucial for reproducing realistic radio environments and uplink propagation effects in laboratory settings.
- Amarisoft Callbox serves as a comprehensive test platform, supporting the configuration and verification of channel models for LTE and NR.
- Focus is placed on uplink channel simulation, specifically utilizing 3GPP-defined TDL fading profiles, UE distance simulation, and loss models.
-
Relevance and Importance
- Enables robust testing of UEs under a wide range of real-world channel conditions without the need for field trials.
- Supports rapid validation, regression testing, and performance optimization for both device and network-side algorithms.
- Provides a controlled, repeatable environment for observing uplink power and throughput metrics as a function of user mobility and distance.
-
Tutorial Outcomes
- Learn how to configure uplink channel simulation in UEsim using Amarisoft Callbox.
- Apply TDL-based fading profiles and distance-based loss models to emulate realistic propagation scenarios.
- Verify and analyze UL channel power and throughput variations as the simulated UE moves within the virtual test environment.
-
Prerequisite Knowledge and Skills
- Basic understanding of LTE and 5G NR radio access technologies, including uplink and downlink transmission principles.
- Familiarity with 3GPP channel models (especially TDL fading profiles) and path loss concepts.
- Operational knowledge of Amarisoft Callbox and UEsim configuration workflows.
- Ability to interpret radio performance metrics such as PUSCH/PUCCH power and throughput statistics.
Summary of the Tutorial
This tutorial outlines four distinct low-layer wireless channel simulation and mobility tests using Amarisoft’s test environment, focusing on both single and multiple UE scenarios. Each test involves specific configurations and procedures to assess channel characteristics, link adaptation, and handover mechanisms under various simulated radio conditions.
-
Test 1: Basic AWGN Channel
- Objective: Simulate a UE moving away from a cell at constant speed under an Additive White Gaussian Noise (AWGN) radio channel.
- Configuration Steps:
- Use modified configuration files (gnb-sa-channel-sim.cfg for gNB, ue-nr-sa-chan-sim.cfg for UE).
- Set NR_BANDWIDTH to 40 for gNB.
- Enable channel_sim and delay_sim in the cell group.
- Specify UE initial position, antenna type ("isotropic"), and reference signal power (from SIB1).
- Configure ul_power_attenuation and noise floor.
- Set channel type to awgn in UE configuration.
- Test Procedure:
- Verify cell configuration via 'cell phy' command.
- Start LTE service on both gNB and UEsim, ensuring UE attaches successfully.
- Move UE at 10 km/h away from cell using Remote API: ../ws.js ue '{"message" : "ue_move", "ue_id" : 1, "speed" : 10, "direction" : 0}'.
- Monitor physical layer measurements (UL SNR, MCS, bitrate, PHR, pathloss) in gNB logs as UE moves.
- Analyze downlink effects (SINR, RSRP) and perform log analysis on Callbox or UEsim logs.
-
Test 2: 3GPP Profile - EPA Channel
- Objective: Simulate UE movement under the 3GPP Extended Pedestrian A (EPA) fading channel model.
- Configuration Steps:
- Use gnb-sa-channel-sim.cfg (gNB) and ue-nr-sa-chan-sim-epa.cfg (UE).
- Set NR_BANDWIDTH to 40 for gNB.
- Enable channel simulation and set UE position and antenna characteristics.
- Configure UE channel type as epa with freq_doppler: 50 and mimo_correlation: "low".
- Test Procedure:
- Check cell configuration and start LTE service.
- Move UE at 10 km/h away from the cell using Remote API.
- Observe and record changes in physical layer measurements (UL SNR, MCS, bitrate, PHR, pathloss) and downlink parameters (SINR, RSRP).
-
Test 3: Triggering PingPong Handover by Channel Simulator - LTE/Single UE
- Objective: Simulate a single UE moving back and forth between two cells, triggering repeated “ping-pong” handovers using a 3GPP EVA channel model.
- Configuration Steps:
- Use enb-pingpong-ho.cfg (eNB) and ue-pingpong-ho.cfg (UE).
- Set N_CELL to 2 and enable TDD.
- Assign different frequencies to each cell for inter-frequency handover.
- Configure neighbor cell lists for both cells.
- Set up measurement-based handover conditions (event A3, measurement gaps) in cell_default block.
- Enable CHANNEL_SIM and set initial UE position at midpoint between cells.
- Configure UE to move at 5 km/h, “bounce” at max/min distances, and use eva channel model.
- Test Procedure:
- Start callbox and UEsim, power on UE.
- Allow UE to move automatically between the two cells, observing handover events.
- Monitor RSRP, SNR, CQI, Rank, Timing Advance, TPC command, and Power Headroom plots for discontinuities at handover points.
- Analyze protocol sequence in logs: measurement report triggering (A2, A3 events), measurement gap activation, handover command and reconfiguration, and confirmation of handover execution.
-
Test 4: Triggering PingPong Handover by Channel Simulator - LTE/64 UE
- Objective: Evaluate the gNB’s ability to handle mass handovers by repeating the Test 3 scenario with 64 UEs.
- Configuration Steps:
- Use gnb-sa-pingpong-ho-64ue.cfg (gNB), mme-ims-64.cfg (includes ue_db_64-UE.cfg for USIM info), and ue-nr-sa-pingpong-ho-64ue.cfg (UEs).
- Set cell bandwidth to 100 MHz (adjustable for hardware capability).
- Configure inter-frequency handover between two cells as in Test 3.
- Include USIM data for 64 UEs in UE configuration.
- Set UE movement and channel simulation parameters (direction, bounce, speed: 5 km/h, channel: epa).
- Test Procedure:
- Start the scenario using UEsim WebGUI, auto-generating USIM parameters.
- Monitor registration and handover events for all 64 UEs.
- Analyze high-level KPIs (throughput, error rates, SNR), and track the number of UEs per cell over time to evaluate handover performance.
- Review detailed log analysis for registration, measurement reporting, handover triggering, and completion for each UE.
Each test requires precise configuration of the channel simulator, UE movement parameters, and handover conditions. Measurements focus on both uplink and downlink physical parameters, as well as protocol-level behavior, to thoroughly evaluate system performance under controlled mobility and fading scenarios.
Test Setup
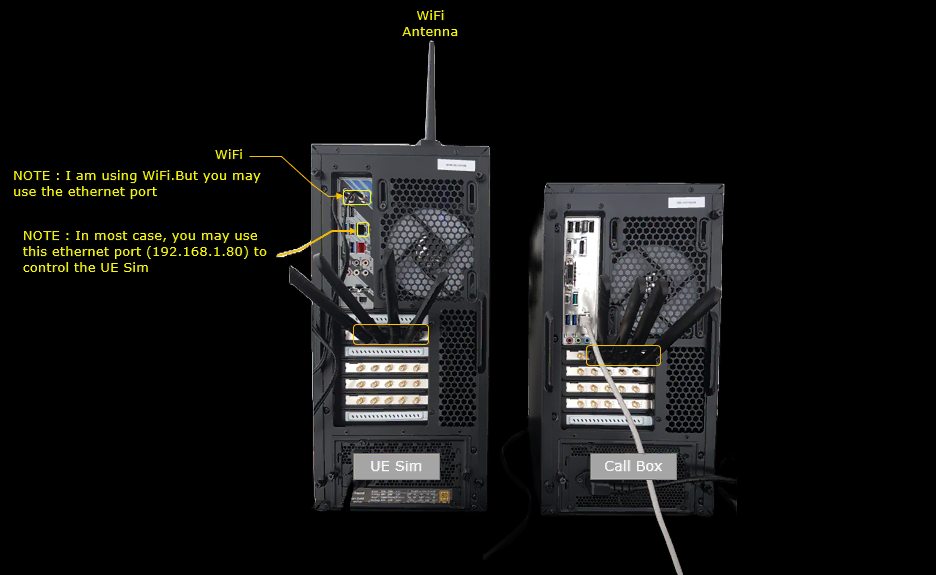
Test setup for this tutorial is as shown below. This is just for low layer testing, you may not need any complicated IP layer setup.
- SIM Card used in this tutorial is the one delivered with the system as it is.
- If you want to change the configuration, The tutorial Configuration Guide would help
Only one SDR card is used on each side. The UEsim box on the left and the Callbox on the right are connected through the RF ports of those cards. Nothing else is needed on the radio side for this tutorial.
I control the UEsim over WiFi here, using the WiFi card and the antenna on top of the box. You do not have to do the same. The ethernet port just below it, 192.168.1.80 on most systems, is the usual way to reach the UE Sim and works just as well.
Key Configuration Parameters
Followings are important configuration parameters for this tutorial. You may click on the items for the descriptions from Amarisoft documents.
- channel_sim
- delay_sim
- position
- initial_radius
- speed
- direction
- elevation
- noise_spd
- channel
- freq_doppler
- mimo_correlation
- antenna type
- multi_ue
- ul_power_attenuation
- ref_signal_power
- min_distance
- max_distance
- bounce
Test 1 : Basic AWGN channel
In this test, we simulate a situation where a UE is moving away from the cell at a constant speed under simple awgn radio channel
Configuration
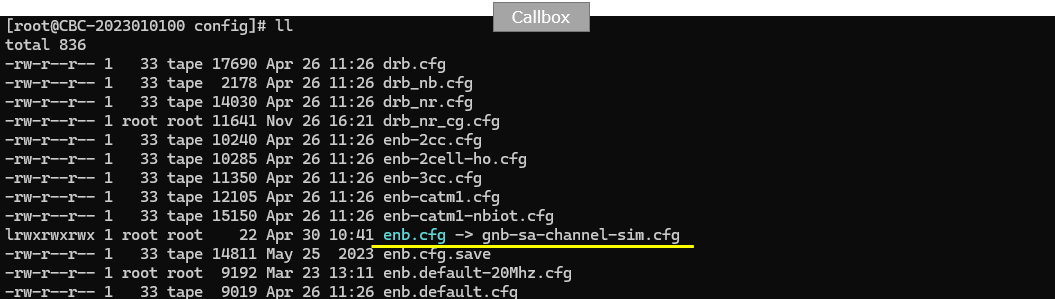
I have used gnb-sa-channel-sim.cfg that is copied and modified from gnb-sa.cfg. I will use the same file for all the test in this tutorial and just modify the parameters in the file without creating a new file.
I am using the default mme, ims config as shown below.

I used ue-nr-sa-chan-sim.cfg which is copied and modifed from ue-nr-sa.cfg on UEsim.
Following is the configuration on gNB. On gNB side, the configuration is almost identical to gnb-sa.cfg. The only difference is NR_BANDWIDTH which is changed to 40 (20 is the default value)
The rest of the block is the stock gnb-sa.cfg set. NR_TDD is 1 and FR2 is 0, so this is an FR1 TDD cell, and NR_TDD_CONFIG is 2. N_ANTENNA_DL is 2 and N_ANTENNA_UL is 1, so the downlink is 2x2 and the uplink is single antenna.
USE_SRS is 0, so no periodic SRS is sent. Uplink SU-MIMO would need N_ANTENNA_UL of 2 or more in any case, and this test does not use it. NR_LONG_PUCCH_FORMAT is left at 2.
If you change NR_BANDWIDTH here, change CELL_BANDWIDTH on the UEsim side to the same value. The two have to agree or the UE will not find the cell.

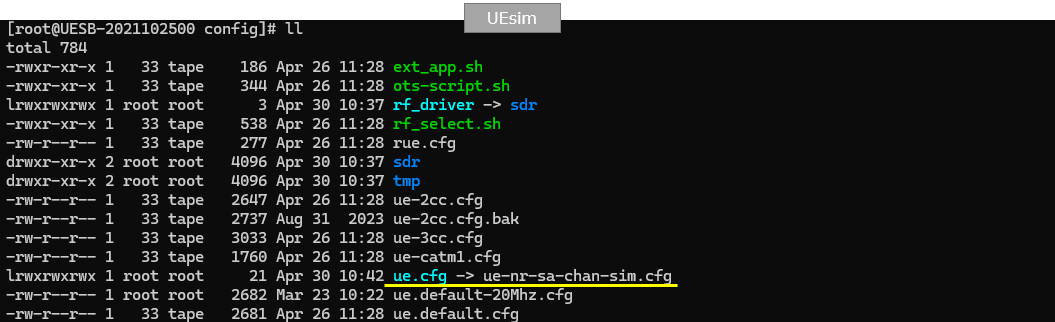
Following is the basic configuration in ue-nr-sa-chan-sim.cfg . The configuration here should match the configuration of Callbox(gNB). The only thing to be set independantly are tx_gain and rx_gain that should be adjusted depending on test setup.
Three defines are set here. N_ANTENNA_DL is 2, TDD is 1 and CELL_BANDWIDTH is 40.
Each one has a counterpart on the gNB side. N_ANTENNA_DL matches the gNB N_ANTENNA_DL, TDD matches NR_TDD and CELL_BANDWIDTH matches NR_BANDWIDTH. Keep them in step whenever you edit either file.

Enable channel_sim and delay_sim in cell_groups and specify the position, antenna radiation type (antenna: {type :"isotropic"}, cell reference power(ref_signal_power) broadcast in SIB1. (
multi_ue is set to true just above channel_sim. That is not optional. The channel simulator only runs in multi UE mode.
The cell entry below is the ordinary radio setup. band is 78 with dl_nr_arfcn 632628, ssb_nr_arfcn 631968 and subcarrier_spacing 30. That is the TDD branch and it is the one in use here. The band 7 branch under #else is the FDD alternative and is not used in this test.
The last four lines of the cell hold position [0, 0], antenna type isotropic, ref_signal_power -28 and ul_power_attenuation 23. The position is the cell position, so the cell sits at the origin of the simulated map. Every UE distance is measured from there.
ul_power_attenuation is the one value that depends on your own hardware. Lower it until the sat column of the t g monitor stops showing saturation while the UEs transmit. Too low and you waste DAC range, too high and the signal saturates.

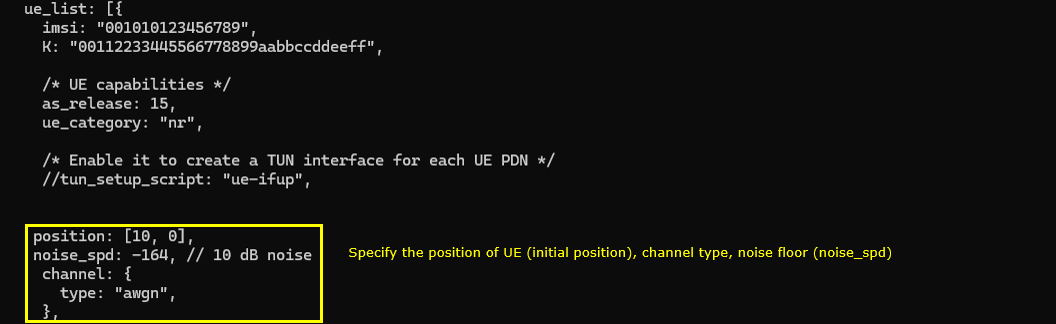
Then specify UE position (position), noise floor(noise_spd) and channel type( channel:{ type:"awgn"} in ue_list:[{ }]. The position specified here is the initial position, you can move this position while running with RemoteAPI.
The UE starts at position [10, 0]. The cell is at [0, 0], so the UE begins 10 m out and moves along the x axis from there.
noise_spd is -164 dBm/Hz. The default is -174, so this run adds 10 dB of noise on top of that. Raise it if you want the SNR to fall away sooner, or put it back near -174 for a cleaner link.
The channel type is awgn. It adds noise but no multipath and no fading. The distance based pathloss still applies, so this is the simplest case to read before moving on to a fading profile.
Above the channel settings is the ordinary UE identity. imsi is 001010123456789 with the matching K, as_release is 15 and ue_category is nr. tun_setup_script stays commented out because this test does not need a TUN interface per PDN.
This part is mainly for automation of the test process. But this is not mandatory, you can perform all of these operation manually. Just for this specific test, power_on, running LteSimServer and power_off is done automatically without human intervention.
power_on runs at start_time 0, so the UE attaches as soon as the simulation starts. power_off runs at 900 seconds, and that sets the length of the run.
Two traffic events start at 2 seconds and end at 890. cbr_recv asks for 200 Mbps and cbr_send asks for 40 Mbps, both UDP with a payload_len of 1472 towards 192.168.2.1. That address is where LteSimServer has to be listening, started as ltesim_server -a 192.168.2.1.
If you want a longer run, move both end_time values and the power_off start_time together. The cbr_send rate is the one that matters most here, since the uplink is the direction the channel simulator acts on.

Perform the Test
I will follow the same procedure as shown here for all the test in this tutorial.
Check if the cell is configured as intended by checking the output of 'cell phy'
The cell comes up as NR on band n78 with BW 40, which is the NR_BANDWIDTH you set. The DL and UL ARFCN are both 632628 because the cell is TDD, and the SSB sits at 631968.
On the DL side ANT is 2 and NL is 2. On the UL side both are 1. That matches N_ANTENNA_DL 2 and N_ANTENNA_UL 1. Subcarrier spacing is 30 kHz in both directions and the maximum modulation is 256QAM.

Start lte service on Callbox(gNB) and UEsim(UE) and make it sure that the UE is connected.
Once the initial attach is complete, go to /root/ue directory on UEsim and run the following remote API. This specific command is to move UE (ue_id 1) to move away from the cell at the speed of 10 km/h.
|
./ws.js ue '{"message" : "ue_move", "ue_id" : 1, "speed" : 10, "direction" : 0}' |
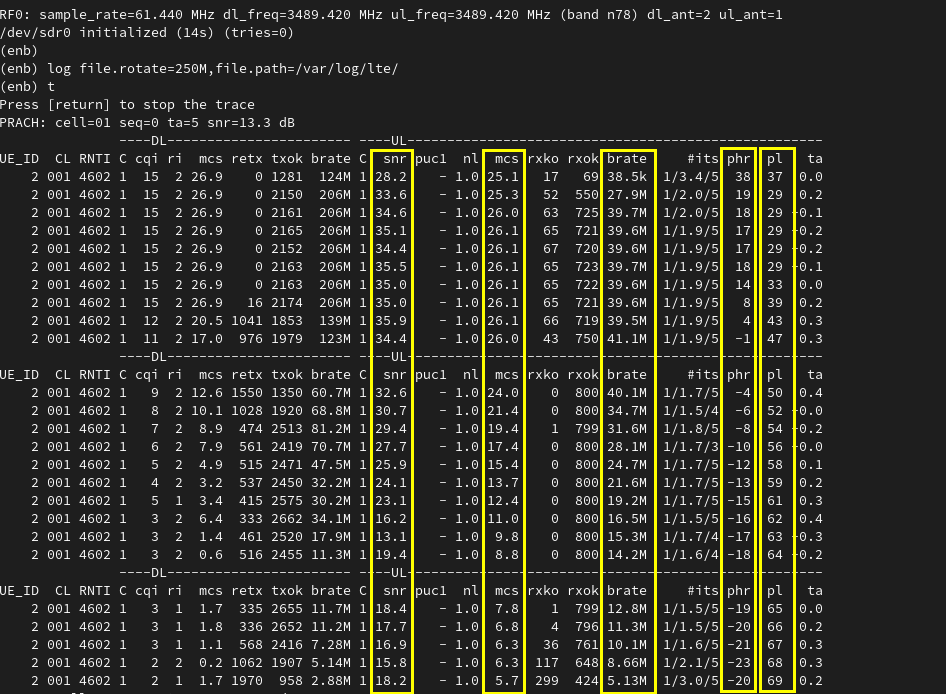
Then check how some of physical layer measurement changes in gNB trace log. Followings are some of the highlights you would notice :
- UL SNR is decreasing with time (as UE moves farther from gNB.
- UL MCS is decreasing with time (as UE moves farther from gNB (This is because gNB performs link adaptation).
- UL brate (Date Rate) is decreasing with time (as UE moves farther from gNB)
- UL phr (Power HeadRoom) is decreasing with time (as UE moves farther from gNB)
- Pathloss (pl) is increasing with time (as UE moves farther from gNB)
The three blocks are three moments of the same run, so read them top to bottom. UL snr starts in the high 20s to mid 30s. In the middle block it sits between the low 20s and single digits. By the end it is around 18 dB. UL mcs follows it down from about 26 to under 6.
UL brate falls from roughly 39 Mbps to about 5 Mbps. phr goes from about 17 dB to -20 dB. Once phr is negative the UE has no transmit power left for the grant it was given. pl climbs from 29 dB to 69 dB, and that is the pathloss the channel simulator applies as the distance grows.
The ta column stays at 0.x throughout. At 10 km/h the distance change over this window is small, so the timing advance barely moves.
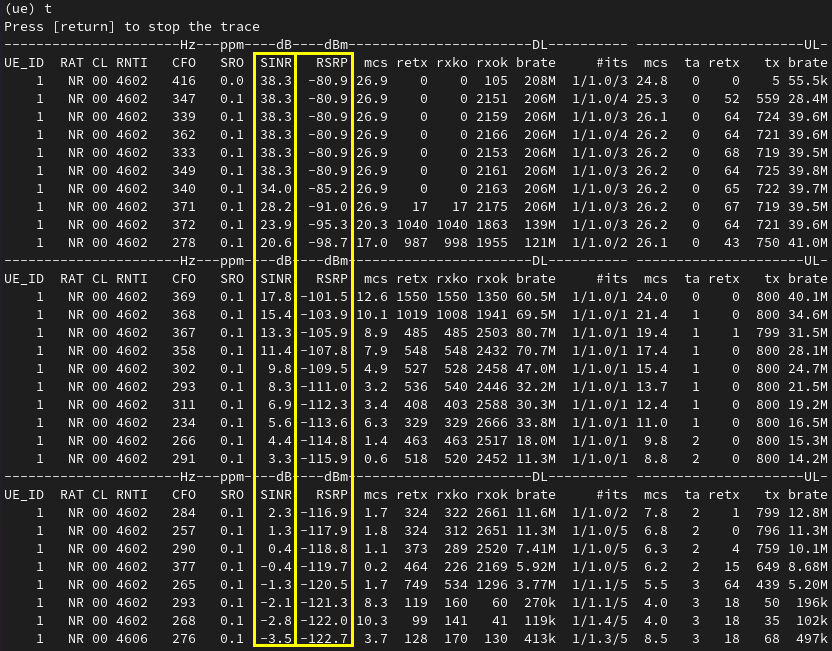
To check the effect of channel simulation on downlink, you can check out the 't' output on UEsim. You would notice that SINR and RSRP for DL decreases as UE moves farther away from the cell.
SINR starts at 38.3 dB with RSRP at -80.9 dBm. In the middle block SINR is down to single digits and RSRP is near -110 dBm. In the last block SINR goes negative at -3.5 dB and RSRP reaches -122.7 dBm.
The DL columns move with it. DL mcs falls from 26.9 to about 1.7 and DL brate from 206 Mbps to about 11 Mbps. The ta column steps from 0 to 3 over the same span.
Log Analysis
You can analyze the channel characteristics with Callbox log or UEsim log, but I think Callbox log is better option since it is based on real measurement.
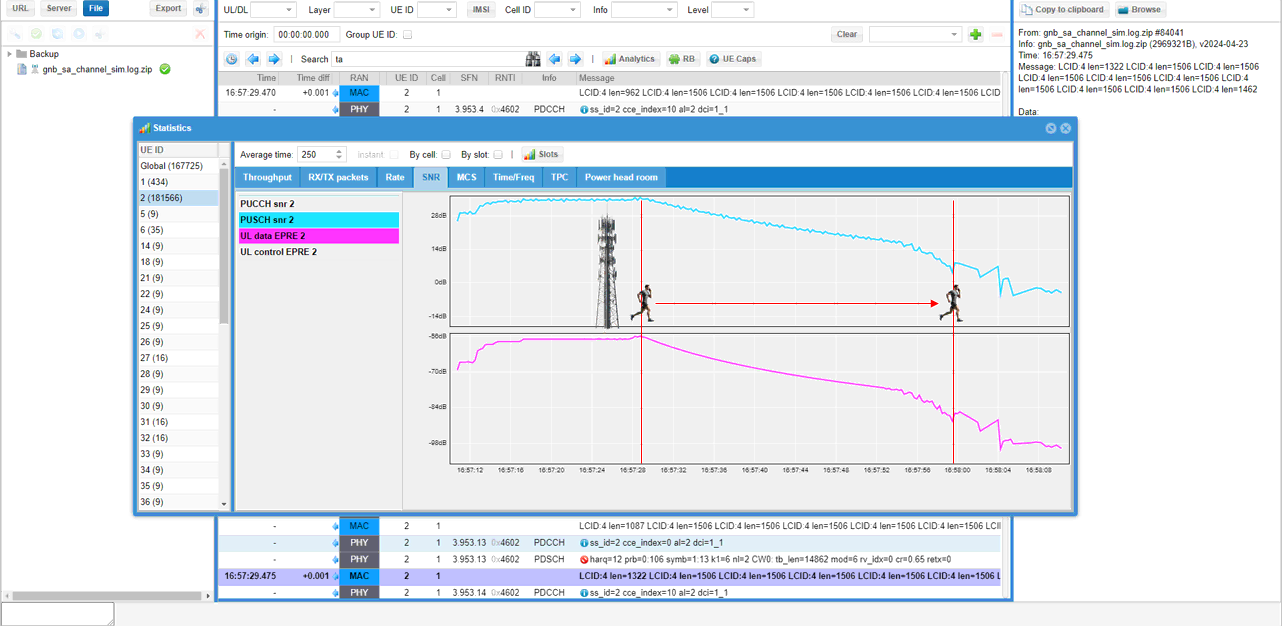
First let's check out SNR and Power(EPRE) for uplink data channel (PUSCH). As you see in the [SNR] tab, you see both SNR and EPRE for PUSCH(UL data) gradually decreseas as the mobile phone gets farther from gNB.
UE ID 2 is selected in the list on the left and the two enabled traces are PUSCH snr 2 and UL data EPRE 2. Average time is 250 ms, which smooths the per slot values enough to see the trend.
The upper trace starts near 28 dB and is well below 0 dB by the end of the window. The lower one is the received EPRE and runs from about -56 dB down to about -98 dB. Both start falling a little after 16:57:28, which is where the UE begins to move.
PUCCH snr and UL control EPRE are in the trace list as well. Turn them on if you want to compare the control channel against the data channel over the same span.
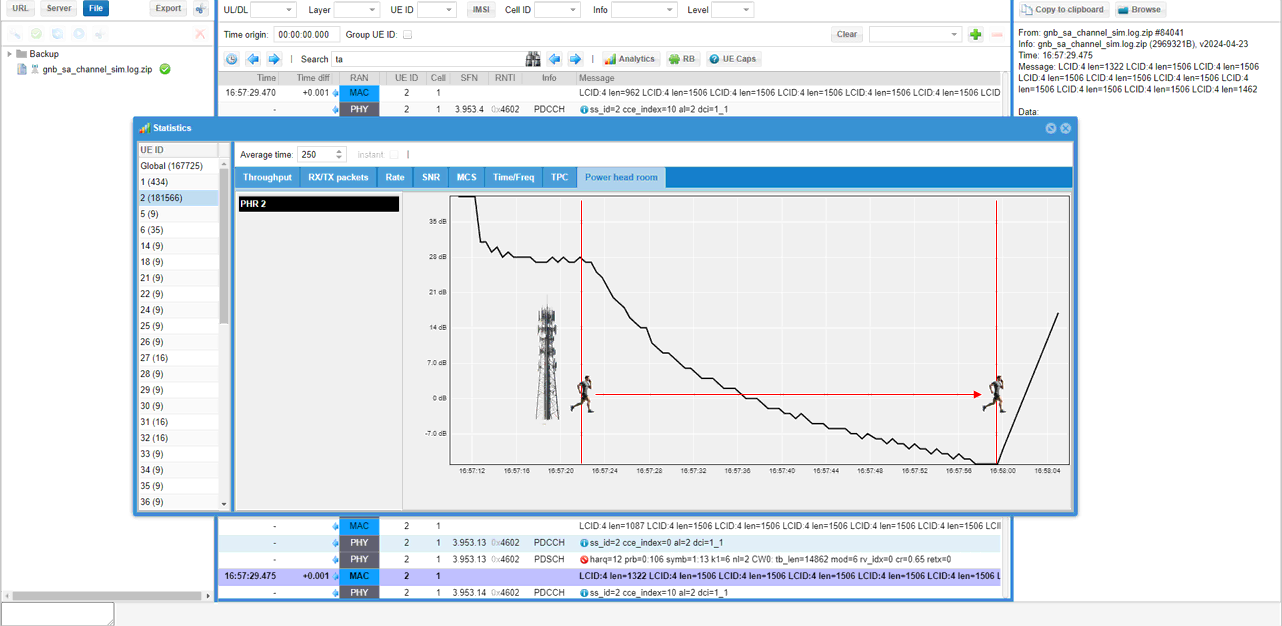
Now let's check out PHR(Power Headroom). As you see in the [Power head room] tab, you see the phr gradually decreseas as the mobile phone gets farther from gNB.
PHR starts a little above 35 dB and falls in steps. It crosses 0 dB around 16:57:52 and reaches about -7 dB. A negative power headroom means the UE has run out of transmit power for the grant it was given.
The trace turns sharply upward at the right edge, right at the end of the movement window. That is a useful point to line up against the throughput and MCS plots that follow.
Then let's check out throughput. As you see in the [Throughput] tab, you see the throughput gradually decreseas as the mobile phone gets farther from gNB.
Only PHY UL 2 is enabled, so the trace is the uplink. It settles around 32 Mbps while the UE is stationary, peaks a little above 40 Mbps just before the movement starts, then falls steadily to almost nothing by 16:58:00.
PHY DL 2 is in the list too. Add it when you want to see how far the two directions track each other. This test drives the uplink, so the uplink is the one to read.

Now let's look into RX/TX packet status. I want to focus on RX Bad CRC. You may expect this to be increasing as UE get farther away from gNB, but in this result it stay same over most of the location except where the UE got very far away. The CRC Bad stays at very low becaues gNB is performing link adaption procedure (e.g, changing MCS to prevent CRC error)
Four traces are on and the scale is packets per second. TX transmissions and TX retransmissions are the uplink side. RX CRC OK and RX Bad CRC are what the gNB actually decoded.
RX Bad CRC sits close to zero for almost the whole window and only lifts after 16:57:56, where the UE is at its farthest. RX CRC OK holds around 350 to 400 packets per second until the same point and then drops away.
TX retransmissions is the busiest trace. It runs high at the start, steps down when the movement begins and stays noisy for the rest of the run.

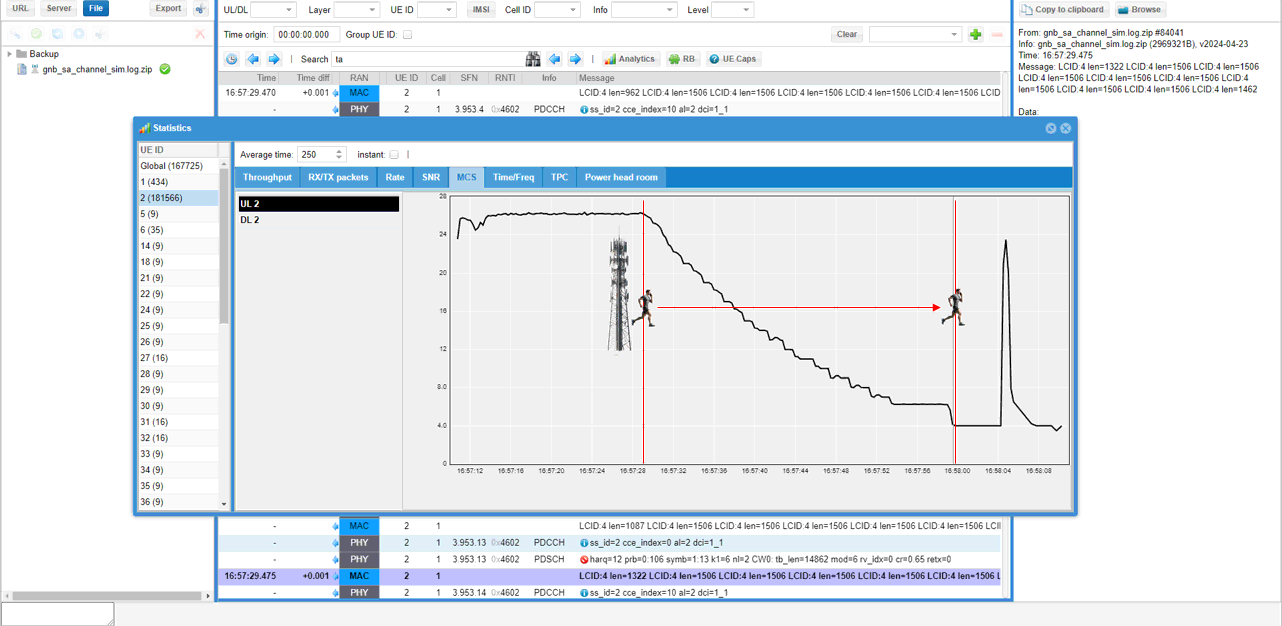
You can confirm how link adaptation goes on in [MCS] tab. You see that gNB reduces MCS as UE gets farther away from the cell.
UL 2 is the enabled trace and DL 2 is left off. It holds near 27 while the UE is stationary, then steps down once the movement starts and reaches about 4 by 16:57:56.
The staircase shape is the link adaptation itself. The gNB does not slide the MCS smoothly. It drops one step at a time as the measured SNR crosses each threshold, which is why there are flat treads between the drops.
The spike near 16:58:04 is past the end of the movement window. The MCS jumps back into the high 20s and comes down again.
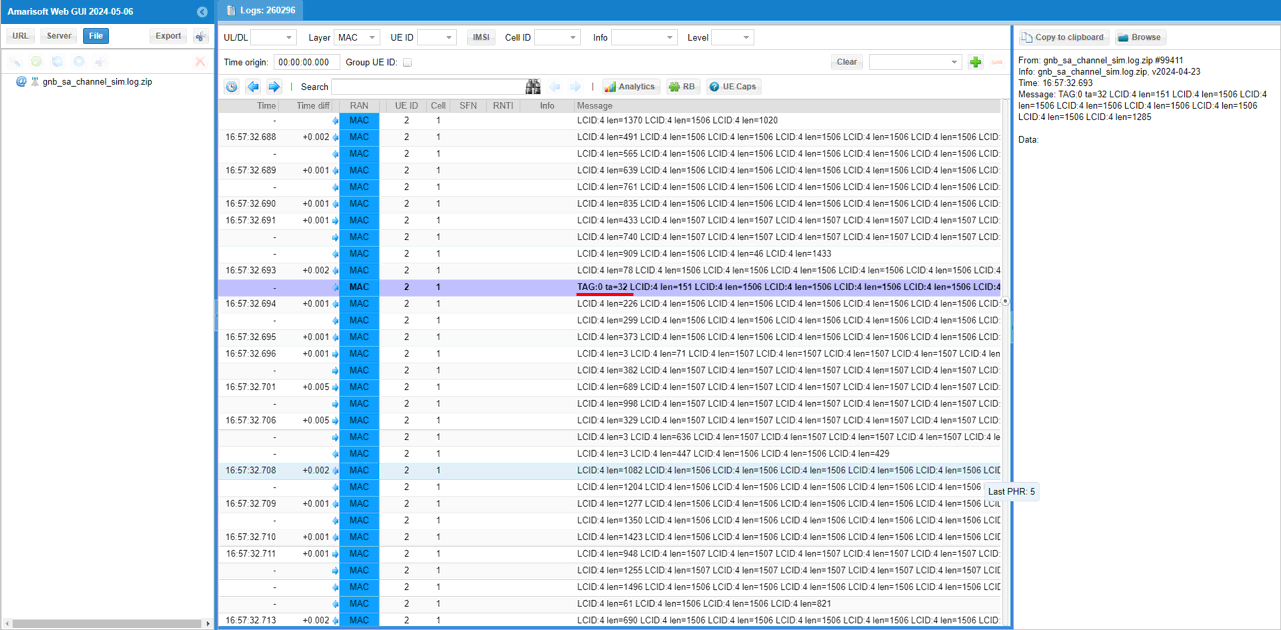
Since the UE is getting farther away, you may guess that there would be continuous adjustment of UL transmission timing with Timing Advance. This can be confirmed by the MAC CE with TA field. (
The highlighted entry carries TAG:0 ta=32. With 31 as the neutral value, 32 is a single step of adjustment, so the gNB is moving the uplink timing by the smallest amount it can.
The command travels as one MAC CE among the LCID:4 data blocks on the same line, not as a line of its own. Setting the Layer filter to MAC and typing ta in the Search box is the quickest way to pull these out of the log.
This is optional. You can do the same analysis shown above with UEsim log. An advantage of analyzing the log on UEsim would be that you can figure out exact point of the time that UE start moving from the log print ('move x=10 y=0 speed=10 dir=0 elevation=0' in this case). All other analysis is same as we checked with gNB log.
The move line is logged on the PROC layer, so setting the Layer filter to PROC brings it up on its own. Here it lands at 16:57:22.906.
The line repeats what you sent over the remote API. x=10 y=0 is where the UE was when the command arrived and speed=10 is the 10 km/h. dir=0 is the direction in degrees. elevation=0 keeps the UE on the ground plane.
Everything around it is ordinary PHY traffic for the same UE, PDCCH, PDSCH and PUSCH. The timestamp on the move line is what you use to line the plots up against the start of the movement.

Test 2 : 3GPP Profile - EPA
In this test, we simulate a situation where a UE is moving away from the cell at a constant speed under one of 3GPP predefined channel model named "EPA"
Configuration
I have used gnb-sa-channel-sim.cfg that is copied and modified from gnb-sa.cfg. I will use the same file for all the test in this tutorial and just modify the parameters in the file without creating a new file.
I am using the default mme, ims config as shown below.
I used ue-nr-sa-chan-sim-epa.cfg which is copied and modifed from ue-nr-sa.cfg on UEsim.

Following is the configuration on gNB. On gNB side, the configuration is almost identical to gnb-sa.cfg. The only difference is NR_BANDWIDTH which is changed to 40 (20 is the default value)
Nothing on the gNB side changes for this test. The cell is still FR1 TDD at 40 MHz with two downlink antennas and one uplink antenna. Everything that differs between the two tests is on the UEsim side.
Following is the basic configuration in ue-nr-sa-chan-sim.cfg . The configuration here should match the configuration of Callbox(gNB). The only thing to be set independantly are tx_gain and rx_gain that should be adjusted depending on test setup.
These three defines are unchanged from the first test and they still have to match the gNB. The channel type is set further down in ue_list, not here.
Enable channel_sim and delay_sim in cell_groups and specify the position, antenna radiation type (antenna: {type :"isotropic"}, cell reference power(ref_signal_power) broadcast in SIB1. (
This block is unchanged from the first test as well. multi_ue, channel_sim and delay_sim are all true, the cell sits at [0, 0] with an isotropic antenna, and ref_signal_power and ul_power_attenuation stay at -28 and 23.
Then specify UE position (position), noise floor(noise_spd) and channel type( channel:{ type:"epa", freq_doppler: 50, mimo_correlation: "low"} in ue_list:[{ }]. The position specified here is the initial position, you can move this position while running with RemoteAPI.
The UE still starts at position [10, 0], the same 10 m from the cell as in the first test. The channel block is the only part that differs.
The type is epa, the Extended Pedestrian A model from TS 36.101. freq_doppler is 50, which sets the Doppler frequency in Hz. It has no relation to the speed you give the UE, because speed only updates the position. Change freq_doppler if you want the fading itself to be faster or slower.
mimo_correlation is low, which is the identity correlation matrix from TS 36.101. The other choices are medium and high, and they tie the antenna branches more closely together.

This part is mainly for automation of the test process. But this is not mandatory, you can perform all of these operation manually. Just for this specific test, power_on, running LteSimServer and power_off is done automatically without human intervention.
The event list is unchanged from the first test. The UE powers on at 0, traffic runs from 2 seconds to 890, and the run ends at 900 seconds.
Perform the Test
I will follow the same procedure as shown here for all the test in this tutorial.
Check if the cell is configured as intended by checking the output of 'cell phy'
The output is the same as in the first test, since the gNB configuration did not change. It is still worth running before each test, because it is the quickest way to catch a bandwidth or ARFCN mismatch between the two boxes.
Start lte service on Callbox(gNB) and UEsim(UE) and make it sure that the UE is connected.
Once the initial attach is complete, go to /root/ue directory on UEsim and run the following remote API. This specific command is to move UE (ue_id 1) to move away from the cell at the speed of 10 km/h.
|
./ws.js ue '{"message" : "ue_move", "ue_id" : 1, "speed" : 10, "direction" : 0}' |
Then check how some of physical layer measurement changes in gNB trace log. Followings are some of the highlights you would notice :
- UL SNR is decreasing with time (as UE moves farther from gNB.
- UL MCS is decreasing with time (as UE moves farther from gNB (This is because gNB performs link adaptation).
- UL brate (Date Rate) is decreasing with time (as UE moves farther from gNB)
- UL phr (Power HeadRoom) is decreasing with time (as UE moves farther from gNB)
- Pathloss (pl) is increasing with time (as UE moves farther from gNB)
The columns move the same way as in the AWGN run, but the values swing much more from one row to the next. That swing is the fading, and it is what the EPA profile adds on top of the distance based loss.
UL snr goes from about 32 dB to about 11 dB, mcs from 23.6 down to 4.0 and brate from 36.9 Mbps to about 3.4 Mbps. phr is already negative by the end of the first block and reaches -25 dB. pl climbs from 30 dB to 76 dB.
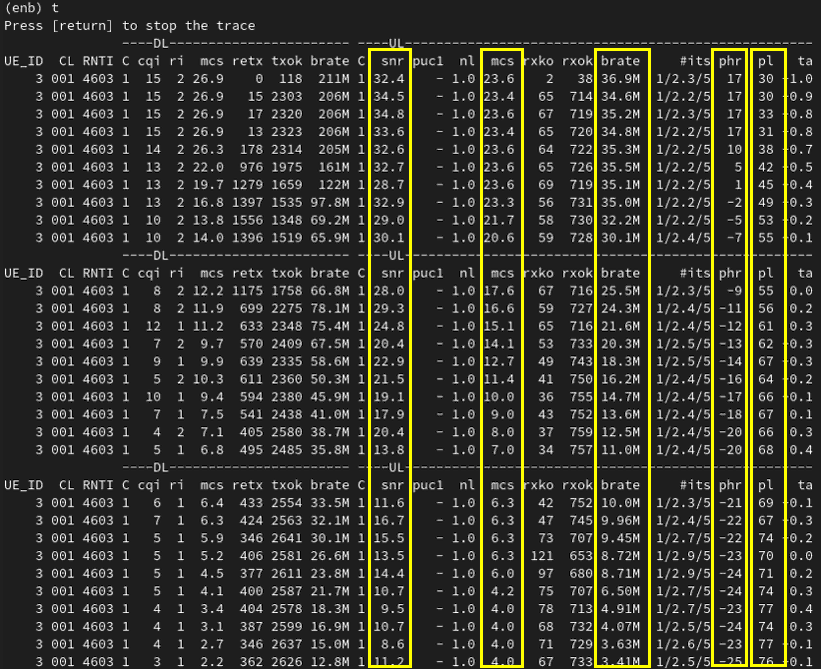
To check the effect of channel simulation on downlink, you can check out the 't' output on UEsim. You would notice that SINR and RSRP for DL decreases as UE moves farther away from the cell.
SINR starts at 48.3 dB with RSRP at -80.9 dBm. By the middle block SINR is in the twenties with RSRP near -105 dBm. In the last block SINR is under 5 dB and RSRP reaches -124.4 dBm.
The DL columns fall with it. DL mcs goes from 26.9 down to under 3, and the ta column steps from 0 up to 3.

Test 3 : Triggering PingPong Handover by Channel Simulator - LTE/Single UE
In this test, we simulate a situation where a UE is moving away from the cell at a constant speed under simple pedesterial channel. It is similar to previous test cases, but the difference is that we move UE using internal configuration parameter instead of remote API. This method would be much handy than remote API in some scenario where you want to trigger Handover for multiple UEs and to trigger handover repeatedly (e.g, ping pong handover)
Configuration
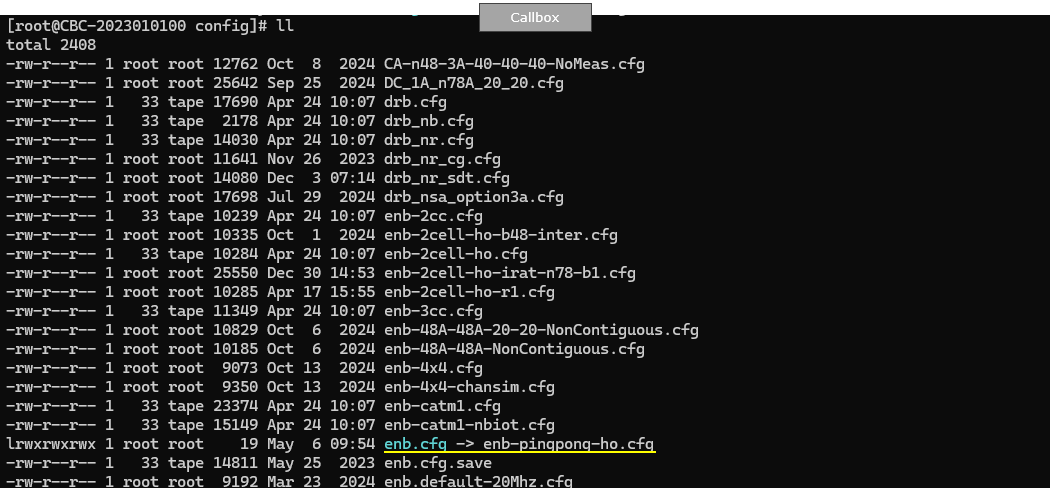
I have used enb-pingpong-ho.cfg that is copied and modified from gnb-sa.cfg. I will use the same file for all the test in this tutorial and just modify the parameters in the file without creating a new file.
I am using the default mme, ims config as shown below.
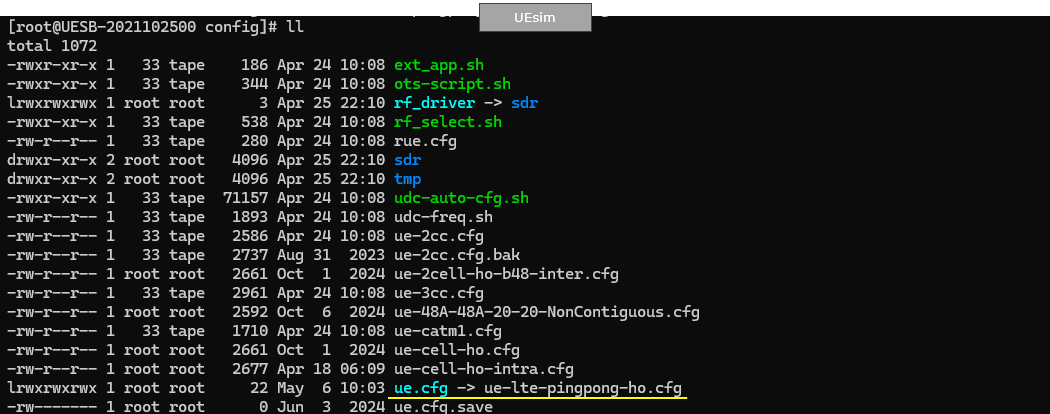
I used ue-pingpong-ho.cfg which is copied and modifed from ue-nr-sa.cfg on UEsim.
Following is the configuration on eNB. On eNB side, the configuration is almost identical to enb-2cell-ho.cfg.
Obviously we set N_CELL to 2 because this is handover scenario between two cells. and I set TDD to 1 (i.e, TDD), but you can do the same thing for FDD as well.
N_RB_DL is 100, so both cells are 20 MHz. N_ANTENNA_DL is 2 and N_ANTENNA_UL is 1, the same split as the earlier tests.
CHANNEL_SIM is 0 here and that is correct. The channel simulator runs on the UEsim, not on the eNB. The matching define on the UEsim side is the one you set to 1.
NG_ENB is 0, so this is a plain LTE eNB talking to the MME rather than an ng-eNB on a 5GC.

Now let's configure the two cells that will be involved in handover. Note that we configured the different frequency for the two cells. It means that we will perform inter frequency handover in this test.
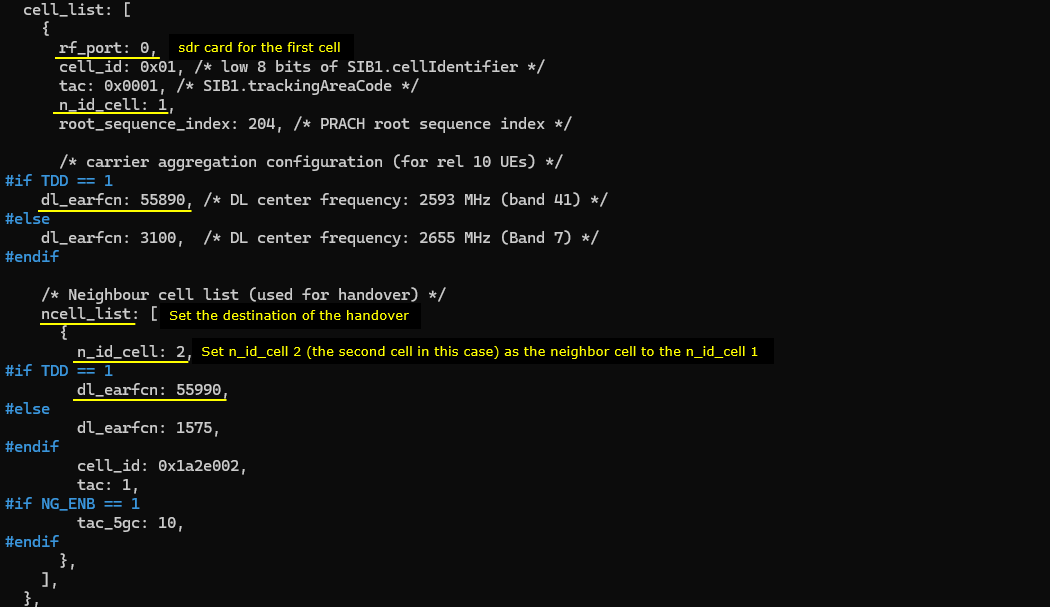
This is the configuration for the first cell. Note that the second cell (n_id_cell 2) is configured as a neighbour cell (ncell_list) to the first cell
The first cell runs on rf_port 0, which is the first SDR card. Its n_id_cell is 1, cell_id is 0x01 and root_sequence_index is 204.
dl_earfcn is 55890 in the TDD branch, and that is the branch in use. The FDD branch below it uses 3100 and is not used here. The frequency comment left in the stock file does not match the band the cell actually comes up on, so take the band from the cell phy output instead.
The ncell_list entry names the second cell by n_id_cell 2 and dl_earfcn 55990. That earfcn is what makes this an inter frequency neighbour. cell_id 0x1a2e002 and tac 1 identify the target. tac_5gc is only compiled in when NG_ENB is 1, which is not the case here.
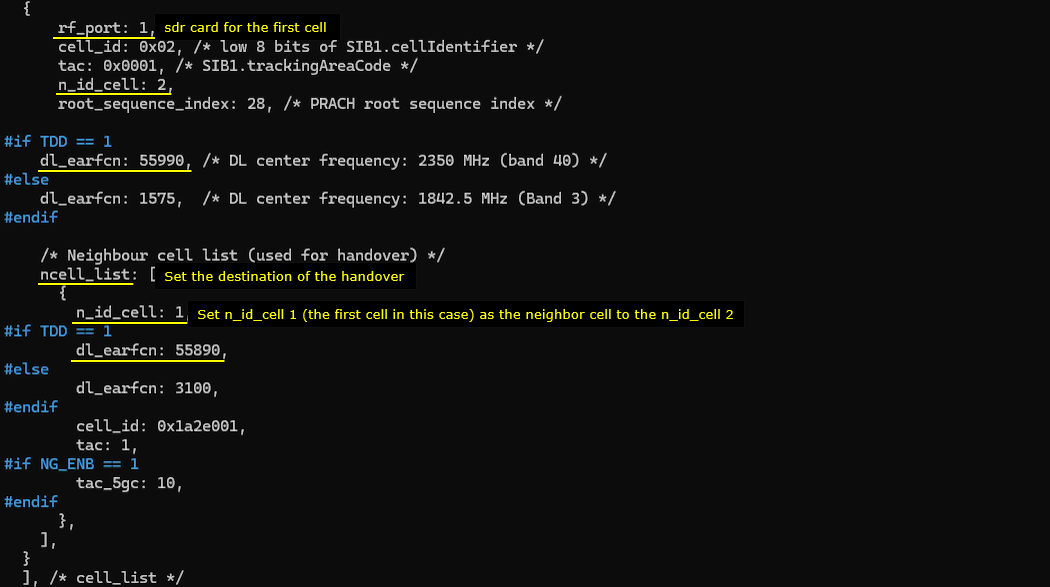
This is the configuration for the second cell. Note that the first cell (n_id_cell 1) is configured as a neighbour cell (ncell_list) to the second cell
The second cell sits on rf_port 1, the second SDR card. Its n_id_cell is 2, cell_id is 0x02 and root_sequence_index is 28. A different root sequence index keeps the two cells from colliding on PRACH.
dl_earfcn is 55990, the other frequency of the pair. Its ncell_list points back at n_id_cell 1 on dl_earfcn 55890, so each cell lists the other and the handover can run in both directions.
Both cells share tac 0x0001. The ping pong therefore stays inside one tracking area and no tracking area update is triggered on each handover.
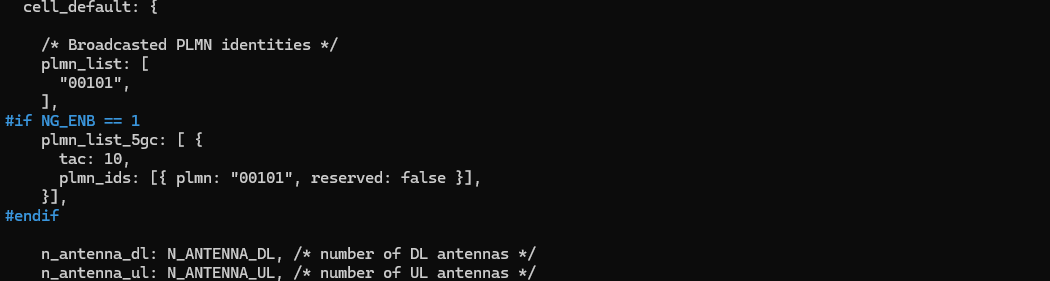
With Amarisoft, you can do both blind handover and measurement based handover. In this test, we will do measurement based handover. In order to do measurement based handover, you need to configure appropriate measurement condition for the handover. We usually configure this in cell_default block.
cell_default holds whatever the two cells share, so anything set here does not have to be repeated in each cell_list entry. The broadcast plmn_list is 00101, and n_antenna_dl and n_antenna_ul come straight from the defines.
The plmn_list_5gc block below it is guarded by NG_ENB and is not compiled in for this test.
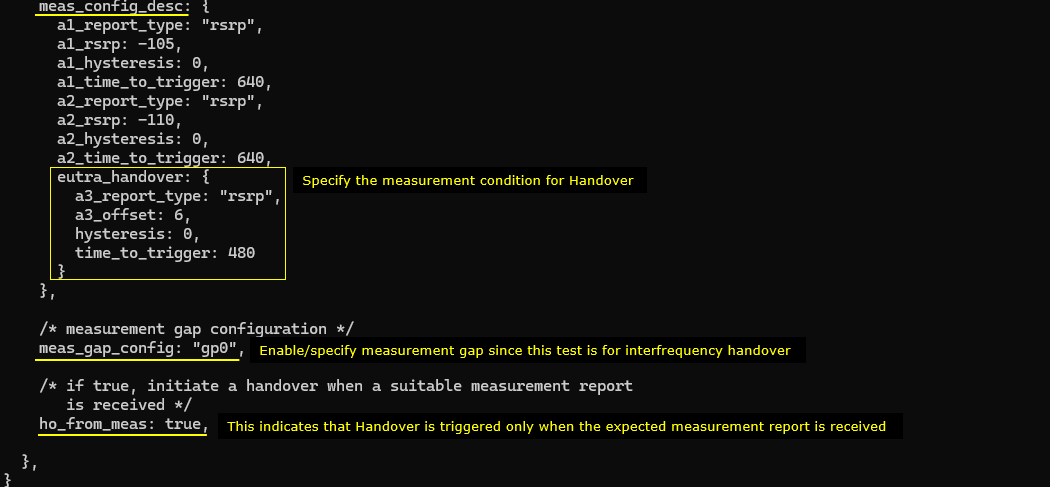
Configure measurement condition for source cell measurement and destination/handover measurement condition(a3 event in this case) as follows. In this test, we will do inter frequency handover, so we need to configure measurement gap (meas_gap_config) as well.
A2 fires when the serving cell RSRP falls below -110 dBm and stays there for 640 ms. A1 works the other way and fires at -105 dBm, which is how the eNB learns the serving cell has recovered. The 5 dB between the two thresholds is what stops the pair from toggling.
The eutra_handover block is the A3 condition. a3_offset is 6 and time_to_trigger is 480 ms. The neighbour has to beat the serving cell by that offset. It has to hold that lead for 480 ms before a report is sent.
meas_gap_config is gp0. Without a gap the UE has no time to tune away and measure the other frequency, so an inter frequency handover would never be reported at all. ho_from_meas is true, so the eNB starts a handover only after it receives the report.
In ue-pingpong-ho.cfg , followings are configured. Since the main purpose of this test is to show how to simulate UE moving back and forth between two cells triggering pinpong handover. The UEsim configuration is the main part to be noted.
As in eNB case, N_CELL is set to 2 since this is the handover between the two cells. TDD is set to 1 (i.e, TDD) which is just to match the eNB configuration. Important to note is that CHANNEL_SIM is set to 1 which indicates the channel simulator will be used.
CELL_BANDWIDTH is 20, which is the 20 MHz that N_RB_DL 100 gives on the eNB side. N_ANTENNA_DL is 2 and N_ANTENNA_UL is 1, matching the eNB again.
CHANNEL_SIM is the one define that differs between the two boxes. It is 0 on the eNB and 1 here, because the simulation runs entirely on the UEsim.

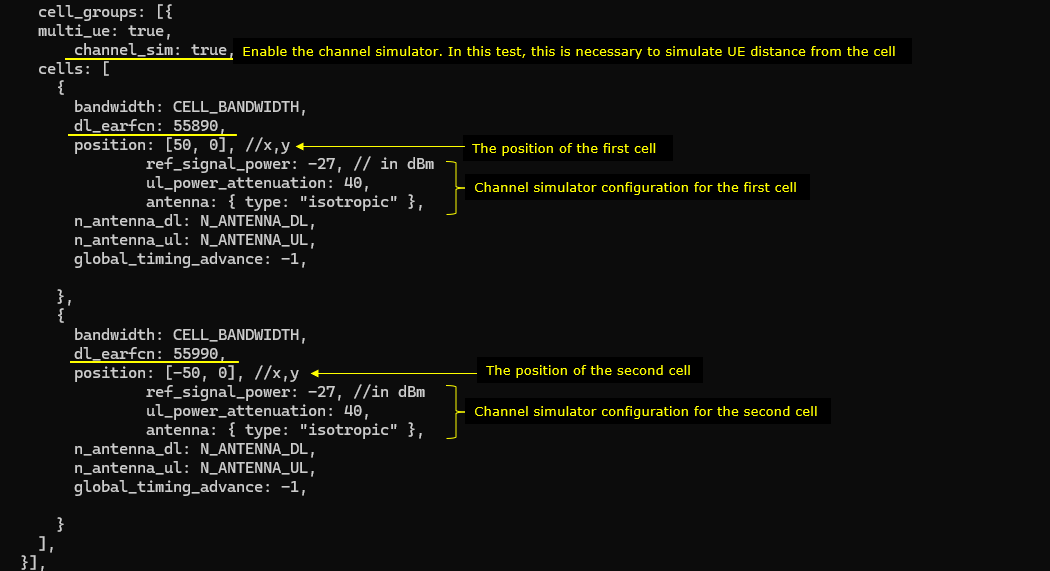
Now in cell_groups, channel_sim is set true which enables channel simulation functionality.
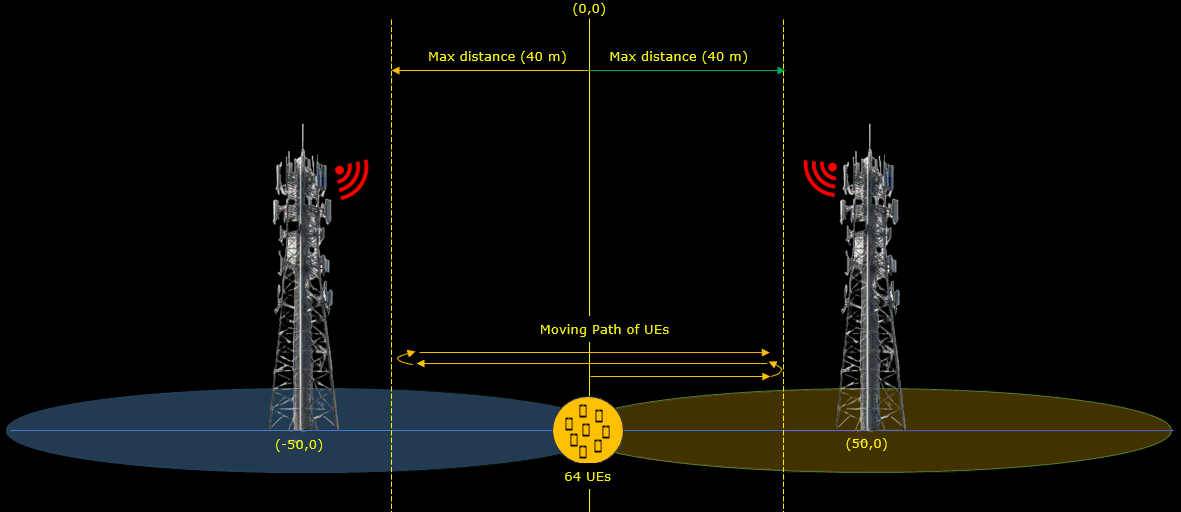
The position of the first cell is set to [50,0] and reference signal power(ref_signal_power), ul_power_attenuation and antenna type is configured for the simulated radio channel. In the same way, the simulated channel configuration for the second cell is set. The position of the cell is set to [-50,0] and all other configurations are same as the first cell.
The two entries have to line up with the eNB cells by frequency. dl_earfcn 55890 is the cell at [50, 0] and dl_earfcn 55990 is the cell at [-50, 0]. Get these the wrong way round and the UE will appear to move towards the cell it is leaving.
ref_signal_power is -27 dBm and ul_power_attenuation is 40 on both. Both use an isotropic antenna, so nothing in the geometry favours one side over the other.
global_timing_advance is -1 on both, which is the automatic mode. The UEsim takes the timing advance from the first RAR it receives and applies it to every UE.
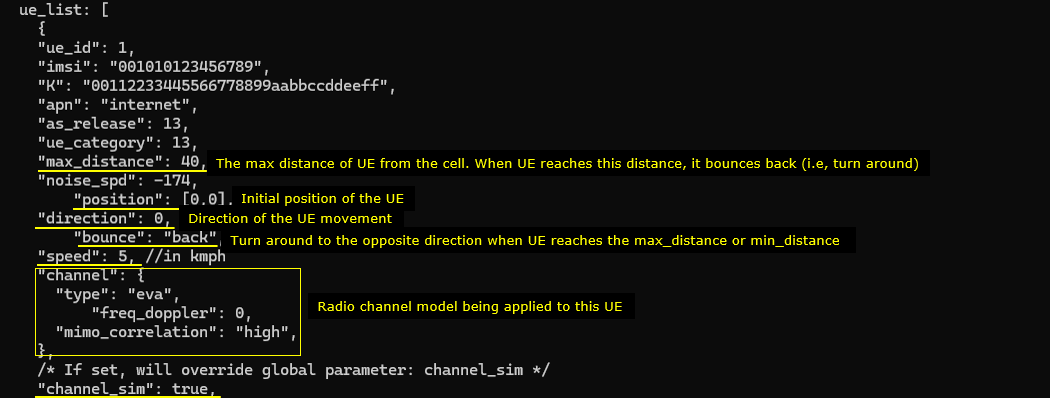
Following(ue_list) is the configuration that applies to a specific UE. Here you see the channel parameters that applies to the UE. First, UE is positioned at the [0,0] which is at the mid point between the two cells. It start moving towards the right cell (direction 0 meaning angle 0 degree). When it reaches the max_distance (in meters), it bounces back (turn 180 degree) and moves until it reaches min_distance (default 0). The moving speed is set to 5 km/h (speed: 5) in this test. The radio channel for this test is set to a 3GPP standard channel ("eva").
max_distance is 40 and bounce is back. The UE turns around 40 m out and walks the other way. With a start at [0, 0] and the cells at plus and minus 50 m, it never reaches either tower and keeps crossing the boundary between them.
noise_spd is left at the -174 default, so no extra noise is added on top. The fading profile is doing the work here instead.
freq_doppler is 0 and mimo_correlation is high. A Doppler of 0 keeps the EVA taps static rather than time varying, and a high correlation ties the antenna branches closely together, which holds the rank down.
channel_sim is repeated inside this UE entry as true. That overrides the global setting for this UE, so you can take one UE out of the simulation without touching the cell_groups block.
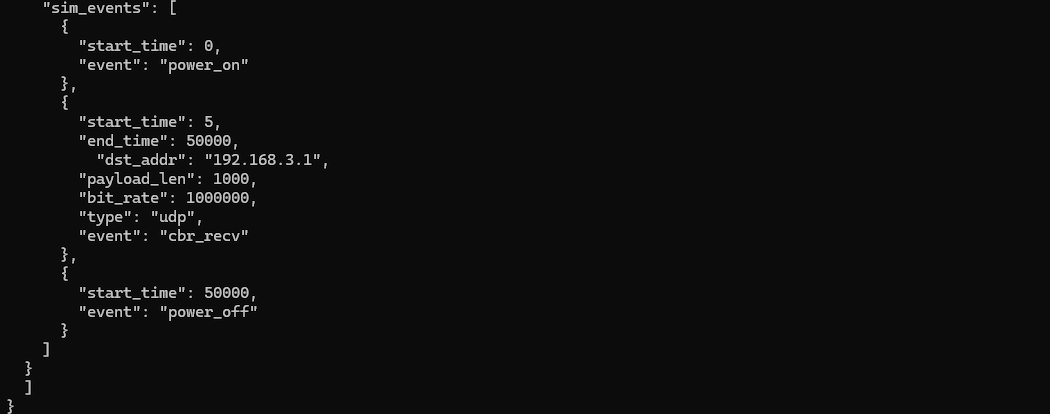
Following is optional configuration to automatically generate IP data stream. You can generate the IP data manually (e.g, ping)
The UE powers on at 0 and the run lasts 50000 seconds. That is long enough for the ping pong to repeat many times without you touching anything.
Only cbr_recv is used, so the traffic is downlink only. It asks for 1 Mbps of UDP with a payload_len of 1000 towards 192.168.3.1. A low rate is enough here, since the point is to keep the UE in connected mode rather than to measure throughput.
Perform the Test
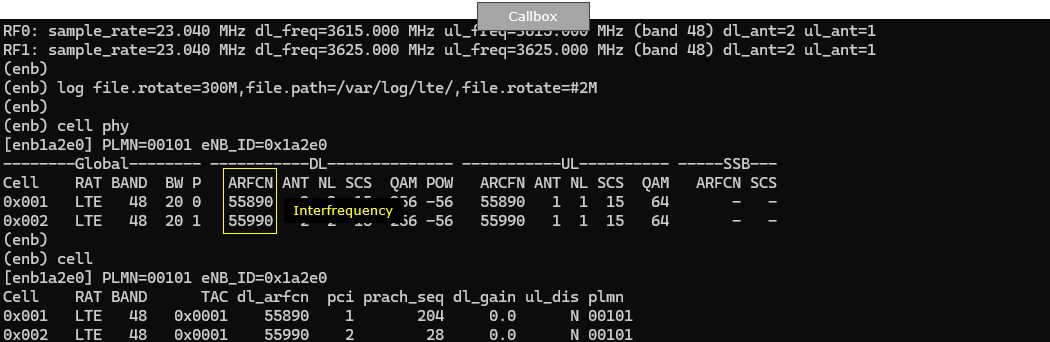
Now run the callbox and check out basic physical cell configuration. Note that two cells are configured for inter cellular frquency (
The two cells land on 55890 and 55990, which are 3615 MHz and 3625 MHz. Both come up on band 48 with a 20 MHz bandwidth. The band comments left in the stock cell_list block name different bands, so take the band from here.
The P column reads 0 for the first cell and 1 for the second. That is the rf_port, and therefore which SDR card each cell is on.
The cell output below confirms the rest. pci is 1 and 2, matching n_id_cell, prach_seq is 204 and 28, and both cells share TAC 0x0001 and PLMN 00101.
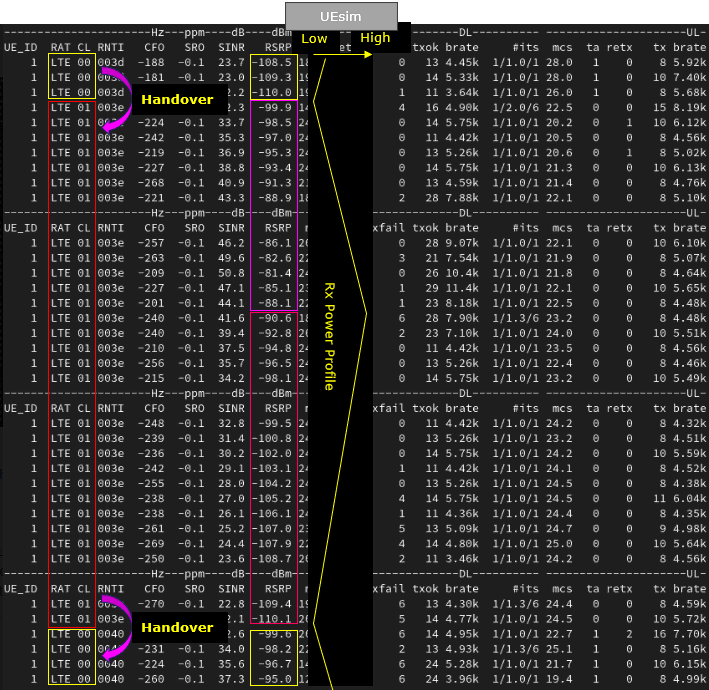
Then Start UEsim and power on UE and let it alone for some time. Then you will see the cell that the UE connected are switching back and forth between the two cells. Note that RSRP increases and descrease by itself implying that UE is getting closer and farther from the cell.
The CL column is the one to watch. It flips between 00 and 01 at each handover, and the RNTI changes with it because the UE is given a new identity on the target cell.
RSRP falls to about -110 dBm just before each switch, then jumps back to the mid -80s once the UE is on the other cell. That is the UE crossing the midpoint and being handed to the cell it is now closer to.
SINR moves the same way, from the low 20s at the boundary up to around 50 dB when the UE is near a tower. None of this comes from a command. The movement is entirely from the max_distance and bounce settings in the UE configuration.
Log Analysis
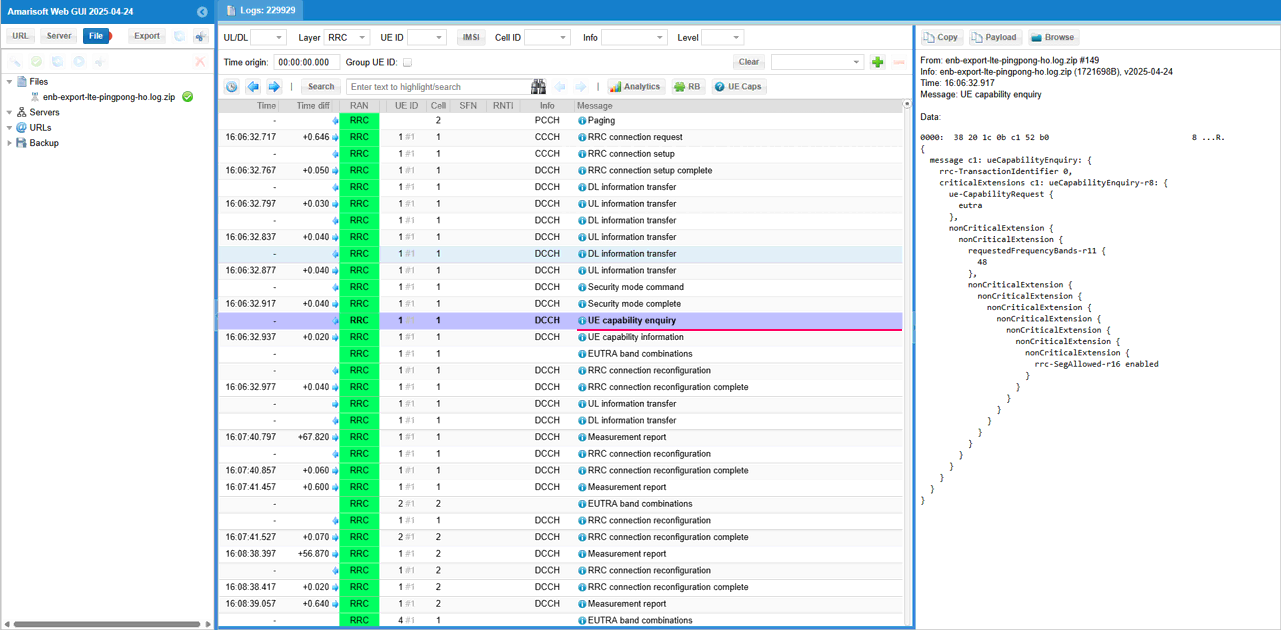
First it is always good to check with UE capability.
The Layer filter is set to RRC, which cuts the log down to the signalling messages and makes the attach sequence easy to follow. The enquiry lands at 16:06:32.917, right after security mode complete.
The eNB asks only for eutra and only for band 48, the band both cells are on. requestedFrequencyBands is what limits the answer, so a UE that supports many bands does not have to report all of them.
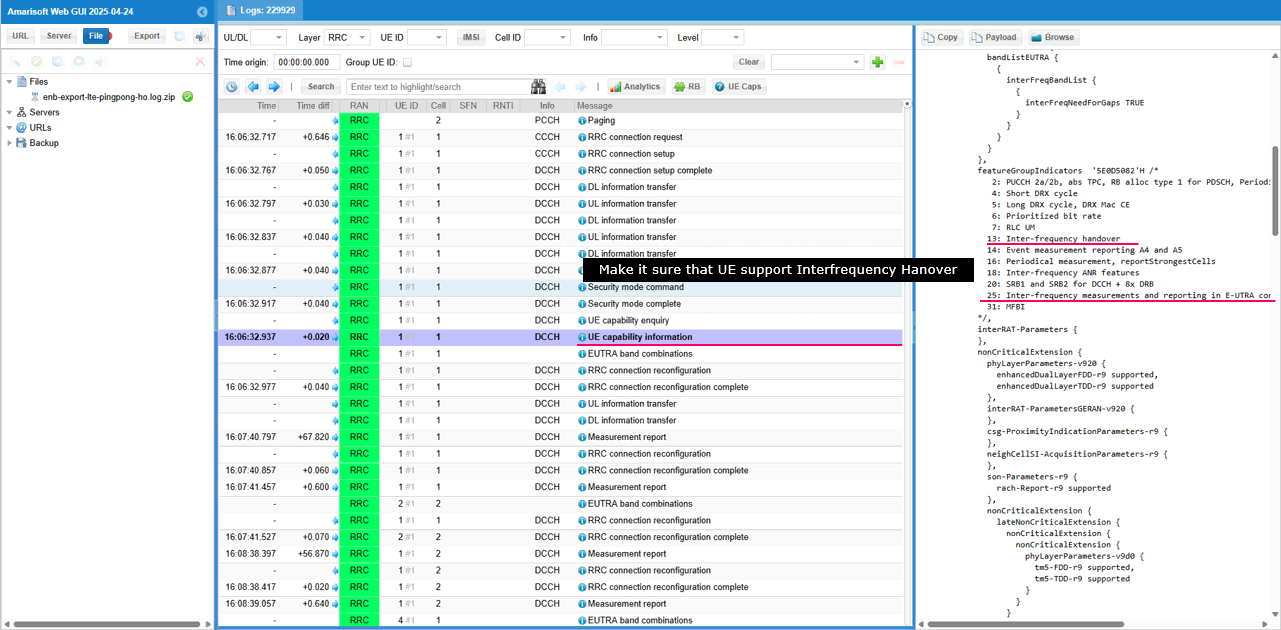
Since this test is configured for inter frequency handover, make it sure that UE capability support the related features (Interfrequency measurement report and interfrequency handover)
The answer arrives 20 ms later. featureGroupIndicators is the field that matters, and the decoder spells out each bit beside it. Bit 13 is inter frequency handover and bit 25 is inter frequency measurement and reporting. Both are present.
interFreqNeedForGaps is TRUE in the interFreqBandList. That is the UE saying it cannot measure the other frequency while it is receiving, and it is why the measurement gap has to be configured at all.
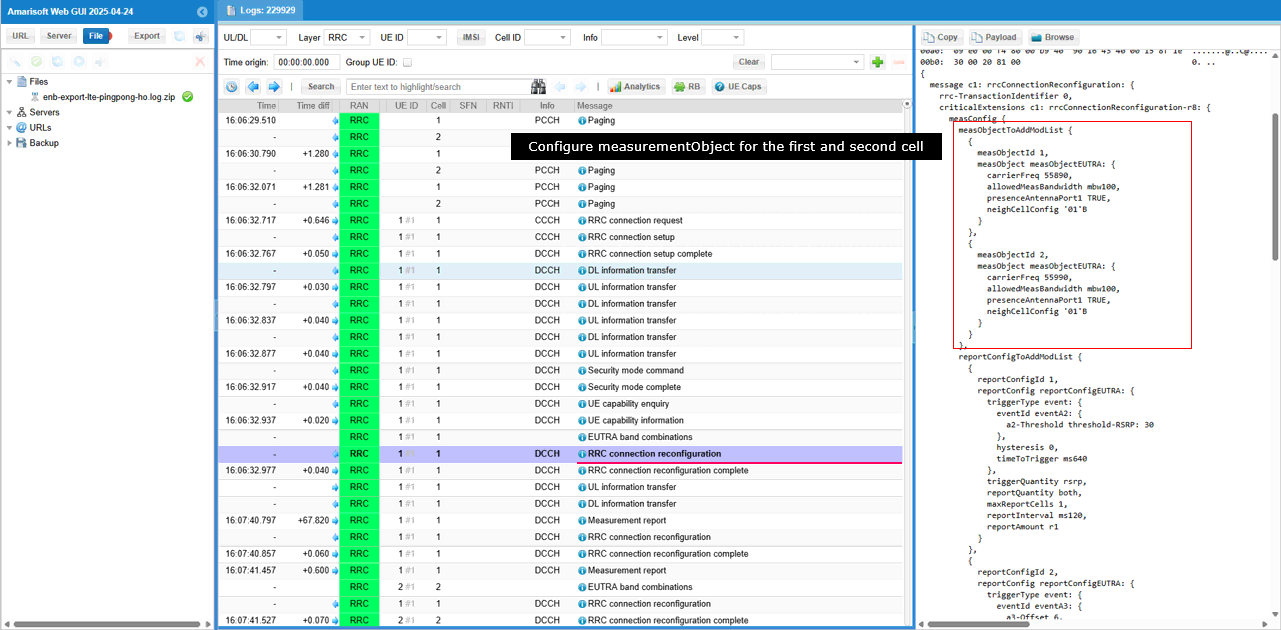
Now eNB sets up measurement configuration. First, defines measurement object that sets up the measurement frequency in measObjectToAddModList.
There are two objects, one per frequency. measObjectId 1 is carrierFreq 55890 and measObjectId 2 is carrierFreq 55990. The UE is told to watch both the cell it is on and the one it will move to.
allowedMeasBandwidth is mbw100, the full 100 resource blocks of the 20 MHz cell. An object only names a frequency, not a condition. The condition comes from the report configuration it gets paired with.
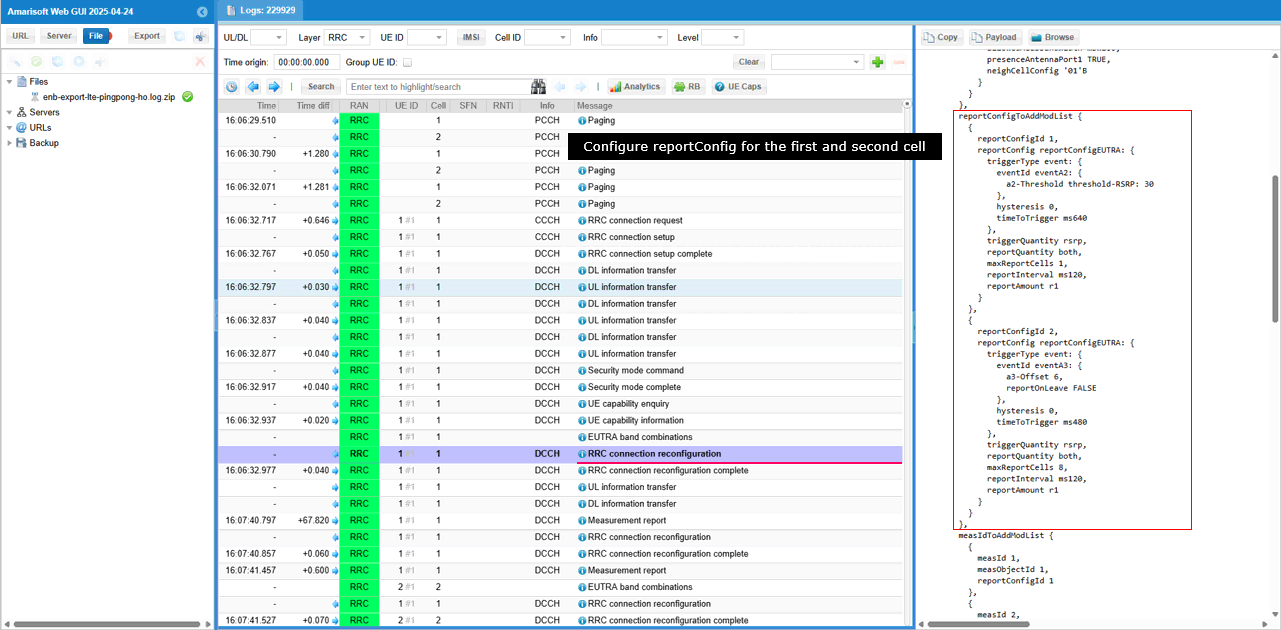
Then configures measurement events. In this case, two types of the events eventA2 and event A3 are defined in reportConfigToAddModList.
reportConfigId 1 is the A2. threshold-RSRP is 30, which is the RSRP range value for the -110 dBm you set as a2_rsrp, and timeToTrigger is ms640. maxReportCells is 1, since A2 only ever concerns the serving cell.
reportConfigId 2 is the A3. a3-Offset is 6 and timeToTrigger is ms480, both straight from the configuration. maxReportCells is 8, so this report can carry several neighbours at once.
reportAmount is r1 on both, so each event produces a single report rather than a repeating series.
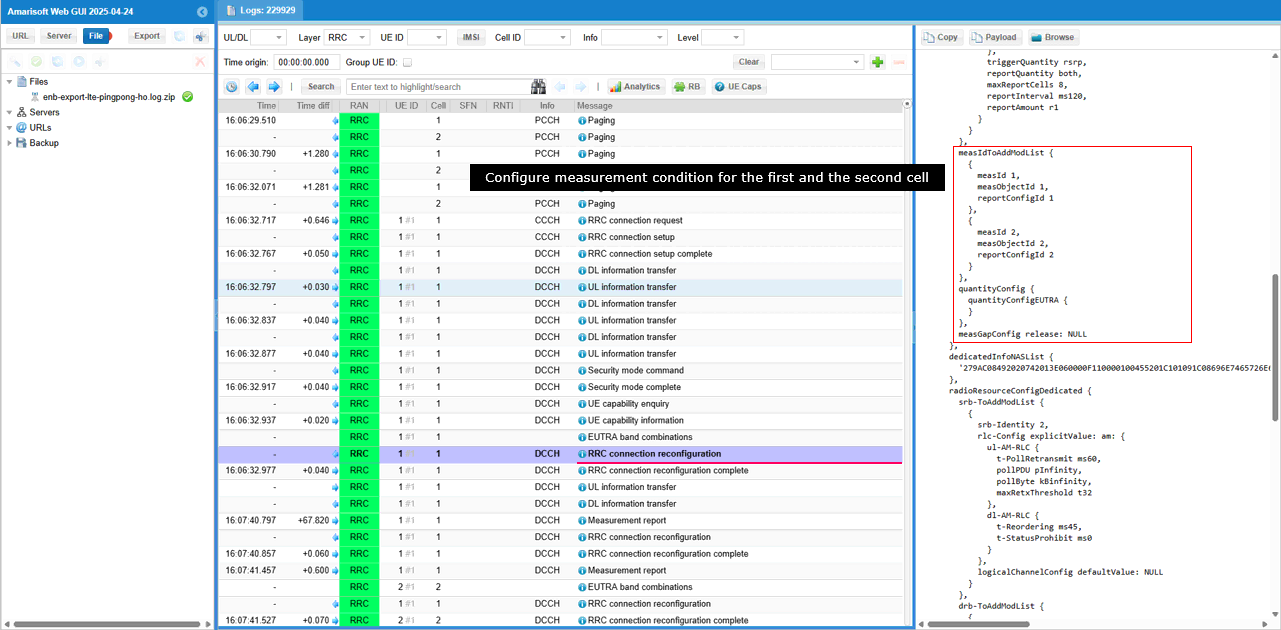
Combining the measurement object and report configuration, specific measurement configurations are defined in measIdToAddModList. In this case, two measurement configurations are defined. One with measObjectId 1 and reportConfigId 1 and the second one with measObjectId 2 and reportConfig 2. At this point, measurementGap is not configured yet.
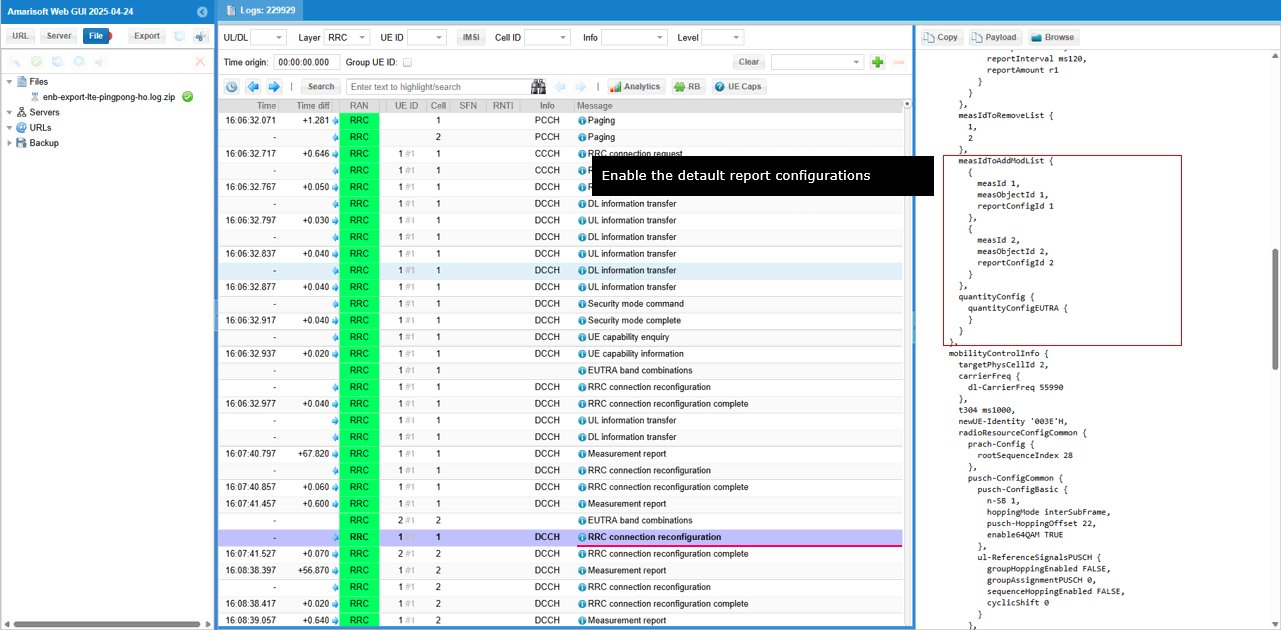
measId is the handle the UE puts in its report, so measId 1 means A2 on 55890 and measId 2 means A3 on 55990. Reading any report starts with looking its measId up here.
measGapConfig is release NULL at this point, which explicitly clears any gap. The UE can measure 55890 without one, because that is the frequency it is already on.
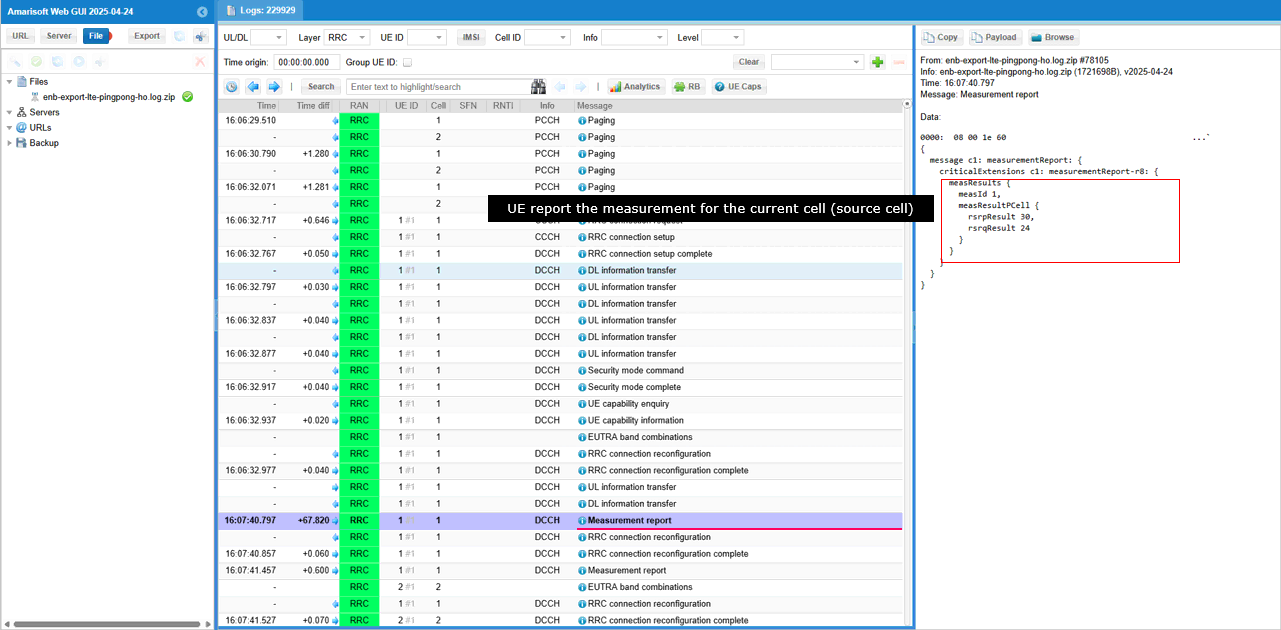
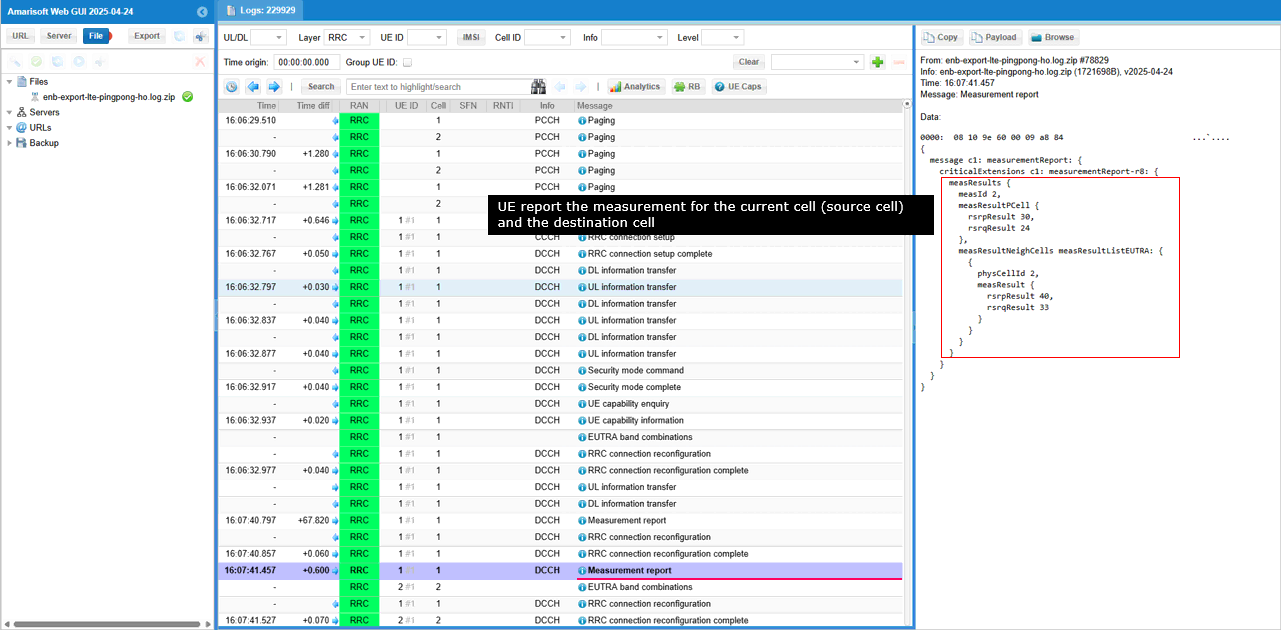
If the measurement requirement is met, UE send measurement Report for the PCell. By measId, you would notice that this is the report for event A2
measId is 1, the A2 pairing from the list above. rsrpResult is 30, the same value as the a2-Threshold, so the report goes out the moment the serving cell crosses it.
The report carries measResultPCell only. There is no neighbour list, because A2 says nothing about neighbours. It only tells the eNB that the serving cell has become weak.
It arrives 67.8 seconds after the previous message, which is how long the UE took to walk far enough out.
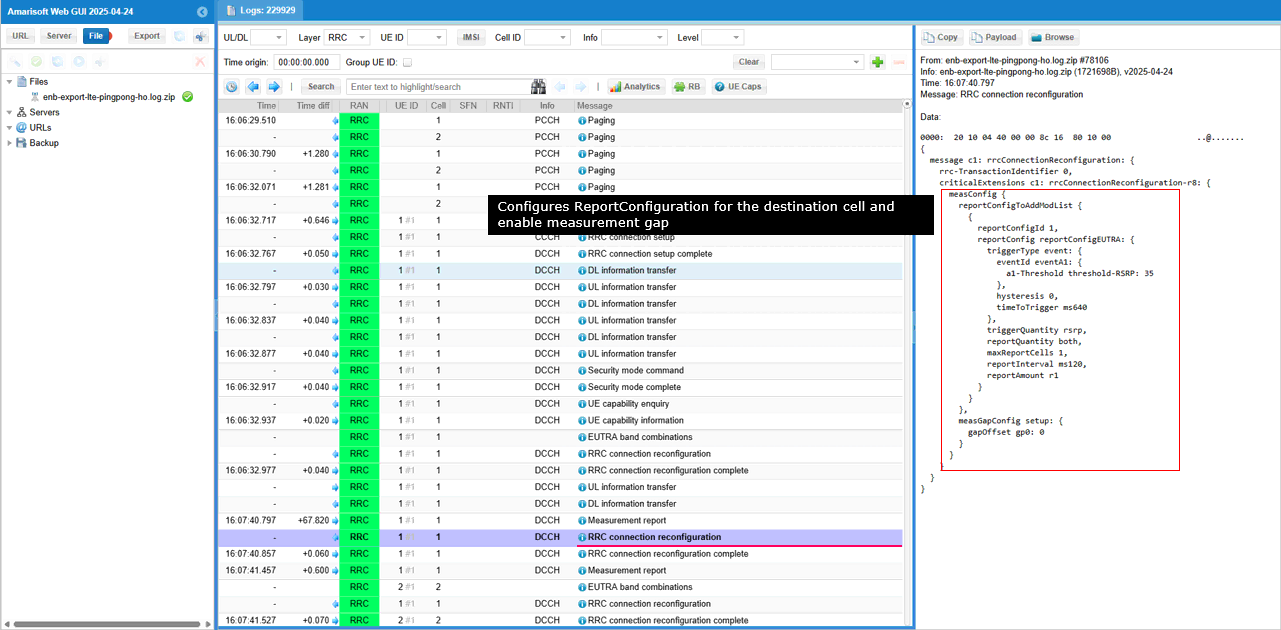
When the event A2 report is recieved, eNB activates measurement Gap. (
Two things happen in the same message. reportConfigId 1 is rewritten from A2 to A1 with a1-Threshold 35, so the eNB can be told when the serving cell recovers and the gap is no longer needed.
measGapConfig changes from release to setup with gapOffset gp0: 0. Only now can the UE tune away and measure 55990.
Now UE sends measurement report for both PCell and neighbor cell. By the measId and its definition shown above, you would notice this is the report for event A3.
measId is 2, the A3 pairing. The serving cell comes back at rsrpResult 30 and physCellId 2 at 40, so the neighbour is 10 RSRP steps stronger. That clears the a3-Offset of 6 with room to spare.
This lands 660 ms after the gap was set up. The UE needed that gap before it could see the neighbour at all, so nothing could have been reported earlier.
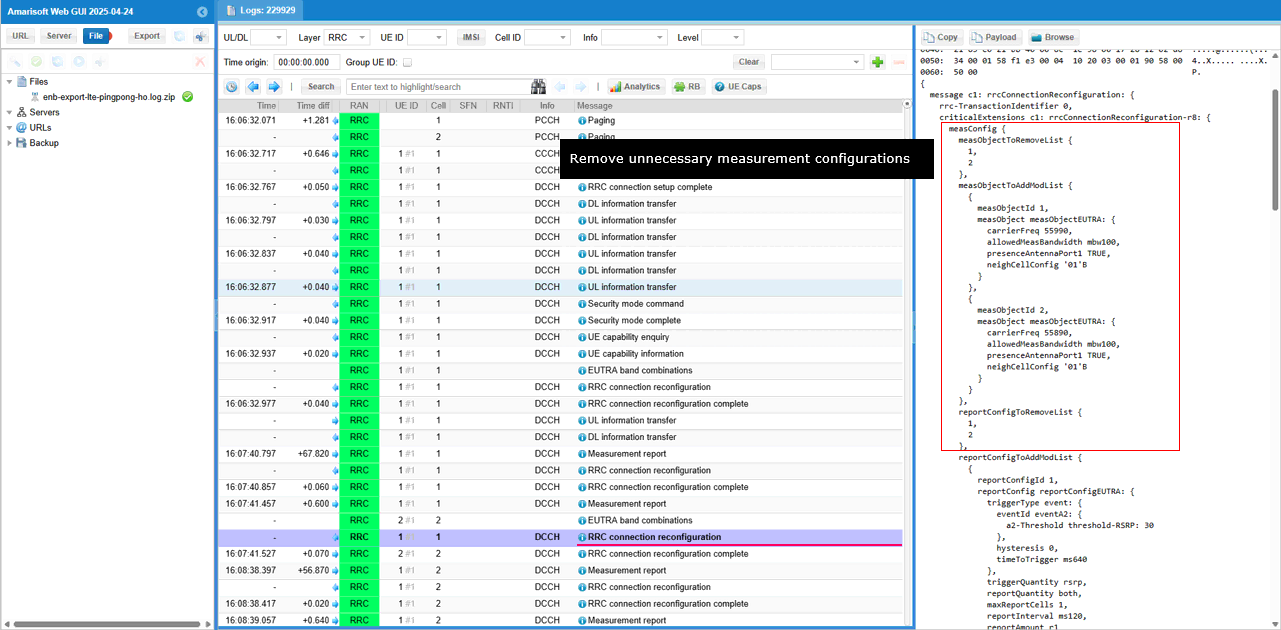
Now eNB sends RRC Connection Reconfiguration to UE for handover. In addition to handover configuration, various measurement reconfiguration are done in the same message as well.
First the unnecessary measurement configurations at this points are removed.
The remove lists clear both measurement objects and both report configurations. The objects are then added back with the frequencies swapped. measObjectId 1 is now 55990 and measObjectId 2 is 55890.
After the handover the UE is on the other cell, so the roles of the two frequencies are reversed. Rebuilding the objects this way keeps measId 1 meaning the serving cell and measId 2 meaning the neighbour, whichever cell the UE is on.
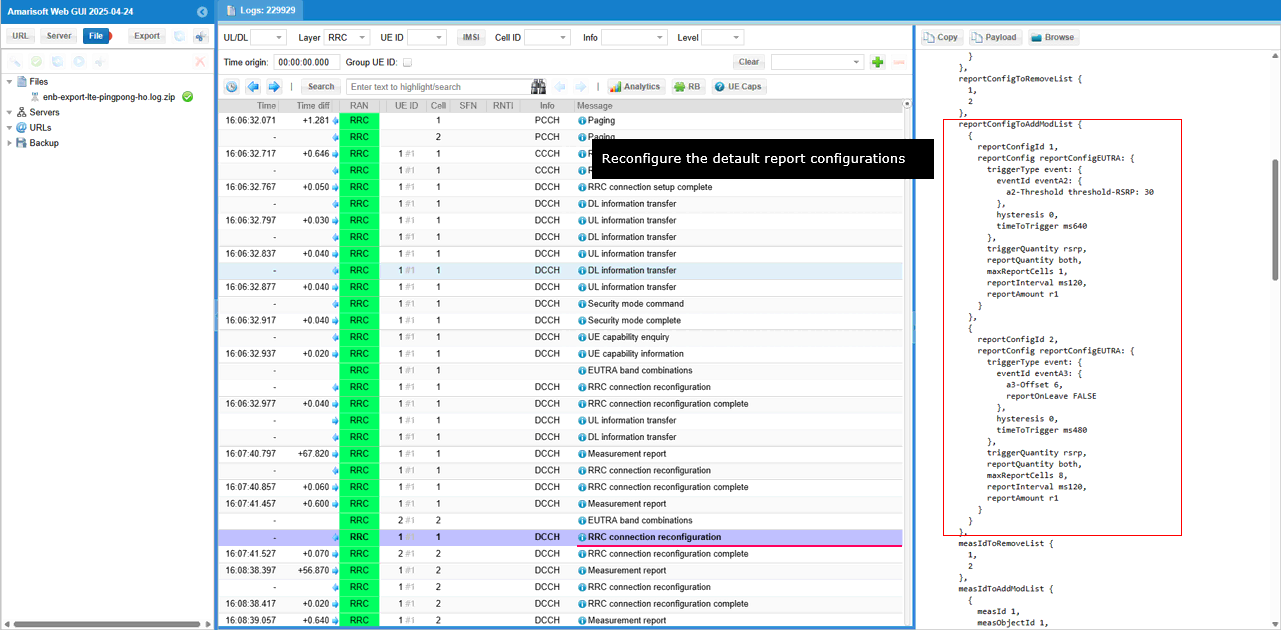
Then some ReportConfigurations are sets up again.
reportConfigId 1 goes back to A2 with the same threshold of 30, and reportConfigId 2 is A3 with a3-Offset 6 again. These are the values the UE started with, so the cycle can repeat from the beginning on the new cell.
The A1 that was set up to watch for recovery is gone. The handover has happened, so there is nothing left to recover from.
The measurement identities are rebuilt in the same message. measId 1 is paired with measObjectId 1 and reportConfigId 1, and measId 2 with measObjectId 2 and reportConfigId 2, exactly as before. Only the frequencies underneath them changed.
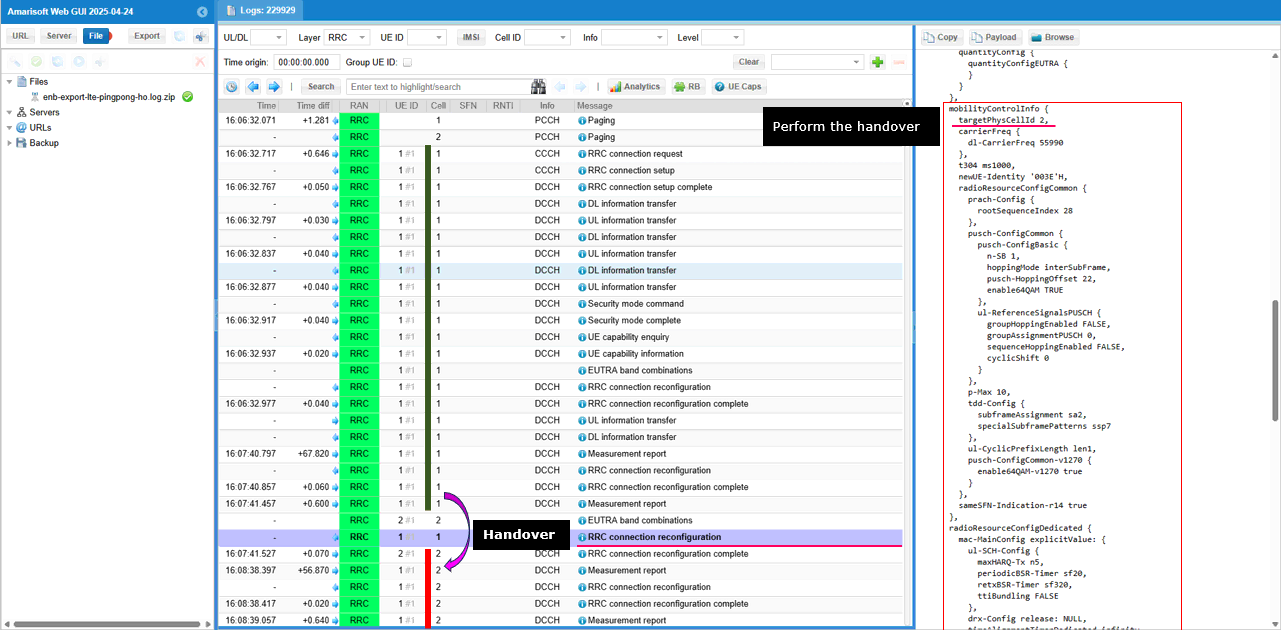
mobilityControlInfo starts just below. targetPhysCellId is 2, dl-CarrierFreq is 55990 and t304 is ms1000. t304 is how long the UE has to complete the handover before it declares failure.
Finally Handover configuration is configured and handover is done in both UE and eNB.
targetPhysCellId 2 is what actually moves the UE. newUE-Identity is 003E, the C-RNTI it will use on the target cell, and rootSequenceIndex 28 is the target cell PRACH configuration.
The Cell column in the log confirms it. The rows before this message are on cell 1, and the reconfiguration complete that follows is on cell 2.
tdd-Config comes across as subframeAssignment sa2 with specialSubframePatterns ssp7, and p-Max is 10. The UE gets everything it needs for the target cell in this one message, so it never has to read the target SIBs.
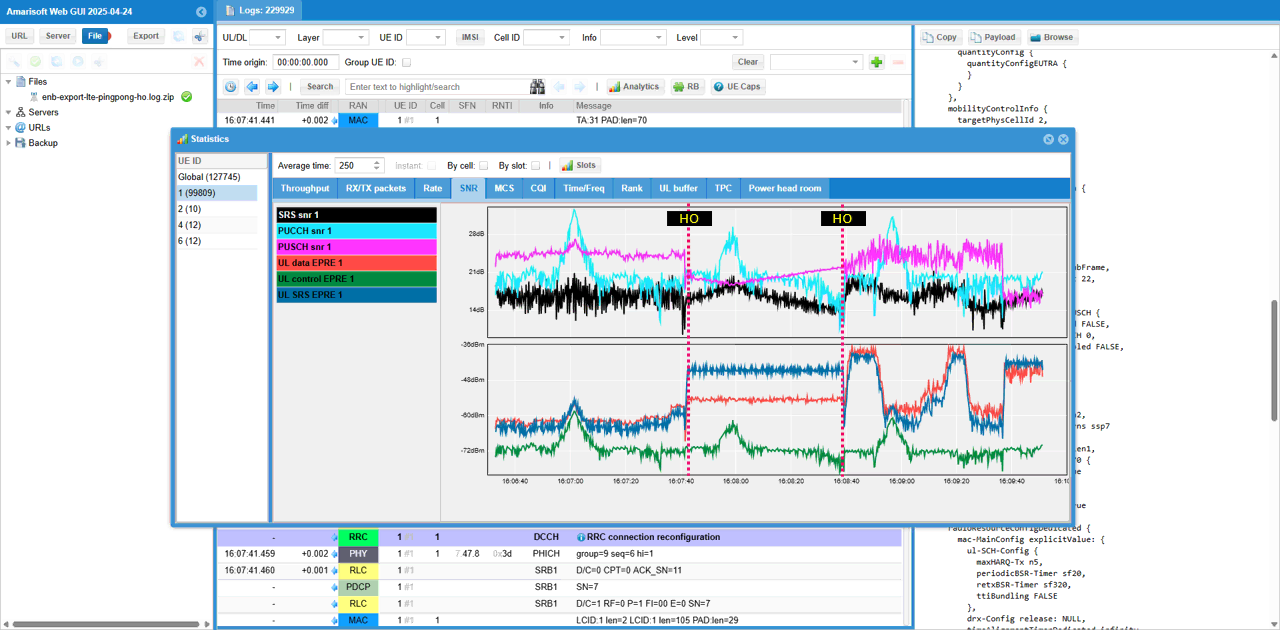
Here I want to share various plots showing different states / quality of the radio channel. Since fading is being applied during the test, the plots may not always obvious in terms of triggering handover, but I just want to let you know that you can use these plots for more intuitive analysis. If you apply more simple channel model (e.g, with constant awgn channel rather than fading channel), you may have a little bit clearer correlation between these plots and the UE movement(position change)
At this moment, I am not much interested in throughput related plots. I like to check plots more related to radio channel quality.
Check out SNR plots and see how each of the physical channel characterstics varies.
Six traces are enabled for UE 1, three SNR and three EPRE. The two HO markers sit on the handovers, at about 16:07:40 and 16:08:40.
The SNR panel on top stays between roughly 14 and 28 dB throughout and is hard to read against the movement. The EPRE panel below is clearer. Each trace steps at the marker and then drifts as the UE walks away from its new cell.
The three EPRE traces are the data channel, the control channel and SRS, and they do not sit at the same level. Pick one and follow it rather than trying to read all three at once.
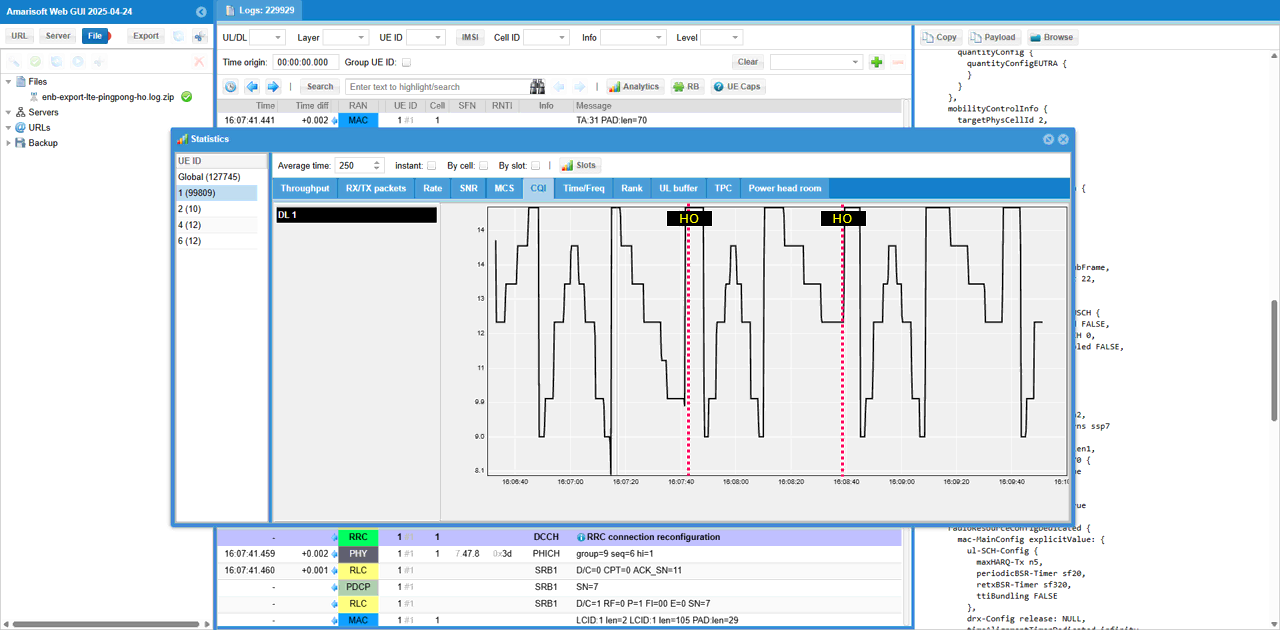
Check out CQI plot and see how it varies
CQI runs as a sawtooth between about 8 and 14 and repeats with the UE movement. It climbs while the UE approaches a cell and falls away as it leaves.
The two HO markers do not sit at the bottom of the sawtooth. A handover happens after the report has been triggered and processed, so it always lags the worst point by a little.
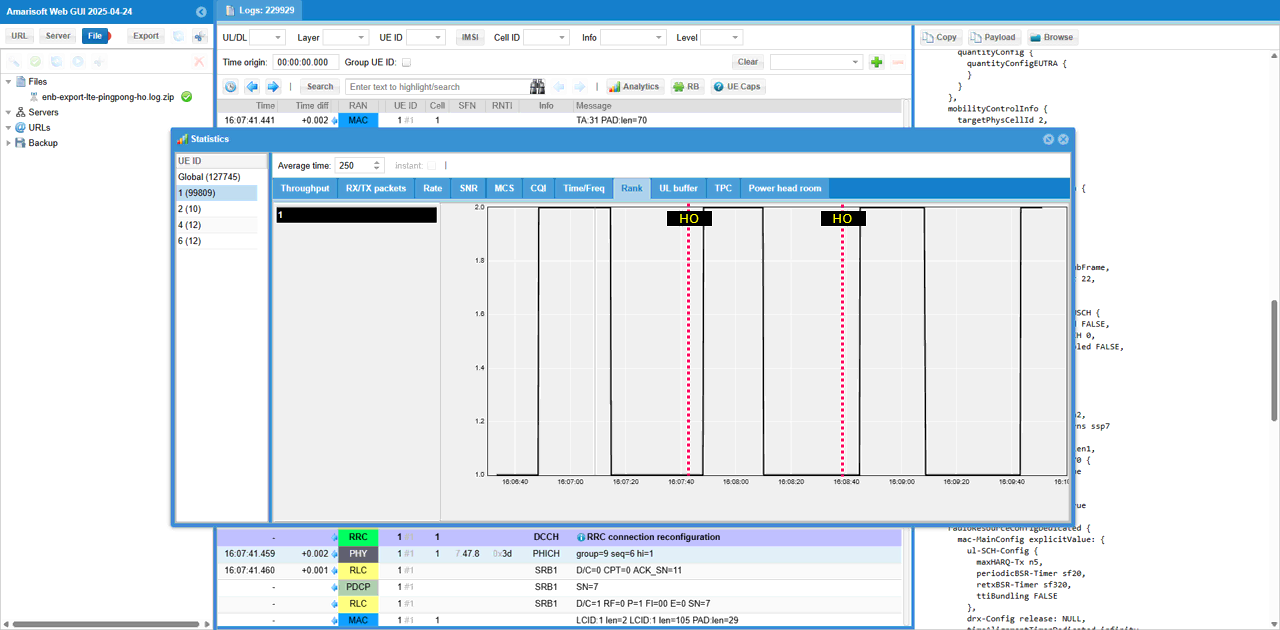
Check out Rank plot and see how it changes
Rank only ever takes 1 or 2, since the cells are 2x2. The trace is close to a square wave. It sits at 2 while the UE is near a cell and drops to 1 at the far points.
The mimo_correlation of high in the UE configuration is what holds the rank down at the boundary. Set it to low and the UE would keep rank 2 for longer.
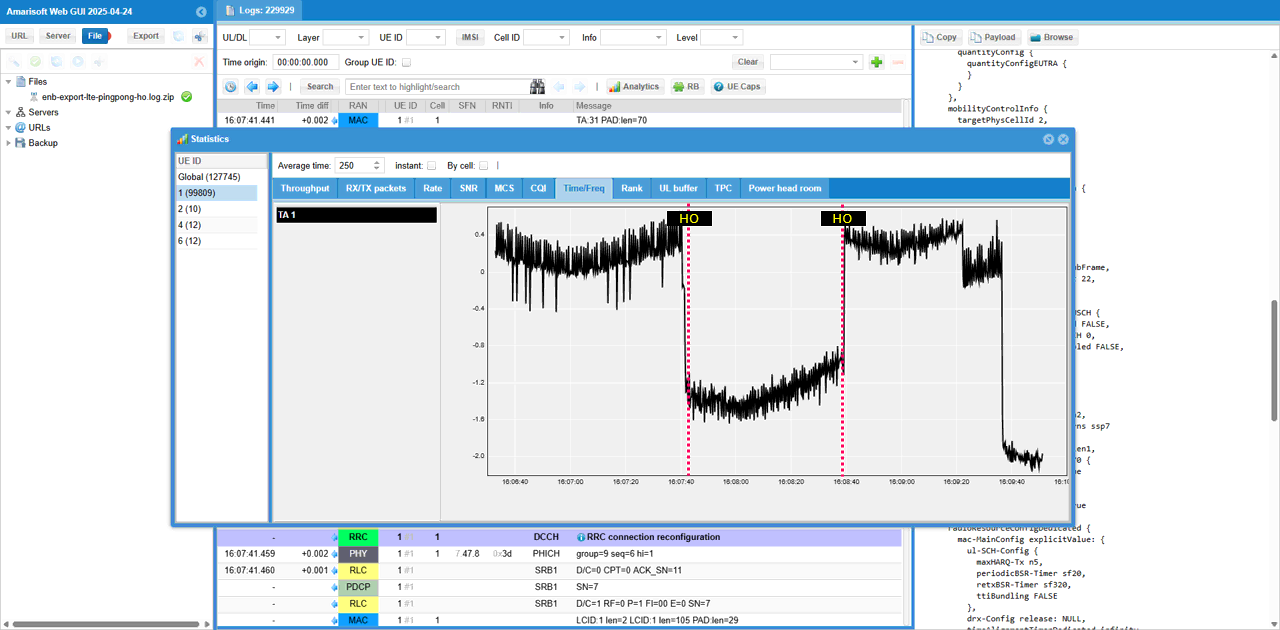
Check out Timing Advance. You see the drastic discontinuity at the point of handover.
TA sits around 0 to 0.4 while the UE is on the first cell, then falls to about -1.4 the instant the first handover happens. It climbs back towards -0.8 as the UE approaches the new cell, and jumps back up at the second handover.
The step is the whole point. Distance to the serving cell changes discontinuously when the serving cell changes, and the timing advance has to follow it in one move.
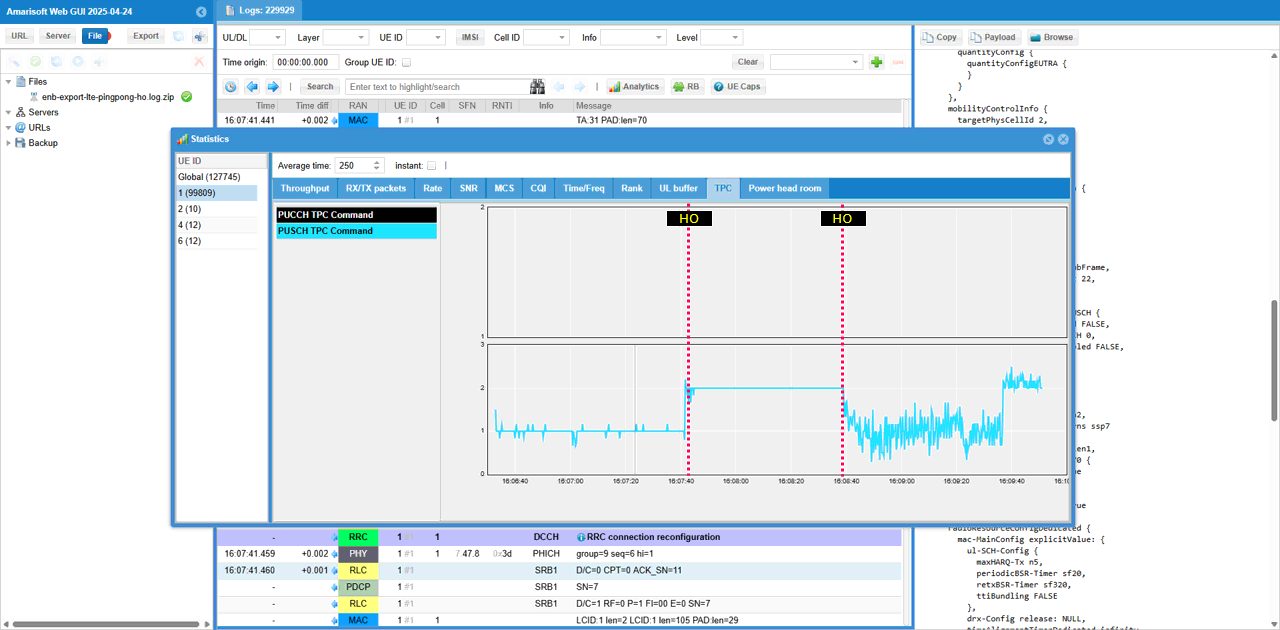
Check out TPC command plot. You see the drastic discontinuity at the point of handover.
The PUSCH TPC trace sits around 1 before the first handover and steps up to a flat 2 immediately after it. It stays there until the second handover and then goes noisy again.
A TPC of 2 held flat means the eNB is asking for more power at every opportunity. The UE has just moved to a cell it is still far from, so the power control loop is winding up rather than trimming.
PUCCH TPC Command is in the trace list as well, but its panel is empty over this window.
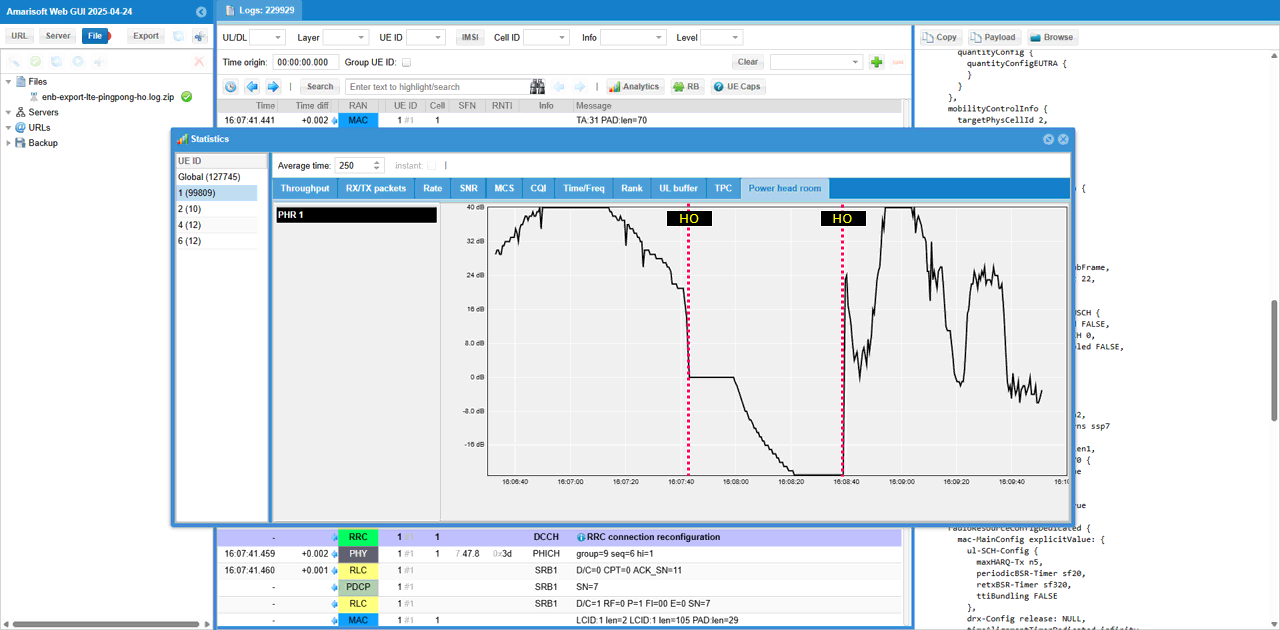
Check out Power headroom plot. You see the drastic discontinuity at the point of handover.
PHR starts near 40 dB and falls steadily to 0 dB by the first handover. It then flattens at 0 for a while before continuing down to about -16 dB, and jumps straight back to the top at the second handover.
The flat stretch at 0 is the UE at maximum transmit power with nothing left to report. Below that, the values are the shortfall between what the grant asked for and what the UE could actually send.
Test 4 : Triggering PingPong Handover by Channel Simulator - LTE/64 UE
In this test, we simulate a situation where a UE is moving away from the cell at a constant speed under simple pedesterial channel. In terms of protocol sequence and mechanism, this test is almost same as the previous test (Test 3). The difference is that the previous test is with only one UE whereas this test is with multiple UEs (64 UEs). This test can be a good reference test to check how a gNB can handle the overloaded handover process (i.e, triggering and processing the handover for many UEs in short time span).
Configuration
I have used gnb-sa-pingpong-ho-64ue.cfg that is copied and modified from gnb-sa.cfg. I will use the same file for all the test in this tutorial and just modify the parameters in the file without creating a new file.
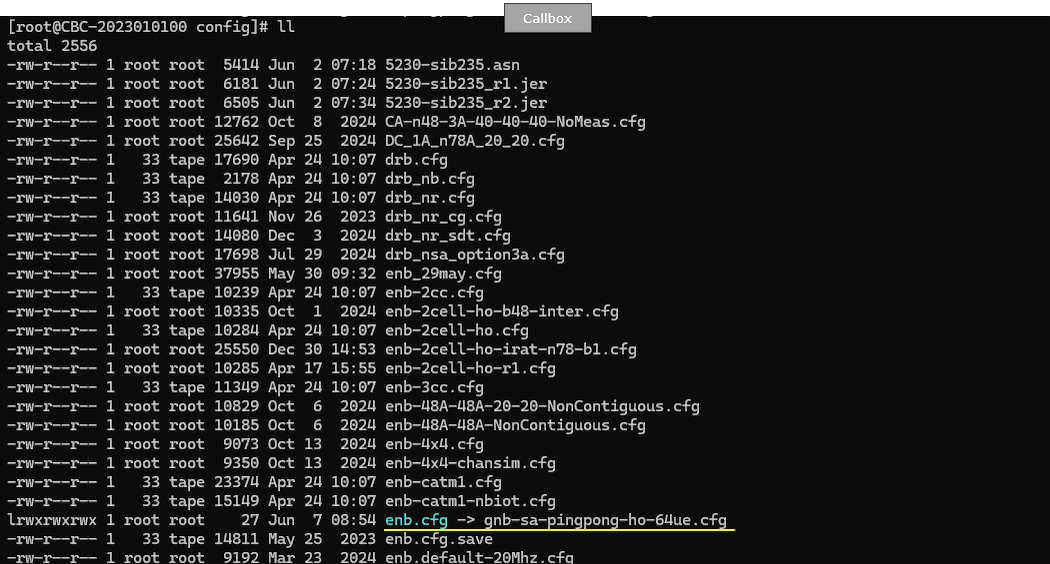
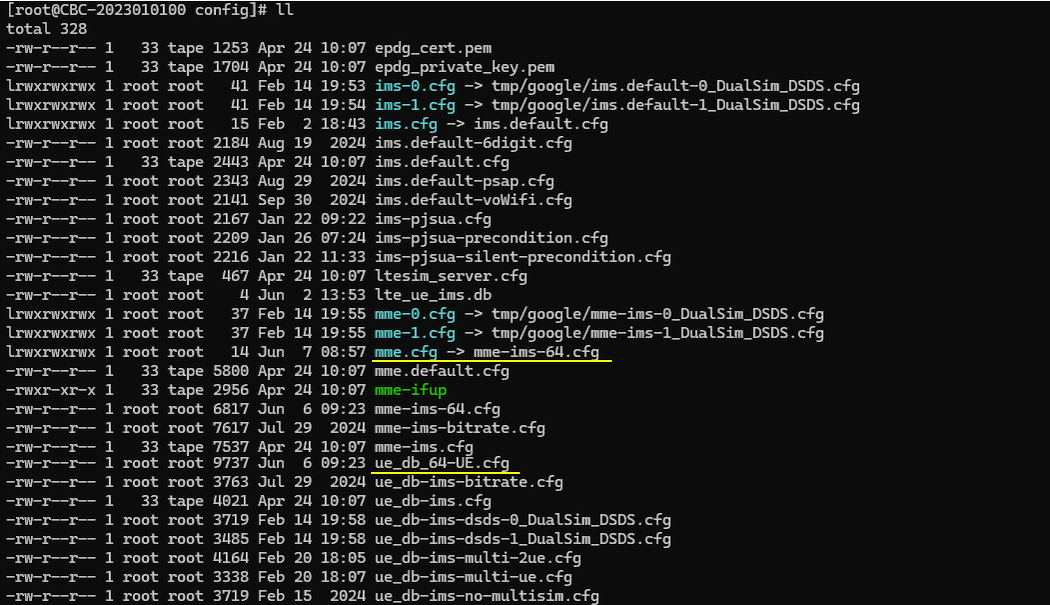
I am using the mme-ims-64.cfg as shown below. Within mme-ims-64.cfg, ue_db_64-UE.cfg is used (included)
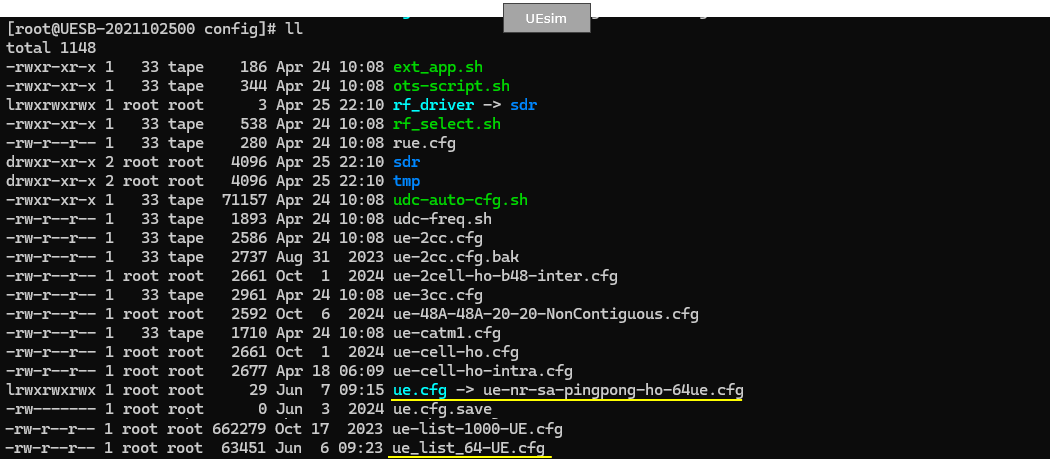
I used ue-nr-sa-pingpong-ho-64ue.cfg which is copied and modifed from ue-nr-sa.cfg on UEsim.
Following is the configuration on gNB.
In this test, we set the bandwidth of both cells to 100 Mhz. If you are using the callbox with sdr 50, I would suggest you to set narrower bandwidth (e.g, 20 or 40 Mhz) to avoid other complications (e.g, configuring rf_driver).
The rest of the block is the same as the earlier NR tests. NR_TDD is 1 with NR_TDD_CONFIG 2, N_ANTENNA_DL is 2 and N_ANTENNA_UL is 1, and USE_SRS is 0.
NR_BANDWIDTH applies to both cells, so lowering it lowers both. There is no per cell override in this file.

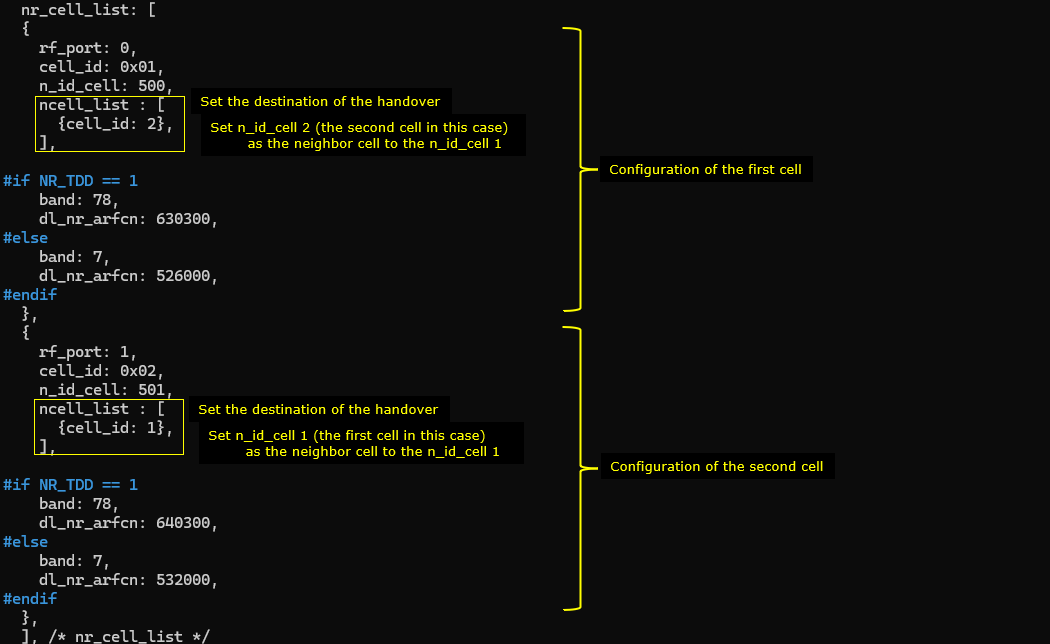
Now let's configure the two cells that will be involved in handover. Note that we configured the different frequency for the two cells. It means that we will perform inter frequency handover in this test.
As shown here, the second cell (cell_id 2) is set as the neighbour cell (ncell_list) of the first cell and the first cell (cell_id 1) is set as the neighbour cell (ncell_list) of the second cell
The first cell is on rf_port 0 with cell_id 0x01 and n_id_cell 500. The second is on rf_port 1 with cell_id 0x02 and n_id_cell 501, so each cell has its own SDR card.
Both are band 78 in the NR_TDD branch, at dl_nr_arfcn 630300 and 640300. The band 7 branch under each #else is the FDD alternative and is not used here.
The ncell_list entries are shorter than in the LTE case. Each carries only the cell_id of the other cell, and the gNB fills in the rest from that cell's own configuration.
With Amarisoft, you can do both blind handover and measurement based handover. In this test, we will do measurement based handover. In order to do measurement based handover, you need to configure appropriate measurement condition for the handover. We usually configure this in cell_default block.
nr_cell_default carries what the two cells share. subcarrier_spacing is 30 kHz in the TDD branch, and bandwidth and the antenna counts come from the defines above.
Setting these once here is why the two nr_cell_list entries only had to name a port, an identity and a frequency.

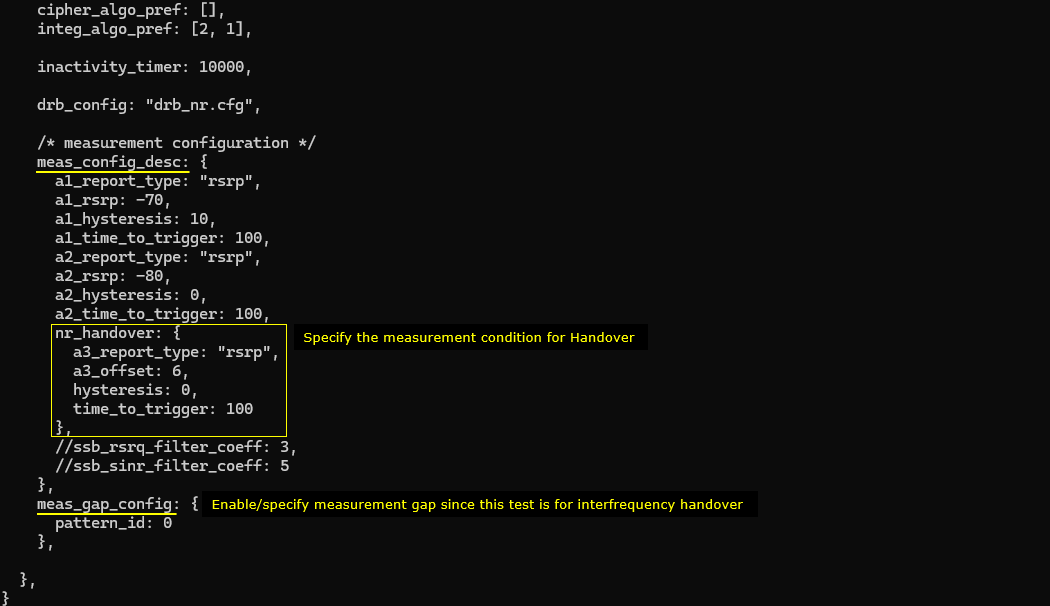
Configure measurement condition for source cell measurement and destination/handover measurement condition(a3 event in this case) as follows. In this test, we will do inter frequency handover, so we need to configure measurement gap (meas_gap_config) as well.
The thresholds are much tighter than in the single UE test. A2 fires at -80 dBm and A1 at -70 dBm, and every time_to_trigger is 100 ms rather than 480 or 640. With 64 UEs walking the same path you want the reports to come in quickly, otherwise the whole group drifts past the boundary before anything is triggered.
a1_hysteresis is 10 while a2_hysteresis is 0. The hysteresis on the recovery side is what keeps a UE sitting near -70 dBm from flapping.
nr_handover holds the A3 condition, with a3_offset 6 as before. meas_gap_config takes pattern_id 0 here rather than the gp0 name used on the LTE side.
inactivity_timer is 10000, which is long enough that no UE is released while it is walking.
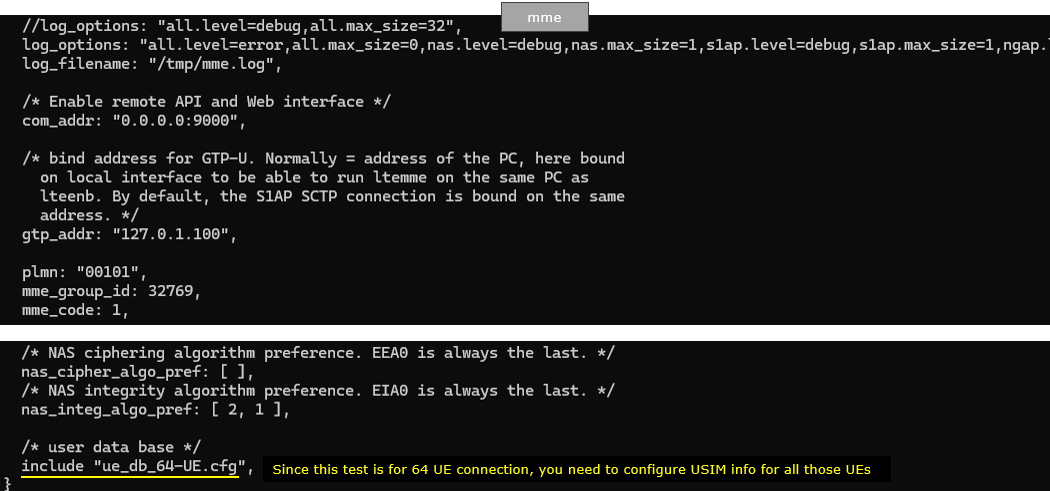
Since this test should handle multiple UE, you need to include ue data base carrying the USIM information of all the UEs (ue_db_64-UE.cfg)
The include sits at the end of the file, so the 64 subscriber entries stay apart from the MME settings. Point it at a different file and you change the subscriber set without touching anything else.
Above it, log_options is set to error for everything with nas and s1ap raised to debug. That keeps the log small while still showing the registration of each UE, which matters when 64 of them attach at once.
plmn is 00101, matching what the cells broadcast, and com_addr is 0.0.0.0:9000 for the remote API and the web interface.
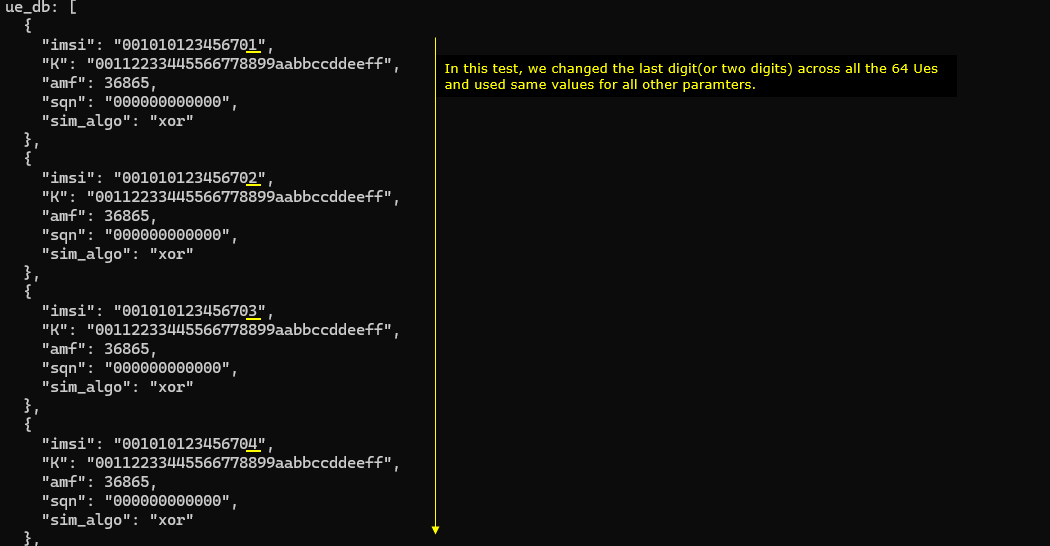
Within ue_db_64-UE.cfg , USIM information of all the UEs are defined as shown below (In this test, we will use the USIMs that differs only in terms of imsi and all other parameters are set to same value)
The imsi runs from 001010123456701 upward, one per entry, and only the last digits change. K, amf 36865 and sqn are identical across all 64.
sim_algo is xor. That is the cheapest of the authentication algorithms and it keeps the CPU cost down when 64 UEs authenticate at the same moment. Use milenage instead if you want the authentication itself to be realistic.
In ue-nr-sa-pingpong-ho-64ue.cfg , followings are configured. Since the main purpose of this test is to show how to simulate UE moving back and forth between two cells triggering pinpong handover. The UEsim configuration is the main part to be noted.
TDD is set to 1 (i.e, TDD) which is just to match the eNB configuration. Important to note is that CHANNEL_SIM is set to 1 which indicates the channel simulator will be used.
NR_BANDWIDTH is 100 here as well, matching the gNB. N_ANTENNA_DL is 2 and N_ANTENNA_UL is 1.
USE_UE_LIST_FILE is 0, and that is the define that makes this test work the way it does. With it at 0 the ready made ue_list file is skipped. The WebGUI generates the list of 64 UEs at run time instead.

Now in cell_groups, channel_sim is set true which enables channel simulation functionality.
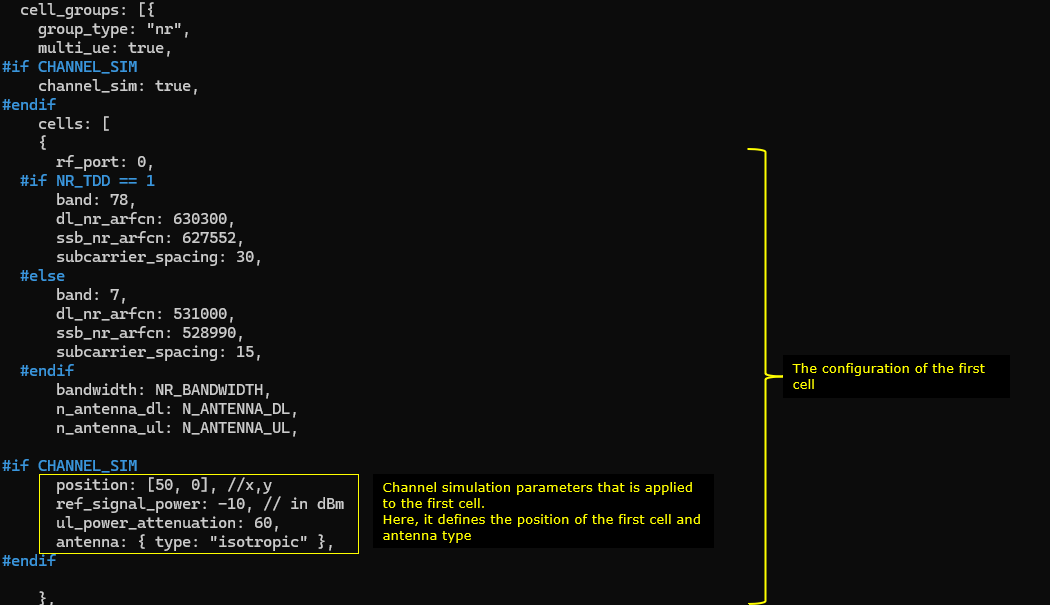
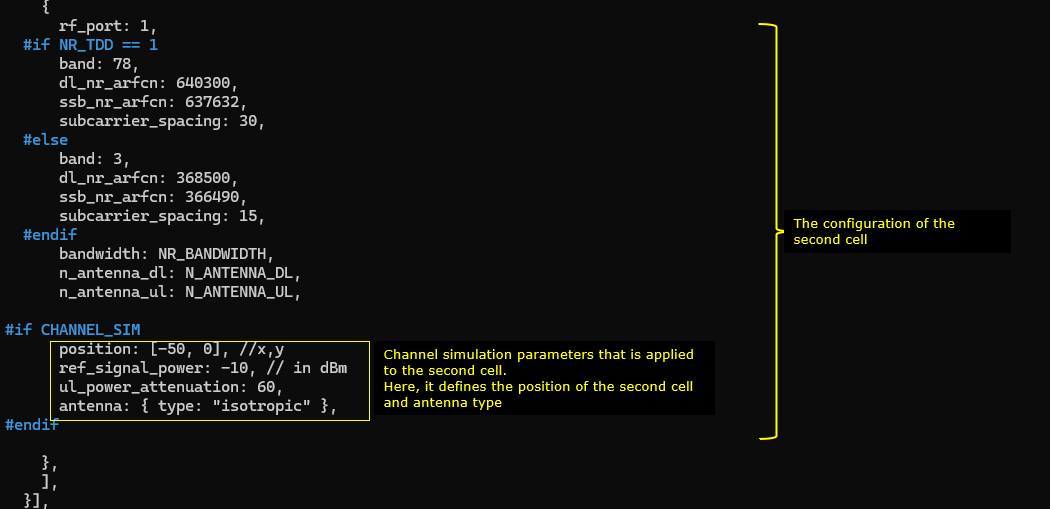
The position of the first cell is set to [50,0] and reference signal power(ref_signal_power), ul_power_attenuation and antenna type is configured for the simulated radio channel. In the same way, the simulated channel configuration for the second cell is set. The position of the cell is set to [-50,0] and all other configurations are same as the first cell.
The first cell is on rf_port 0 at dl_nr_arfcn 630300 with ssb_nr_arfcn 627552, matching the first gNB cell. The band 7 branch below it is the FDD alternative and is not used.
ref_signal_power is -10 dBm and ul_power_attenuation is 60, both different from the values used in the LTE test. These depend on the cell's actual broadcast power and on your own cabling, so do not carry them over from one test to another.
The channel simulator settings are wrapped in #if CHANNEL_SIM. Set that define to 0 and they disappear, so the same file can be run with the simulation turned off.
The second cell entry follows the same shape. It is on rf_port 1 at dl_nr_arfcn 640300 with ssb_nr_arfcn 637632, which is the second gNB cell.
position is [-50, 0], so the two cells are 100 m apart with the UEs starting between them. ref_signal_power and ul_power_attenuation are the same -10 and 60 as the first cell, and the antenna is isotropic again. Keeping the two identical apart from position is what makes the ping pong symmetric.
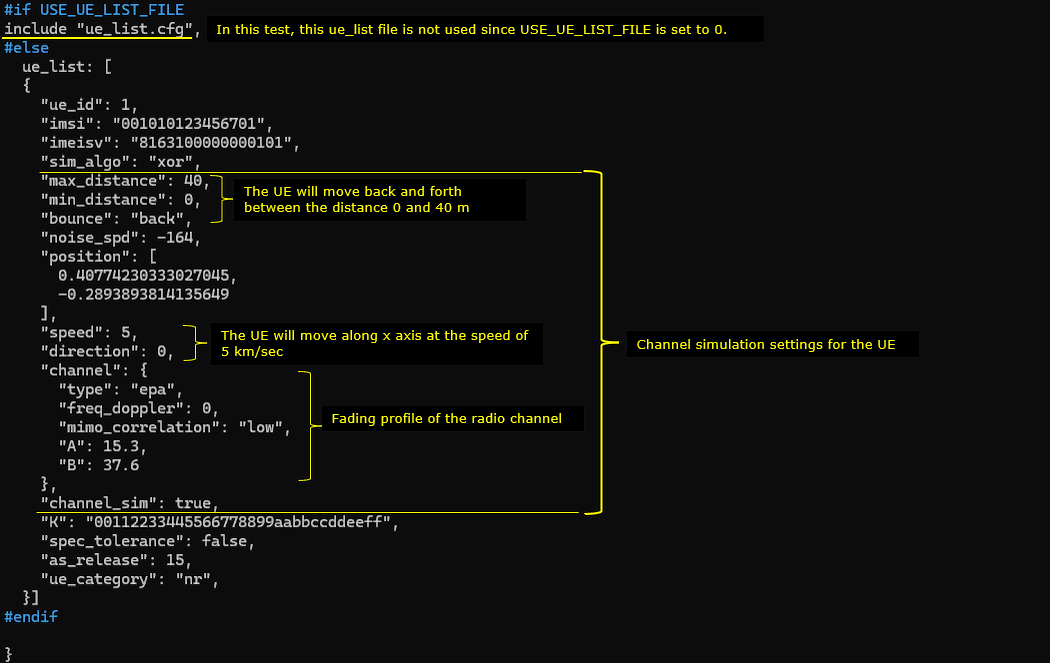
Following(ue_list) is the configuration that applies to a specific UE. Here you see the channel parameters that applies to the UE. First, UE is positioned at the [0,0] which is at the mid point between the two cells. It start moving towards the right cell (direction 0 meaning angle 0 degree). When it reaches the max_distance (in meters), it bounces back (turn 180 degree) and moves until it reaches min_distance (default 0). The moving speed is set to 5 km/h (speed: 5) in this test. The radio channel for this test is set to a 3GPP standard channel ("epa").
max_distance is 40 and min_distance is 0, with bounce set to back. The UE walks out to 40 m, turns, comes back to 0 and turns again.
noise_spd is -164, the same 10 dB above thermal as in the first test. A and B are 15.3 and 37.6, the defaults for the A + B * log10(d) pathloss model.
freq_doppler is 0 and mimo_correlation is low here, where the single UE test used high. A low correlation lets a UE hold rank 2 for longer, which is closer to what you want when you are loading the cell.
The whole ue_list sits inside the #else of USE_UE_LIST_FILE. With that define at 0 the ue_list.cfg include above it is skipped, and the WebGUI scenario supplies the 64 UEs at run time instead.
Perform the Test
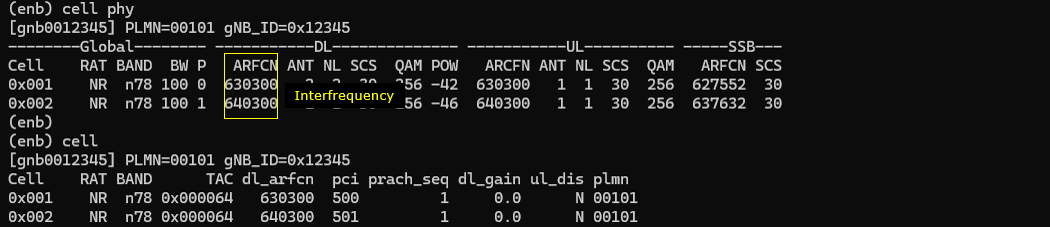
Now run the callbox and check out basic physical cell configuration. Note that two cells are configured for inter cellular frquency (
Both cells come up as n78 with BW 100. The first is on ARFCN 630300 with SSB at 627552, the second on 640300 with SSB at 637632. The P column reads 0 and 1, which is the rf_port each cell uses.
The pci values are 500 and 501, matching the n_id_cell you set, and both cells share TAC 0x000064. The uplink shows ANT 1 and NL 1 on both, so it stays single layer with 256QAM available.
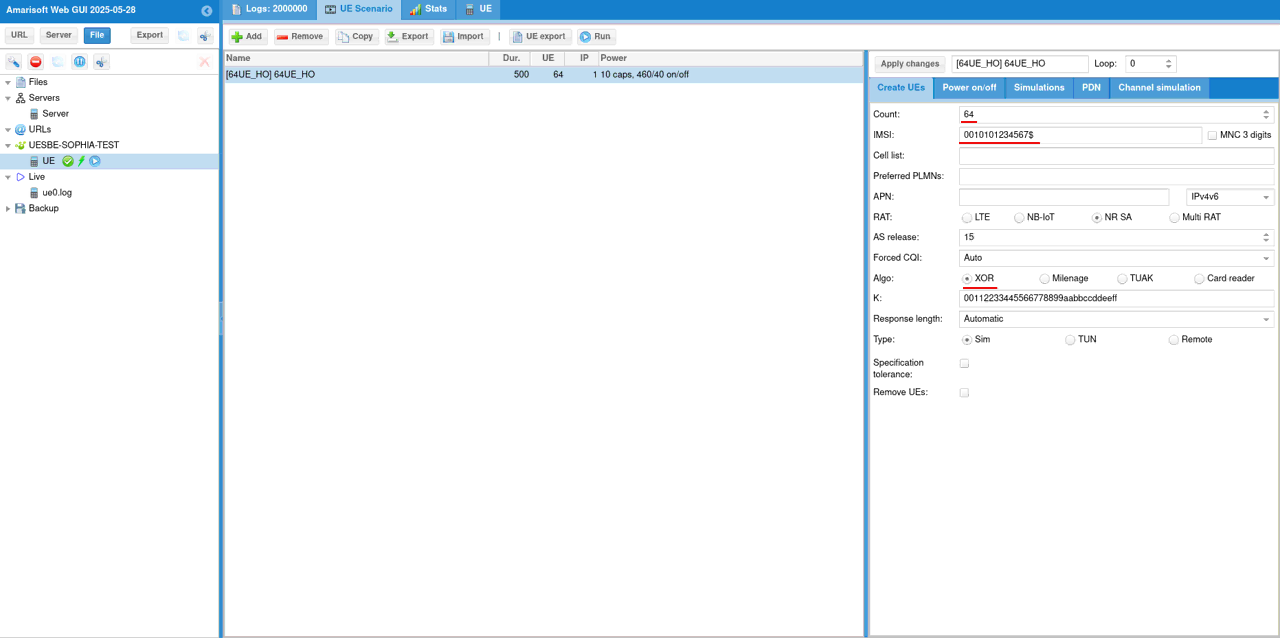
In this test, we used the UE scenarion function of UEsim WebGUI to generate USIM parameters automatically (
Count is 64 and the IMSI field ends in a dollar sign. That is the placeholder the WebGUI expands into a running number, so 0010101234567$ becomes the same 64 identities that ue_db_64-UE.cfg holds on the MME side. The two have to agree or the UEs will be rejected.
RAT is set to NR SA, AS release to 15 and Algo to XOR with the same K as the subscriber database. Type is Sim, so no TUN interface is created per UE.
The tabs across the top of the panel hold the rest of the scenario. Power on/off sets the attach pattern, and Channel simulation is where the movement settings live if you would rather set them here than in the configuration file.
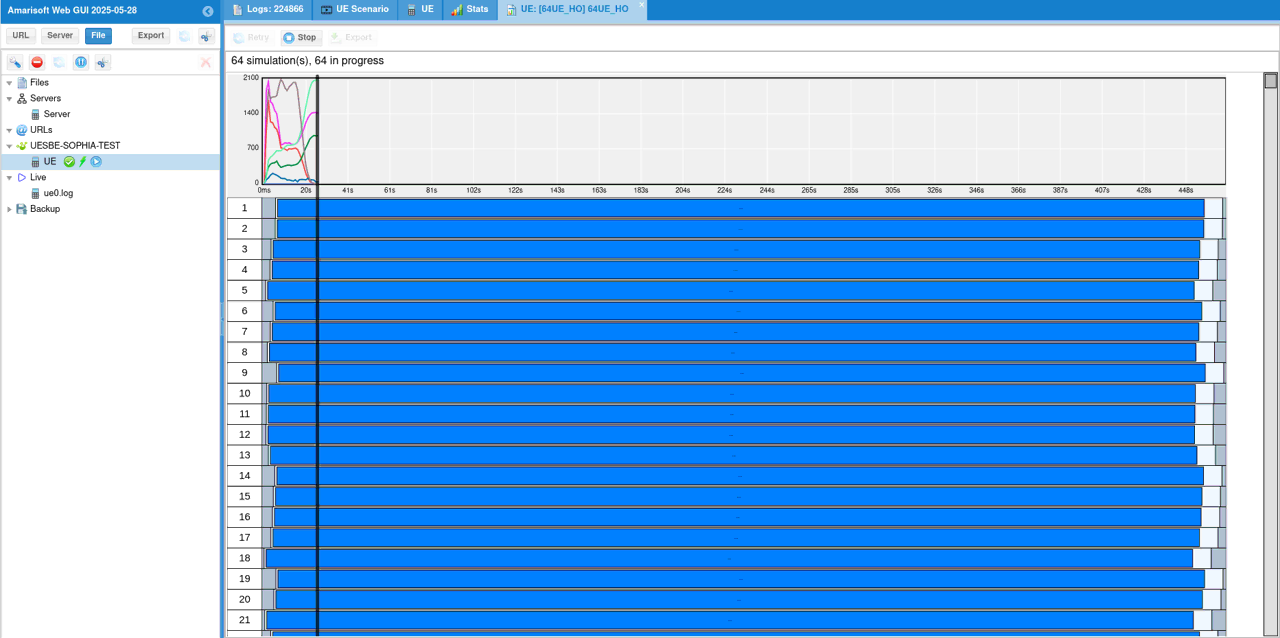
Then [Start] Scenario and you will see the registration process of all the UEs
The header reads 64 simulations with 64 in progress, and each row is one UE. The bars all start together a little after 20 seconds and run to the end of the 500 second duration.
A bar that stops short is a UE that dropped out. Watching this view is the quickest check that all 64 stayed attached for the whole run, before you go anywhere near the logs.
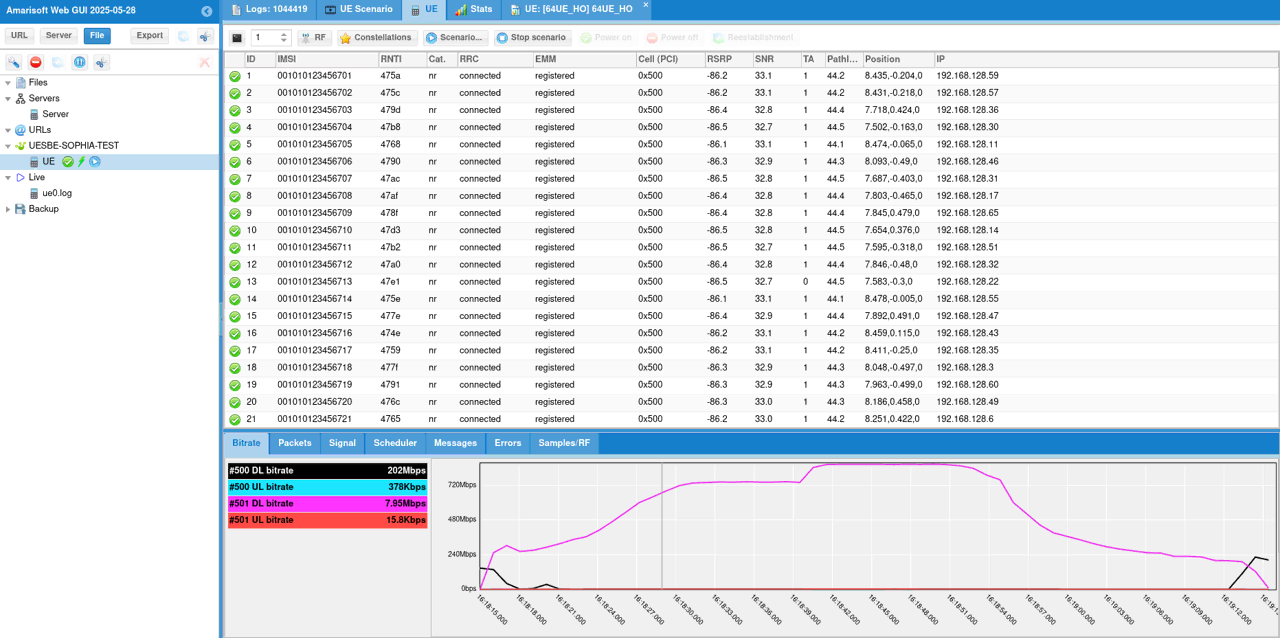
You can check some of high level KPIs (e.g, Bitrate, Packets, Signals etc)
Every row shows RRC connected and EMM registered, and the Cell (PCI) column reads 0x500 for all of them. At this moment the whole group is still on the first cell. RSRP sits around -86 dBm and pathloss around 44 dB for every UE, which is what you expect when they all start from the same place.
The Position column is the one worth watching. It is the simulated position of each UE, and it lets you confirm the movement is running without opening a log at all.
The Bitrate panel below splits by cell. Cell 500 is carrying 202 Mbps downlink while cell 501 has 7.95 Mbps, again because the UEs have not spread out yet.
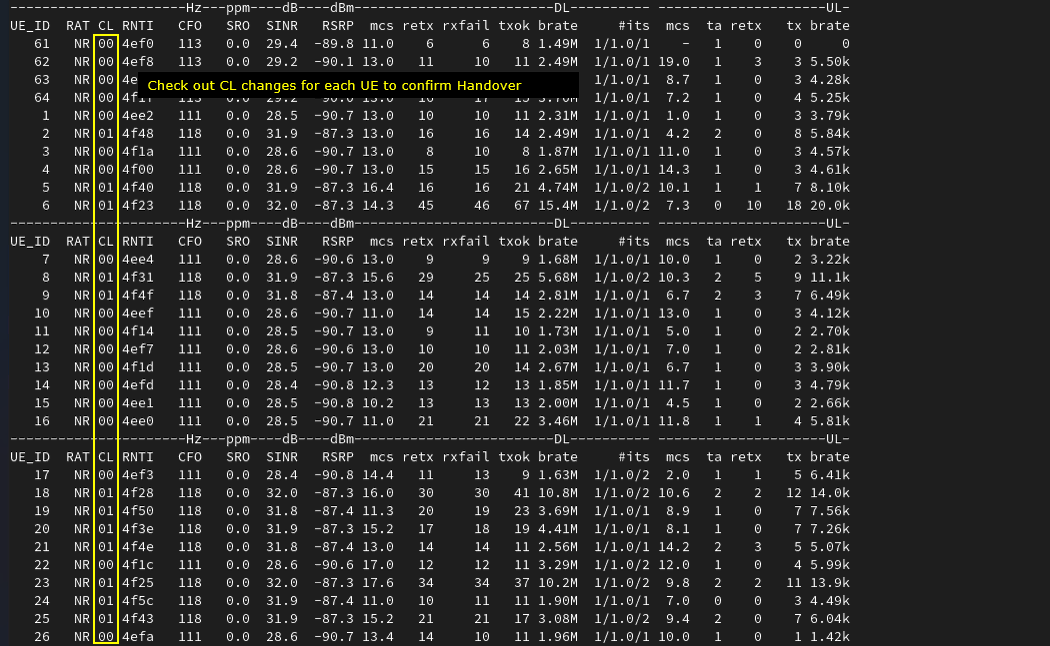
You can check out the high level status of each UEs with t command. Check out CL column value for each UE to check which cell a UE is connected to.
The CL column is split between 00 and 01 by this point, so the group is spread across both cells. Reading down that column tells you how the 64 UEs are divided at a glance.
RSRP falls into two groups, around -90.7 dBm for the UEs on 00 and around -87.3 dBm for those on 01. Every UE on the same cell reports almost the same value, because they are all walking the same path a short distance apart.
DL brate ranges from about 1.5 Mbps to 15 Mbps across the list. With 64 UEs sharing the cell the per UE rate depends on how the scheduler splits the slot, not only on the channel.
Log Analysis
You can check out if all the UEs completed registration. You may also the total amount of time for the registration completion of all 64 UEs.
The first RRC setup request lands at 16:17:15.898. From there the messages for different UEs are interleaved, which is why the UE ID column jumps between 1, 2 and 3 on consecutive rows.
Each UE follows the same sequence: setup request, setup, setup complete, security mode, capability exchange, then RRC reconfiguration. Filtering on a single UE ID is the only practical way to follow one of them through this.
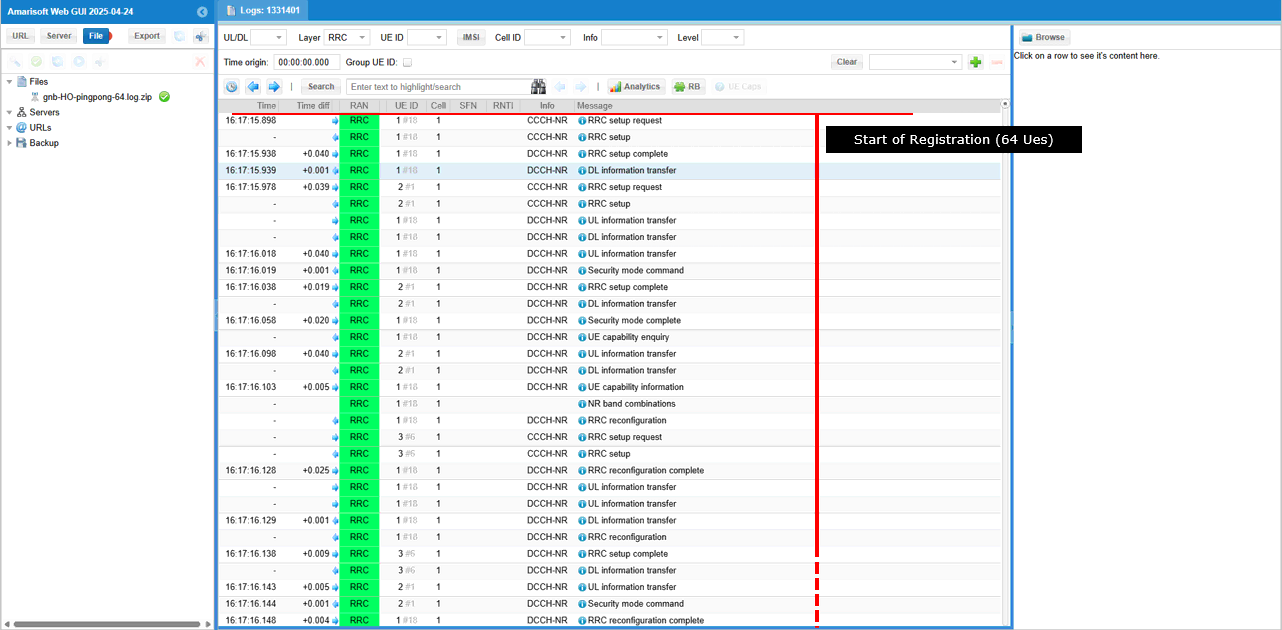
The last of the registrations completes just after 16:17:22.2. Taken against the 16:17:15.898 of the first setup request, that is about 6.5 seconds for all 64 UEs to attach.
That number is the one worth recording. Run the same scenario against a different gNB build or a larger UE count and this is the number that tells you whether the registration path is keeping up.
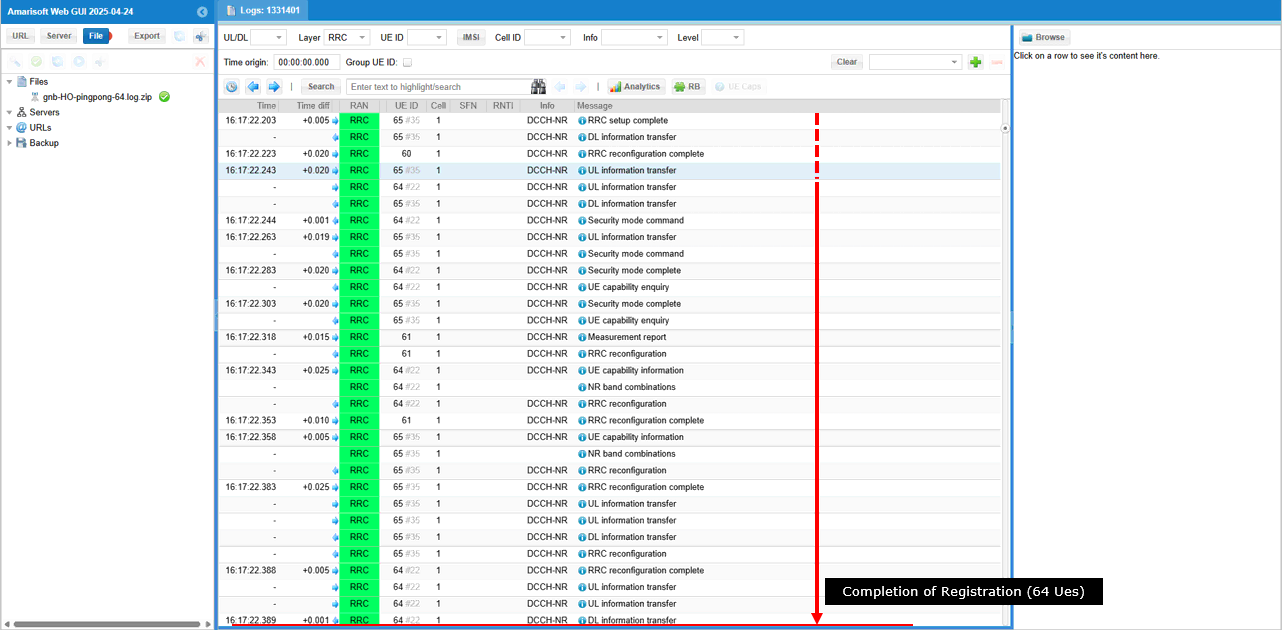
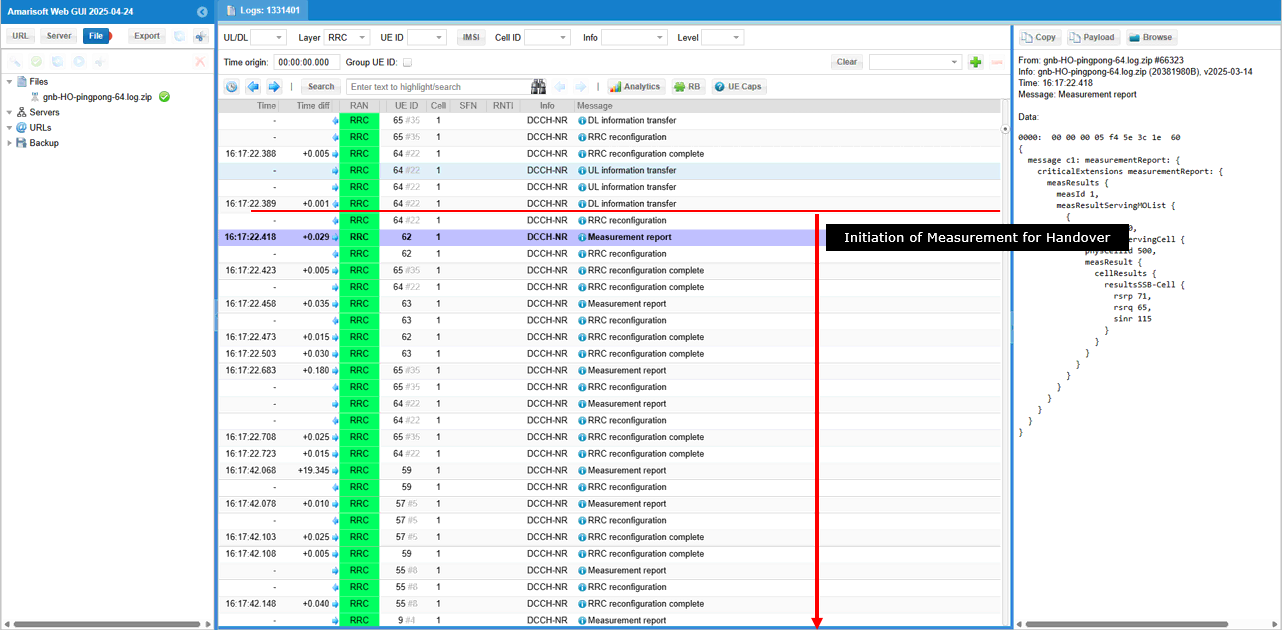
After the completion of the registration, gNB start the process of handover by sending measurement report configuration for each UEs.
The first measurement report arrives at 16:17:22.418, immediately after the last UE finished registering. measId is 1, which is the serving cell condition.
measResultServingCell names physCellId 500 with rsrp 71, rsrq 65 and sinr 115. There is no neighbour list, so this is a serving cell report and not yet a handover trigger.
From here the reports come from many UEs at once. The UE ID column changes on almost every row, and that is the load this test is meant to create.
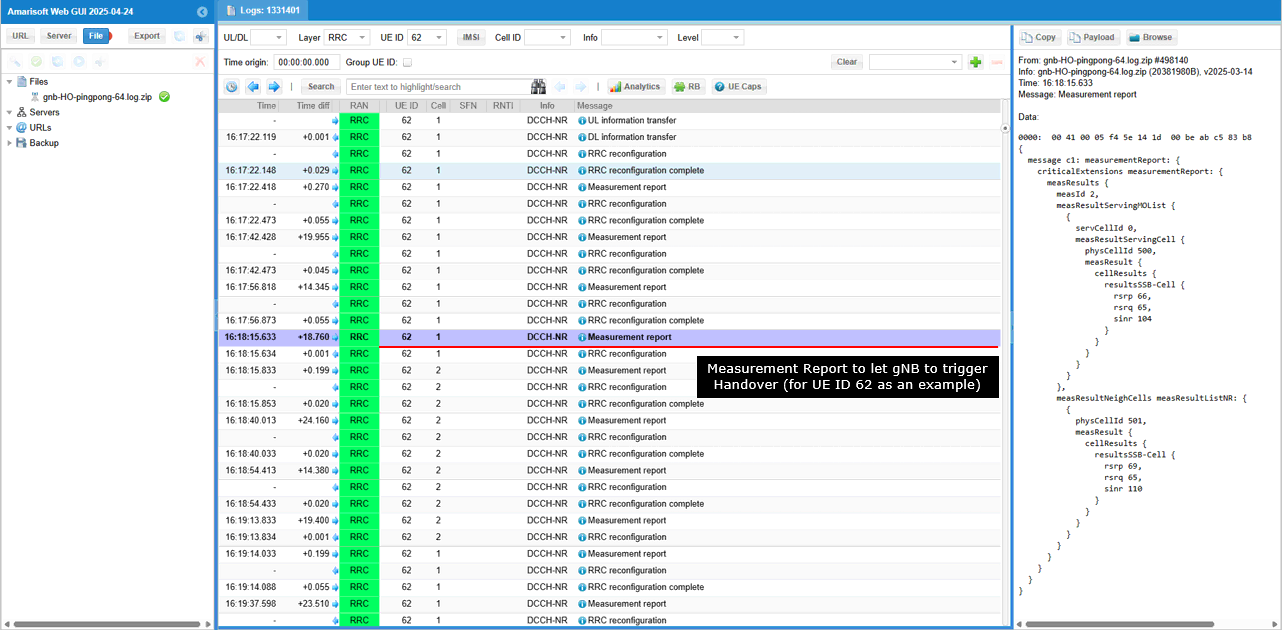
If a specific UE reaches a location where the channel condition(recieved cell power) mets the condition of the measurement configuration, it send measurement report required for the handover
The UE ID filter is set to 62, which cuts the log down to that one UE and makes the pattern visible. Its reports arrive every 14 to 24 seconds as it walks back and forth.
The report at 16:18:15.633 is the one that matters. measId is 2 and it carries a neighbour list for the first time. Serving cell 500 is at rsrp 66 while physCellId 501 is at 69, so the neighbour has become the stronger of the two.
Compare it against the earlier report from the same UE, where cell 500 was at rsrp 71 with no neighbour listed at all.
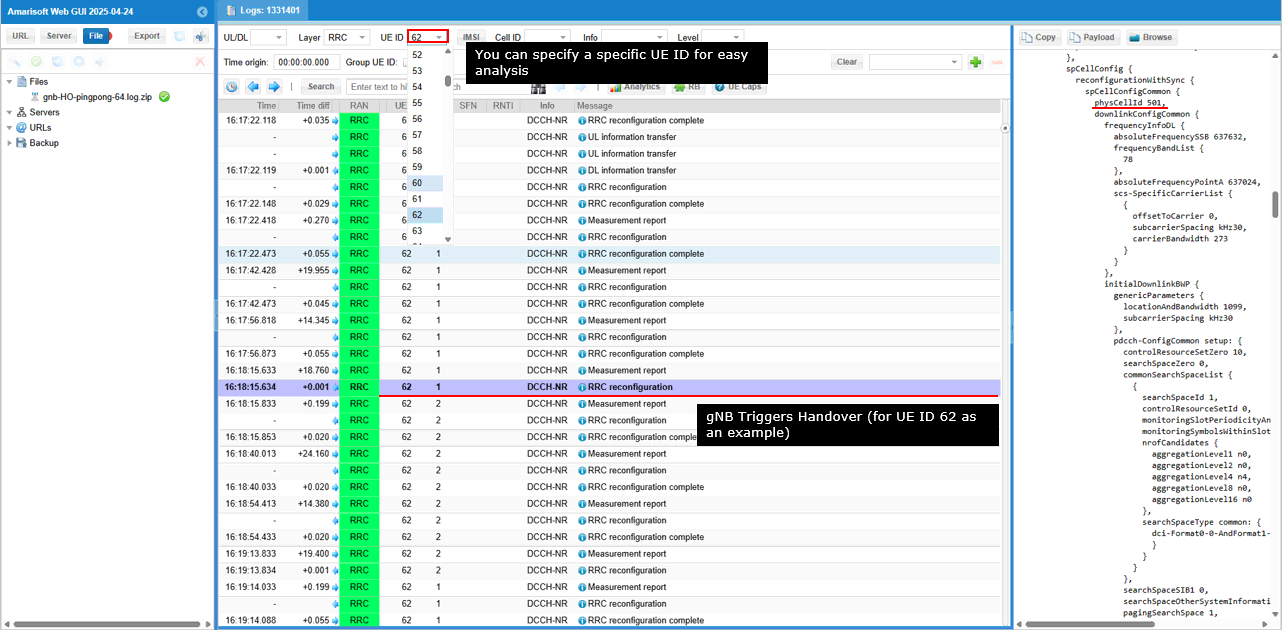
Once gNB recieves the measurement report that satisfy the handover condition, it triggers handover with RRC Reconfiguration carrying spCellConfig.reconfigrationwithSync.spCellConfigCommon.phyCellId <PCID of Destination Cell> (
The reconfiguration goes out 1 ms after the report, at 16:18:15.634. physCellId is 501, so the UE is being moved to the second cell.
absoluteFrequencySSB is 637632 and frequencyBandList is 78, which is the target cell as configured. carrierBandwidth is 273 resource blocks, the 100 MHz cell at 30 kHz spacing.
The Cell column in the log confirms it. Rows for UE 62 read cell 1 before this message and cell 2 after it.
For more intuitive analysis, let check out how some of KPI(e.g, throughput) and lower layer measurement changes during the UE movement and handover.
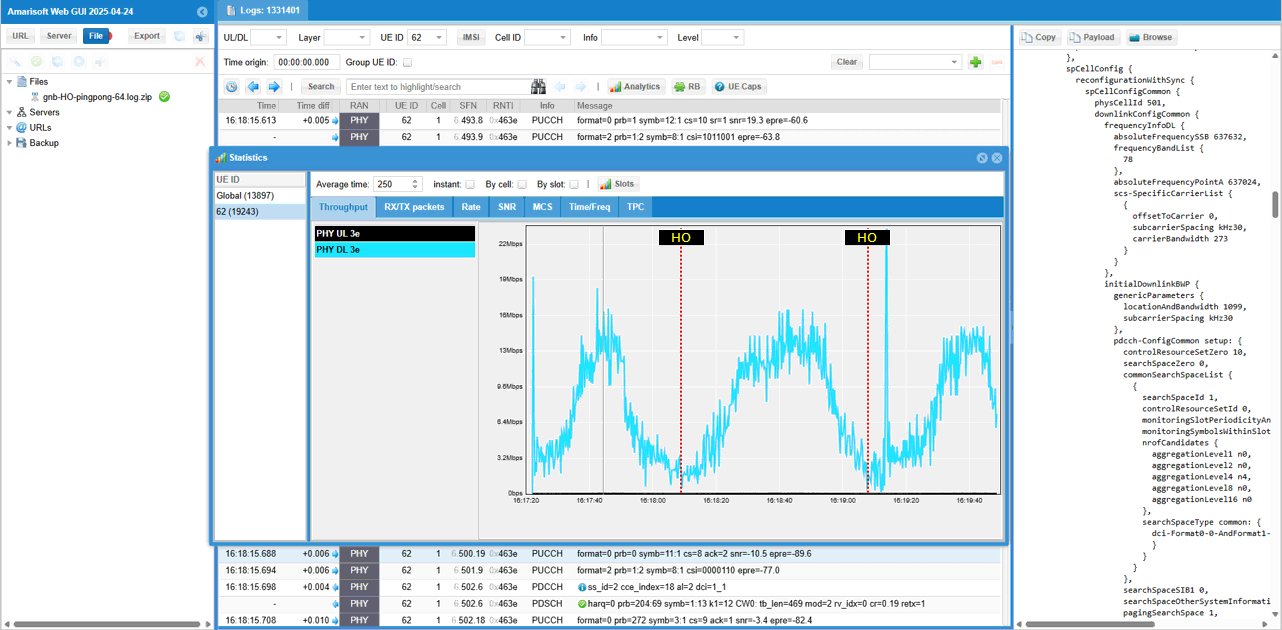
You see throughput goes down as UE moves away from the serving cell and reach the location where it switches the cell (handover)
The trace is PHY DL for UE 62 alone. It rises to about 19 Mbps as the UE approaches a cell and collapses to near zero at each HO marker.
The gap at the marker is the handover interruption itself. It is short, but with the averaging set to 250 ms it is still clearly visible.
PHY UL is enabled too, but its values are small on this scale, since the test only runs a downlink stream.
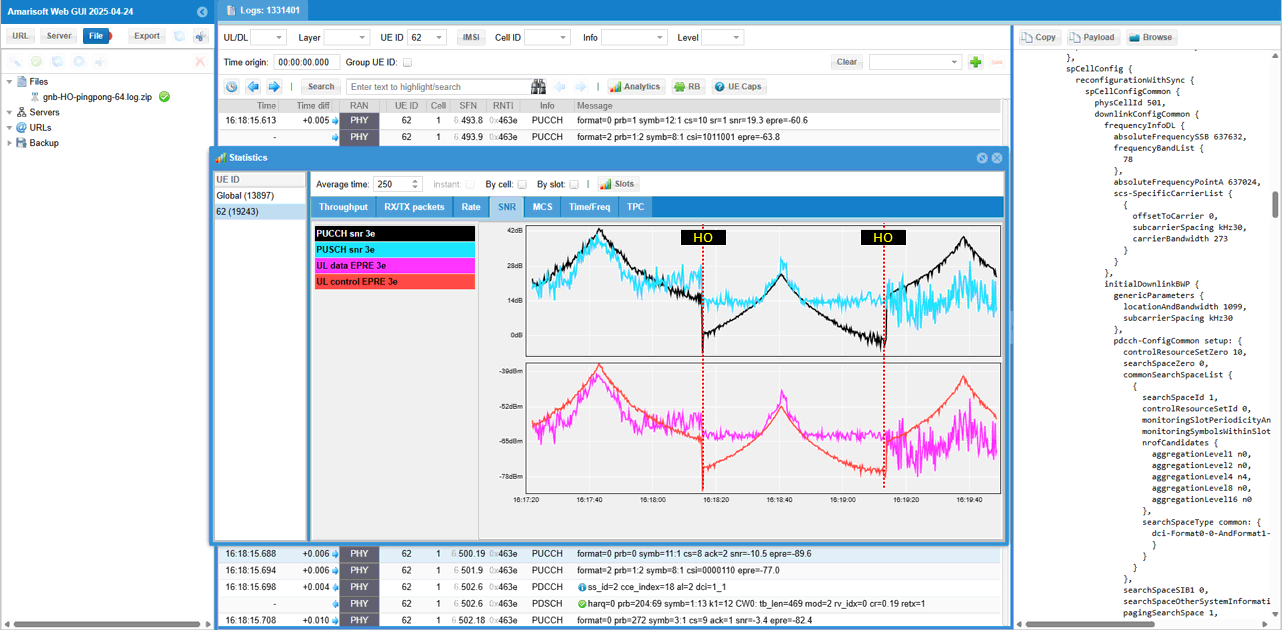
You see SNR goes down as UE moves away from the serving cell and reach the location where it switches the cell (handover). Depending on radio channel quality of each cells, you would see discontinuity of SNR between the cells.
Four traces are on, two SNR and two EPRE. The shape is a triangle wave. Each peak is the UE at its closest approach to a cell and each trough is the boundary where the handover happens.
SNR peaks a little above 40 dB and falls to around 5 dB at the marker, so there is about 35 dB of range across one leg of the walk. The EPRE panel below spans roughly -39 dBm to -78 dBm over the same legs.
The step across each marker is the discontinuity. The UE does not improve gradually after the handover. It jumps to the level of the new serving cell and starts falling again from there.
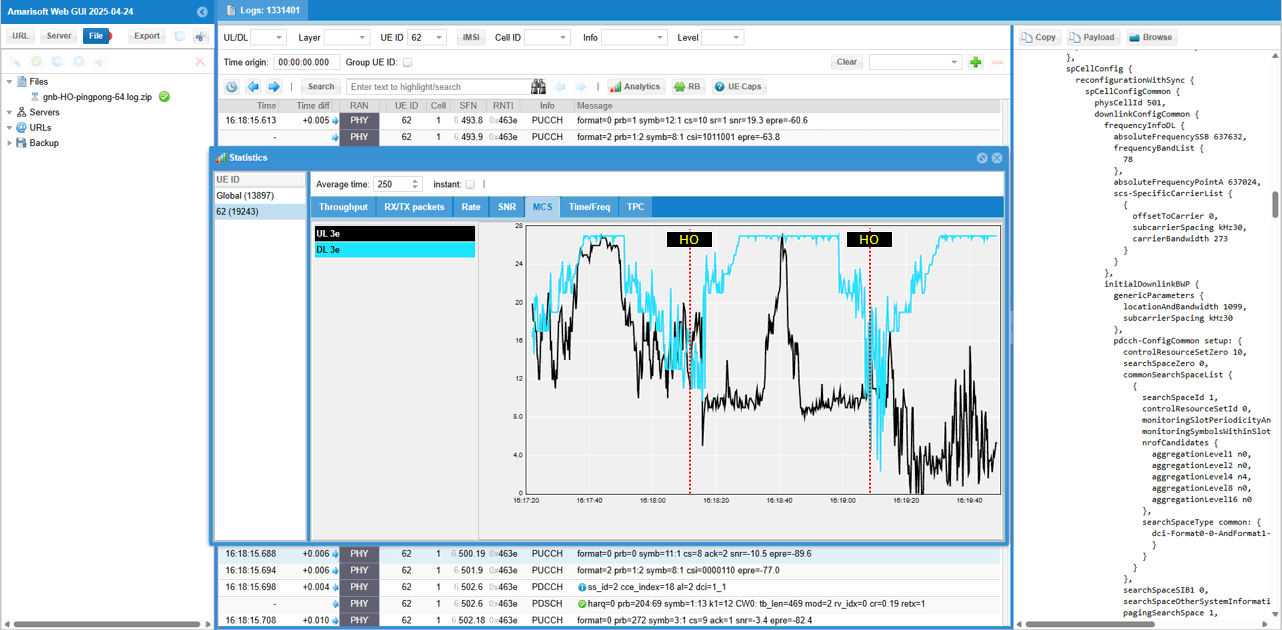
MCS change over the UE movement and handover is not that obvious, but still see some general tendency that MCS gets lower as UE move away from the cell and reach the cell boundary where handover happens
Both UL and DL traces are on and both run between about 4 and 28. The DL trace spends most of its time in the mid 20s and is the noisier of the two.
The UL trace is easier to read. It falls to around 4 just before each HO marker and recovers afterwards. With 64 UEs sharing the cell the scheduler is also reacting to load, so the MCS never traces the distance as cleanly as it did in the single UE test.
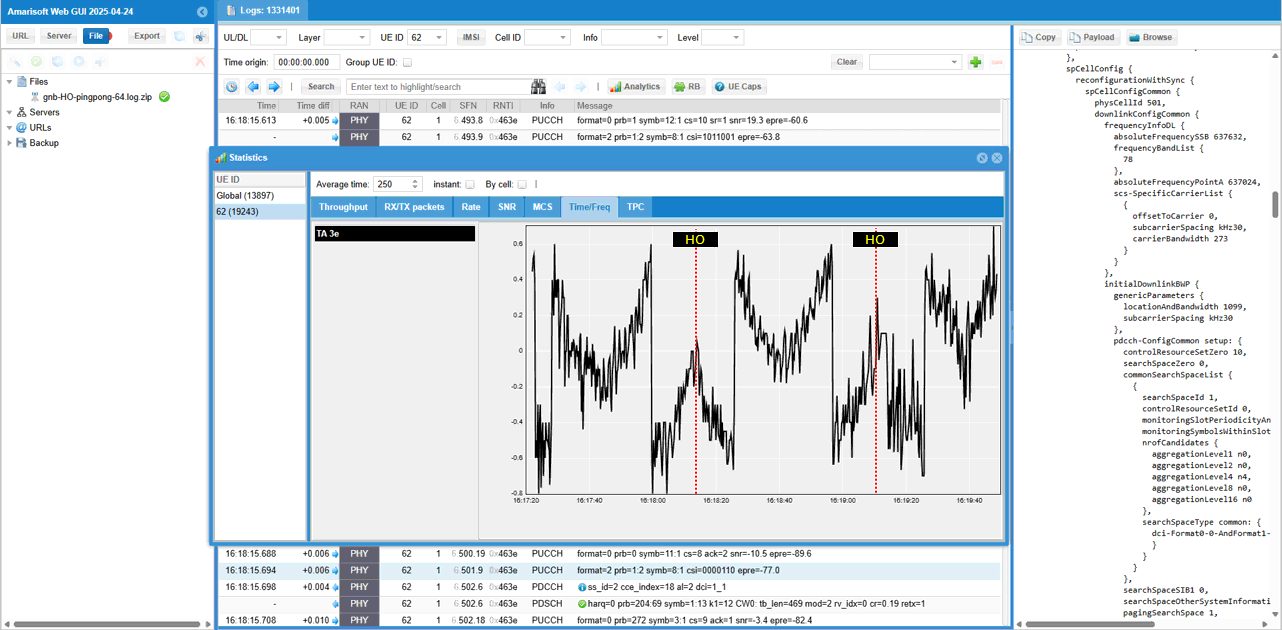
You can check out the TA (Timing Advance) changes while the UE moves back and forth between the two cells
TA ramps up steadily and then drops sharply at each HO marker, which gives the trace a sawtooth shape between about -0.8 and 0.6.
The ramp is the UE walking away from its serving cell. The drop is the serving cell changing, so the distance the timing advance has to compensate for changes in one step.
Now let's look into some aspects of KPI and other measurements for the consolidation of all 64 UEs.
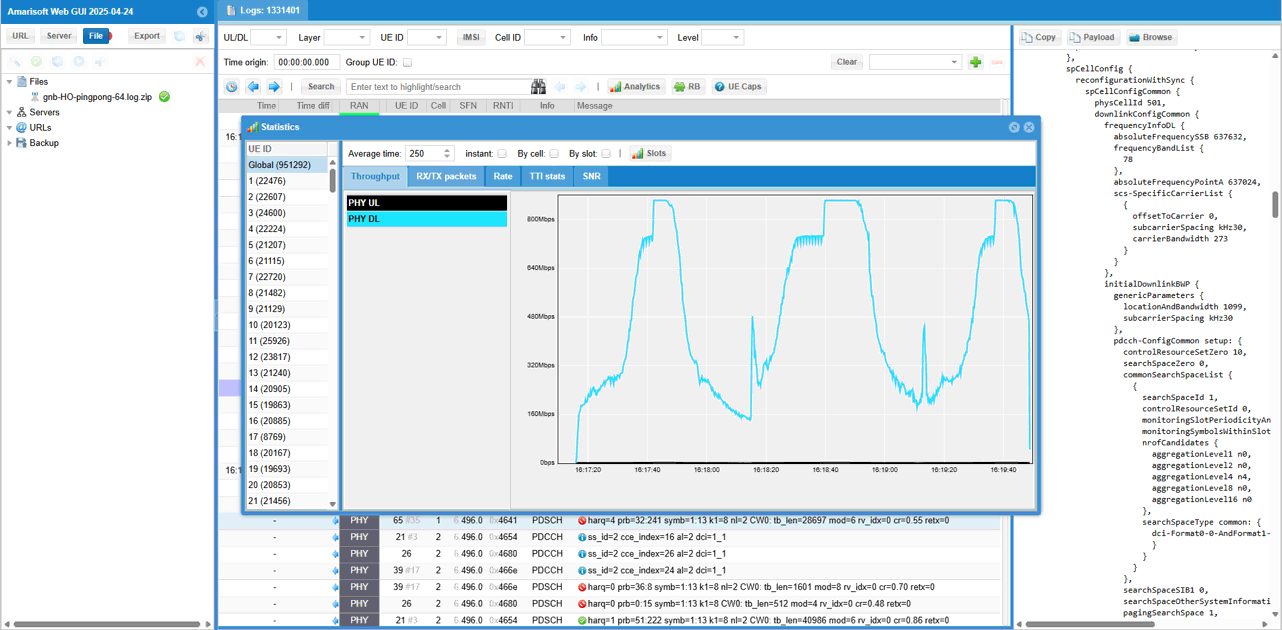
First check out the Throughput profile as all the UEs moves back and forth between the two cells undergoing handover.
Global is selected in the UE ID list rather than a single UE, so this is the sum across all 64.
The aggregate downlink climbs to a plateau a little above 800 Mbps and holds there while the group is near a cell. The two sharp dips, to about 480 Mbps and 330 Mbps, are the moments when the bulk of the group is handing over at once.
The dips are far shallower than the per UE trace was. The UEs do not all hand over on the same slot, so the ones still connected pick up the capacity the ones in transit are not using.
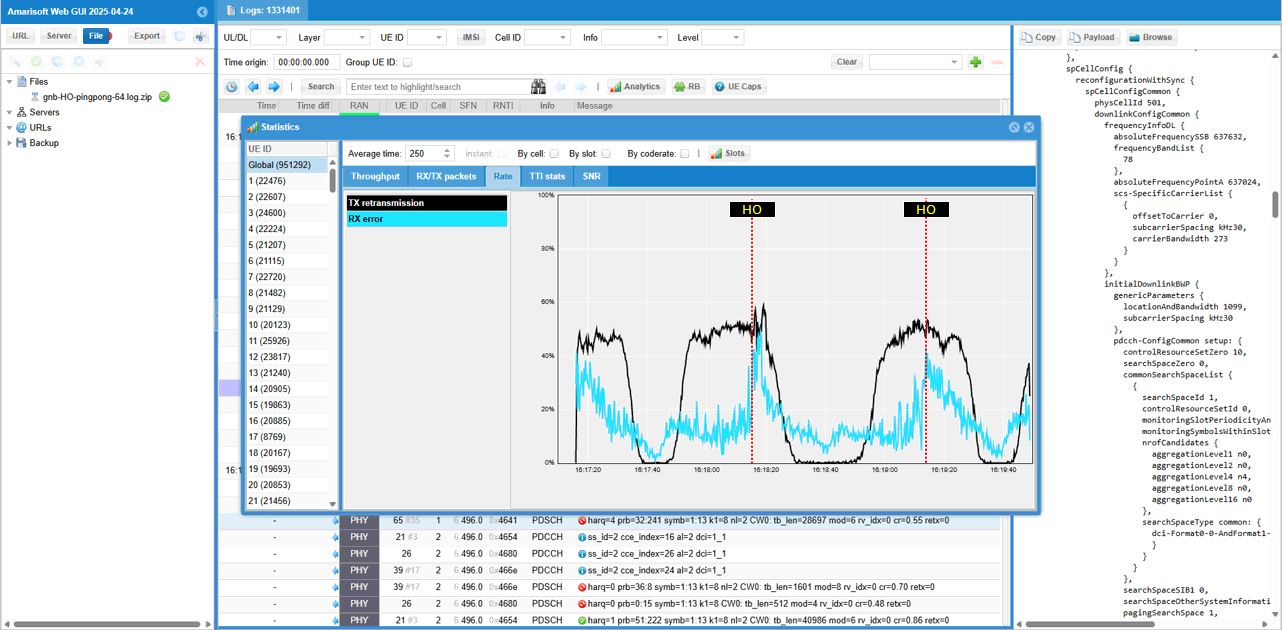
Then check out the Tx Error Rate (TX retransmission) and RX error. You see that both TX error and RX error reaches peak around handover point.
TX retransmission runs around 40 to 50 percent for most of the window and peaks near 60 percent at each HO marker. RX error is lower but follows the same shape, peaking around 40 percent.
Both fall almost to zero right after a marker. The group has just moved onto a cell it is close to, so for a while the channel is as good as it gets.
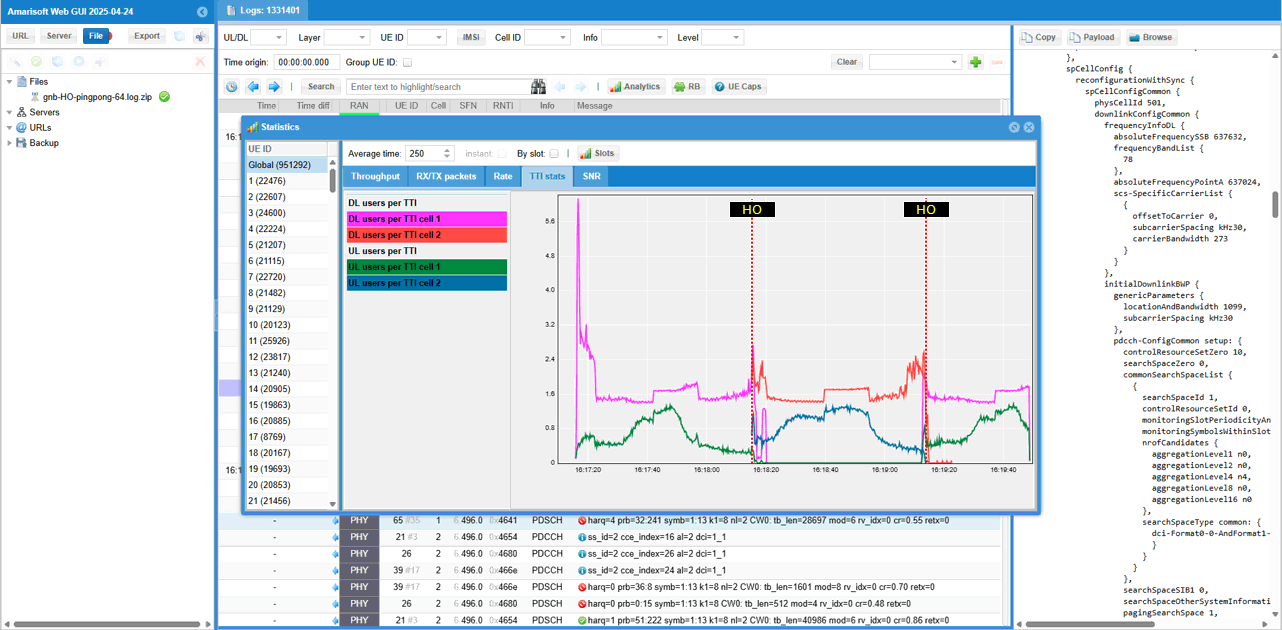
Now you can check out the number of UEs connected to each cell over time. This plot is a good indicator to verify on how well the handover of the multiple UEs went through.
The per cell traces are the ones to read. DL users per TTI cell 1 and cell 2 swap at each HO marker, one dropping to zero as the other takes over, and the UL pair does the same.
The swap is clean and it happens over a very short span, which is what you want to see. A staggered or partial swap would mean some UEs are not moving with the rest.
The values are users per TTI rather than an attached UE count, so they say how many of the 64 the scheduler served in each slot.
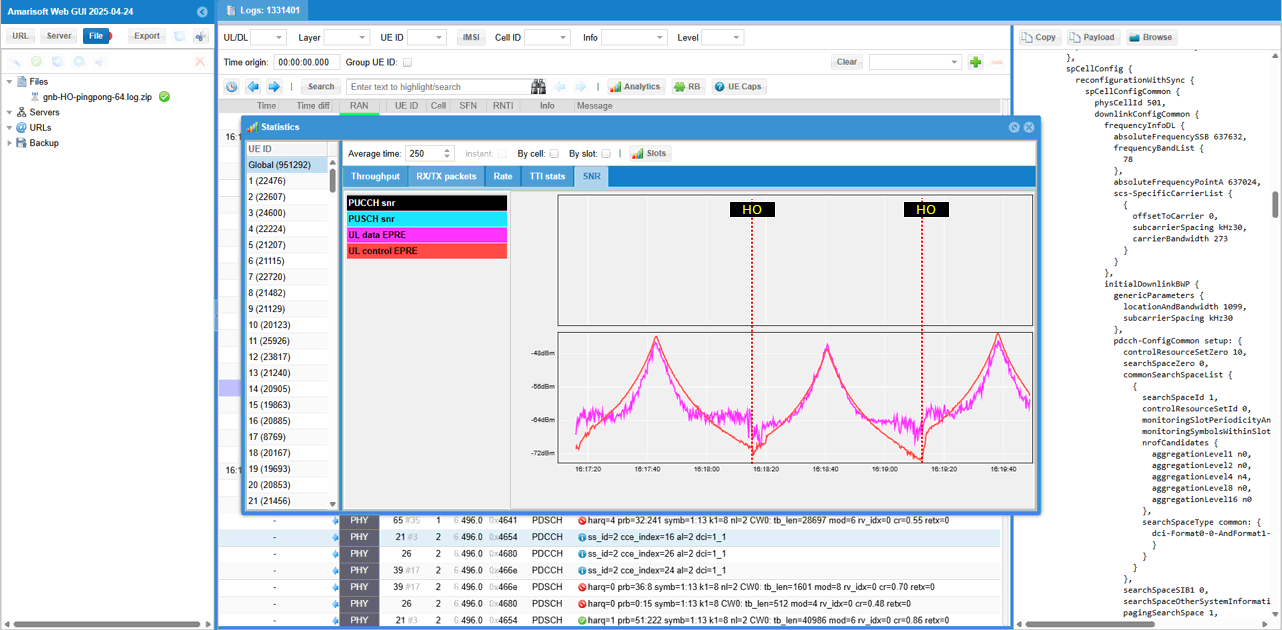
You can also check out SNR profile and notice the SNR shows distinctive pattern as UEs gets closer and farther away (to) from the connected cells.
Global is still selected, so this is the aggregate again. The upper SNR panel is empty over this window and the EPRE panel below carries the shape.
UL data EPRE and UL control EPRE track each other closely. Together they form the same triangle wave as the single UE trace. It runs from about -72 dBm at the boundary to around -40 dBm at the closest approach.
That the aggregate comes out this clean says the 64 UEs are moving together. Had they drifted apart, the peaks would have flattened out.
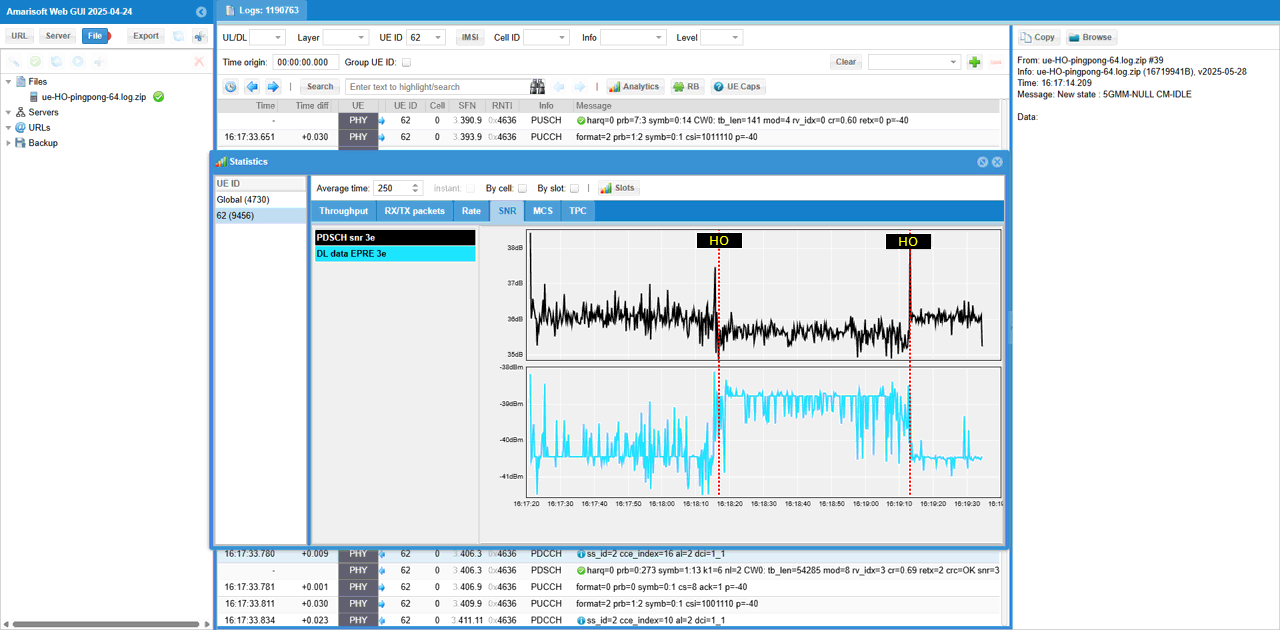
You can do similar analysis from UEsim log as well (
The traces here are PDSCH snr and DL data EPRE, so this is the downlink as the UE measured it. The gNB log gave the uplink as the gNB measured it.
PDSCH snr stays between about 35 and 38 dB across the whole window, and the DL data EPRE steps at each HO marker rather than sloping. Both are much flatter than their uplink counterparts.
The same tabs are available on this file, so any of the analysis above can be repeated here. That matters if you are testing your own gNB and have no comparable log on the network side.