RTT Analysis
This tutorial is for showing how to check / analyze various factors that may affect RTT and help with RTT optimization
- Ask yourself on why you want to minimize RTT (In many cases, you may not need to minimize it)
- Importance of RTT would vary depending on Application.
- In some cases, Jitter (variance of RTT) would be more important than RTT
- Except for Voice, realtime video RTT is not so important for most of application
In many case, RAN side portion would be relatively small out of the whole RTT (end-to-end RTT), but people want to minimize it just by tweaking RAN parameters
If you want to estimate / compare Core network impact on end-to-end RTT, RAN side RTT is not so important. What's important about RAN side impact on the end-to-end RTT is the exact range of RAN side delay and variation of the delay. If you know of the exact delay of RAN side delay, you can just substract the value from the end-to-end RTT to estimate the core network impact on end-to-end RTT
NOTE : For the technical tips of RTT improvement with Amarisoft solution, refer to this wiki.
Table of Contents
Introduction
Round Trip Time (RTT) is a critical performance metric in modern communication networks, representing the elapsed time for a signal to travel from a source to a destination and back again. In cellular systems—such as LTE, 5G NR, and beyond—RTT is influenced by multiple architectural layers including the Radio Access Network (RAN), core network, and external data networks. RTT has far-reaching implications for user experience, service latency, and the efficiency of protocols such as TCP, particularly in latency-sensitive applications like VoIP, online gaming, and real-time video streaming. Understanding RTT entails dissecting the contributing delays at each segment of the network: radio interface transmission, scheduling, processing times, queuing in the core network, and external routing. This tutorial provides an in-depth exploration of the factors affecting RTT, focusing on methods for its measurement, analysis, and optimization. By examining architectural considerations, key concepts such as jitter (RTT variance), and the contextual importance of RTT for diverse applications, learners will gain a comprehensive foundation for diagnosing and improving latency performance in end-to-end network scenarios. The tutorial also discusses the relative impact of RAN versus core network delays, best practices for RTT optimization, and tools for precise delay analysis, equipping technical professionals with actionable insights to enhance network responsiveness and service quality.
-
Context and Scope
- This tutorial addresses RTT analysis and optimization in cellular and IP-based communication networks.
- Emphasis is placed on both RAN and core network segments, providing a high-level architectural overview.
- Key technical concepts such as delay sources, jitter, and their impact on application performance are discussed.
-
Relevance and Importance
- RTT directly affects end-user experience in many real-time and interactive applications.
- Understanding RTT is vital for diagnosing network bottlenecks and supporting service level agreements (SLAs).
- Optimization of RTT can contribute to better throughput, lower application latency, and improved reliability.
-
Learning Outcomes
- Ability to identify and analyze factors contributing to RTT across network segments.
- Knowledge of measurement methodologies and interpretation of RTT data.
- Skills to distinguish between RAN and core network impacts on RTT and actionable methods for optimization.
- Understanding of application-specific RTT requirements and the trade-offs between RTT and jitter.
-
Prerequisite Knowledge and Skills
- Familiarity with basic networking concepts such as latency, throughput, and protocol stack layers.
- Understanding of cellular network architecture (e.g., RAN, core network, user plane, control plane) is helpful.
- Some experience with network measurement tools or protocol analyzers is recommended for hands-on analysis.
Summary of the Tutorial
This tutorial presents a series of test procedures and methodologies for analyzing Round-Trip Time (RTT) and connectivity across WiFi, LTE, and NR/SA (5G Standalone) environments using a Callbox and various Device Under Test (DUT) configurations. The focus is on preparation, connectivity verification, logging configuration, and execution of ping-based RTT tests.
-
Test Setup and Preparation
- Use the provided SIM card for DUTs unless reconfiguration is needed (refer to the Configuration Guide for changes).
- Callbox and DUTs are placed in separate rooms, 3 meters apart, separated by a wall to challenge wireless connectivity.
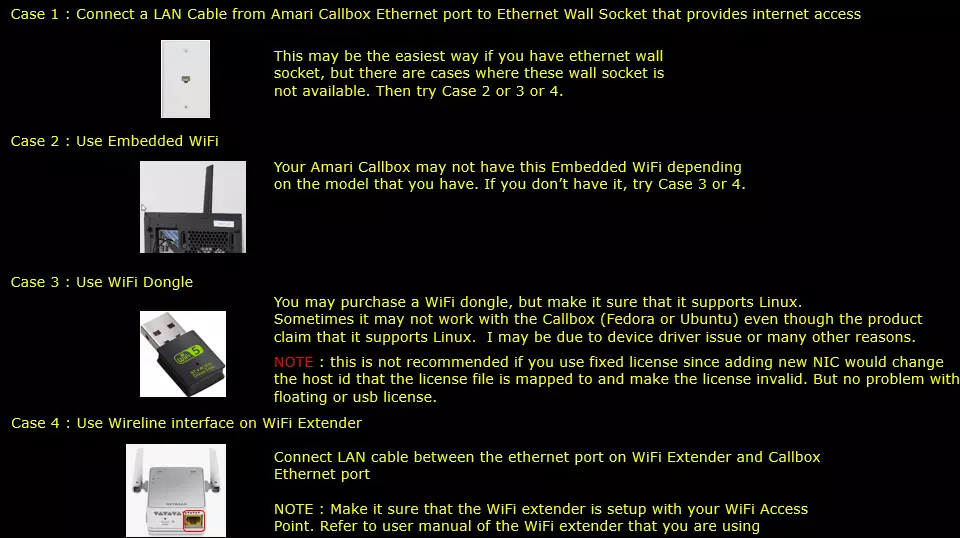
- Various internet access methods for the Callbox are illustrated; Case 4 is used in this tutorial. For WiFi-based access (Cases 2 & 3), a set of nmcli Linux commands is provided for configuring WiFi connectivity from the command line.
- Before UE connection tests, ensure all network interfaces (including tun0, tun1, tun2, tun3) are up, and verify routing tables and internet connectivity (e.g., ping 8.8.8.8 for DNS, ping a URL for DNS resolution).
-
Logging Configuration
- ENB and MME logging properties are adjusted to increase maximum log size, ensuring that the full IP header is captured for detailed packet analysis.
-
Test 1: WiFi Reference Test
- This baseline test uses a WiFi network and PCs only, with no cellular protocol or mobile phone involved.
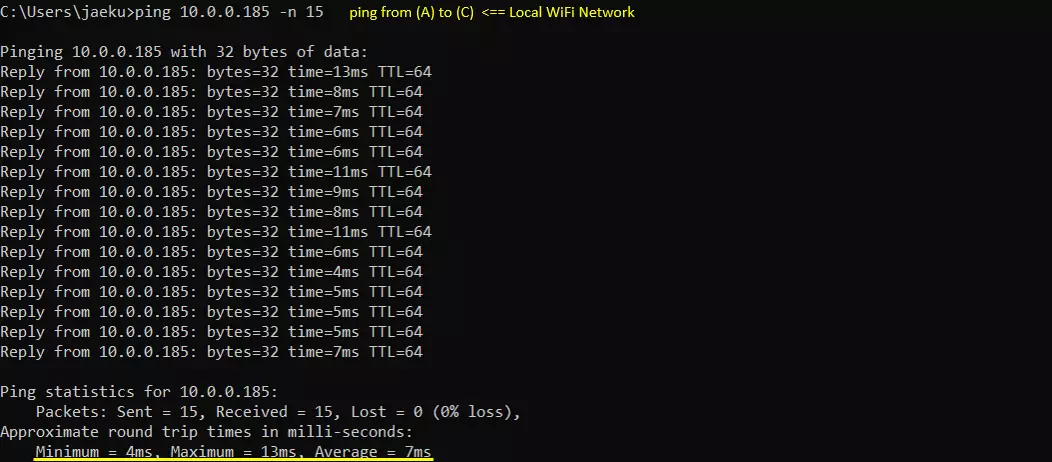
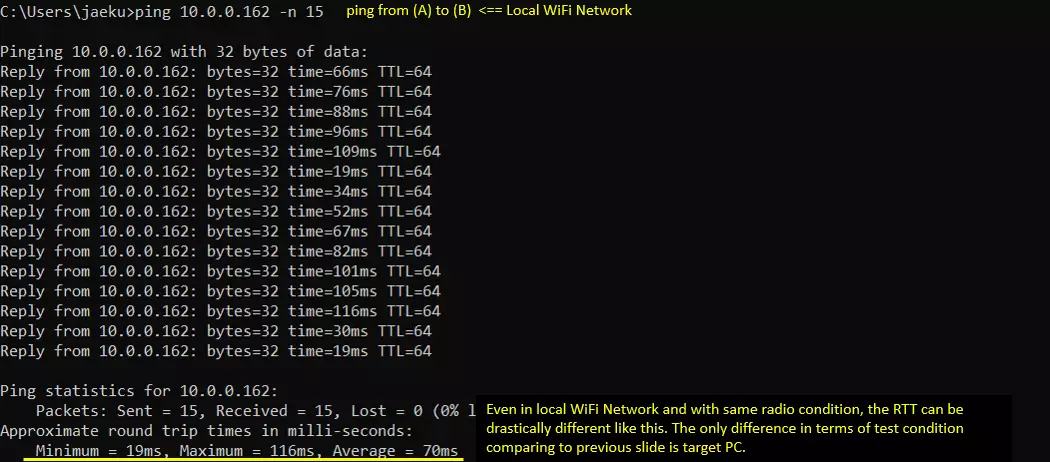
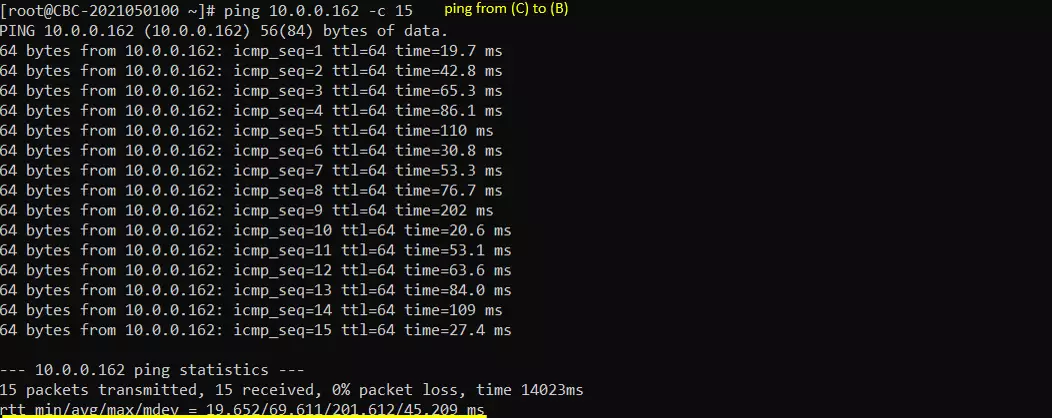
- Ping tests are performed between multiple points within the local WiFi network:
- Ping from Point (A) to Point (C)
- Ping from Point (A) to Point (B)
- Ping from Point (C) to Point (B)
- External connectivity and RTT are evaluated by pinging:
- Google DNS (to measure RTT from Callbox to US)
- A PC in France
- A PC in Korea
-
Test 2: LTE Ping Test
- Test is performed using enb.cfg with LTE and 5 MHz bandwidth.
- Ping packets (ICMP) are observed at the GTP-U layer in logs for higher-layer analysis.
- Exact PHY-layer transmission and reception times for ICMP packets are determined by inspecting PHY frame logs (requires large ENB log size).
- By comparing PHY frame timestamps for Echo Request and Echo Reply, and assuming negligible MAC~PDCP processing time, the RAN-induced delay can be isolated.
- End-to-end delay is also measured from the application layer using a speed test tool (preferably one that measures both delay and jitter).
- Comparing application-layer and RAN delays allows breakdown of total delay into RAN delay and Core/Internet delay.
-
Test 3: NR/SA (5G Standalone) Ping Test
- Test utilizes gnb-sa.cfg with CONFIG = 2; RTT may vary based on TDD UL/DL configuration pattern.
- Ping packet observation and timing analysis mirrors the LTE test:
- GTP-U layer logs for higher-layer packet visibility
- PHY frame inspection for transmission and reception timing
- Calculation of RAN delay using PHY frame timestamps
- Application-layer end-to-end delay is evaluated using a suitable speed test tool.
- Comparison of RAN and application-layer delays provides a breakdown of total delay across network segments.
The procedures emphasize step-by-step network setup, verification, and careful logging, followed by methodical ping-based RTT measurements in reference (WiFi) and cellular (LTE, NR/SA) scenarios. Analysis at multiple protocol layers enables comprehensive delay characterization.
Test Setup
Test setup for this tutorial is as shown below.
- SIM Card used in this tutorial is the one delivered with the system as it is.
- If you want to change the configuration, The tutorial Configuration Guide would help
Following shows the location of the Callbox and the DUTs. Callbox and DUTs are in different rooms separated by a wall at a distance of about 3 m. (NOTE : Usually other test equipment does not provide stable connectivity in this kind of situation)
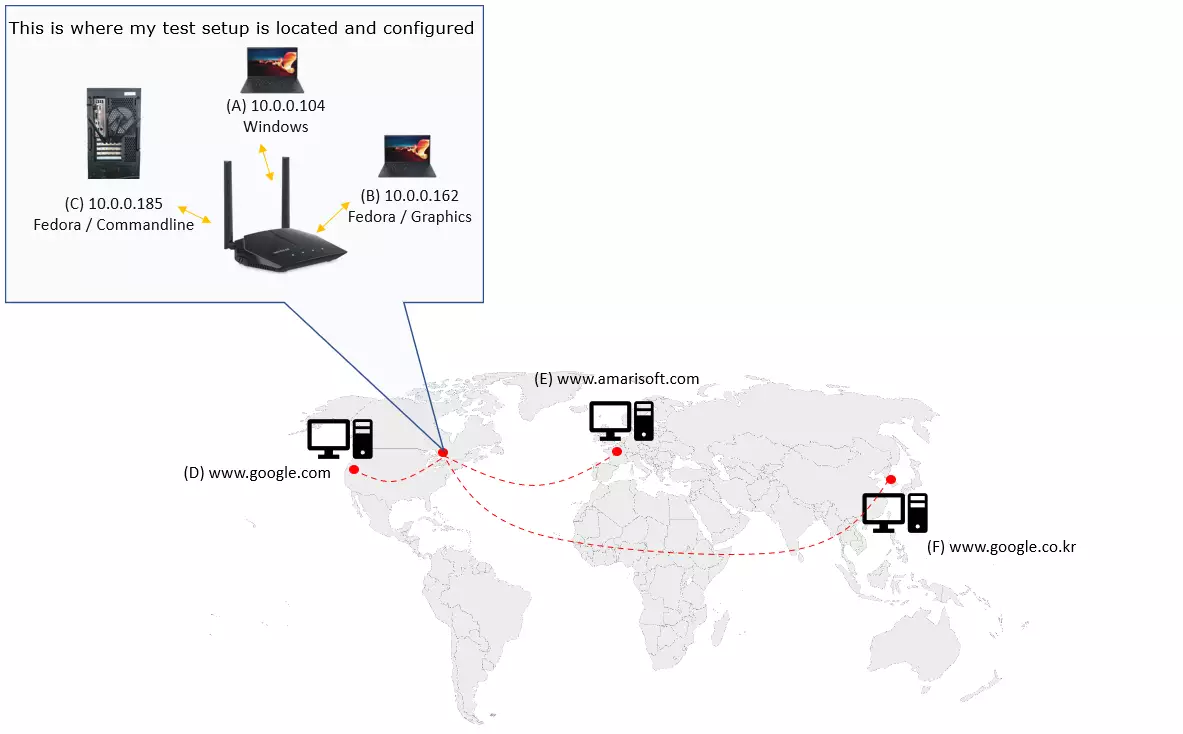
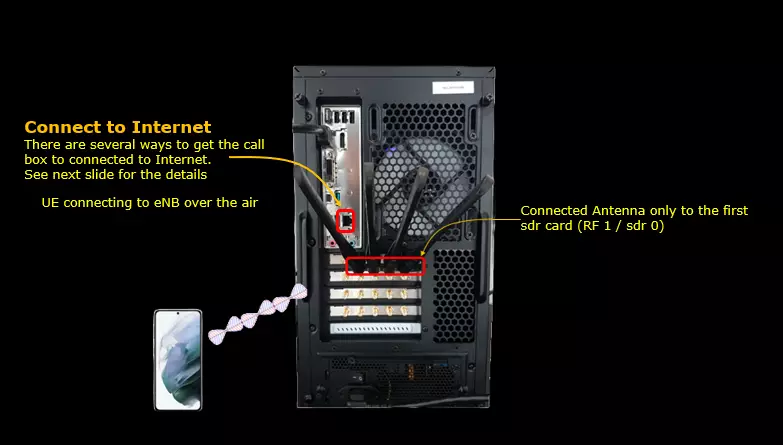
The wireless connectivity among Callbox and all the DUTs used in this tutorial is as shown below.
There are several many ways to provide internet access to your CallBox. Followings are some of them I can think of. In this tutorial, I used the Case 4.
If you decided to use Case 2 and Case 3, following tips would be helpful.
Since Amari Callbox is running command line mode of Linux (Fedora or Ubuntu) NOT on GUI , it is not straightforward to enable / connect WiFi.
Followings are some of the command line command you would need to get WiFi connectivity. You may search these commands on internet for the detailed usage.
# nmcli dev status
# nmcli radio wifi
# nmcli device wifi rescan
# nmcli dev wifi list
# nmcli dev wifi connect network-ssid password "network-password"
Configuration
You can use any configuration that will assign at least one IP to UE with internet apn. For example, you can use LTE attach configuration or SA or NSA configuration.
Check Up before trying UE connection
Before you trying internet connection with UE, you need to check several basic things shown in this section and make it sure everything works as shown here, otherwise Internet connection from UE may not work.
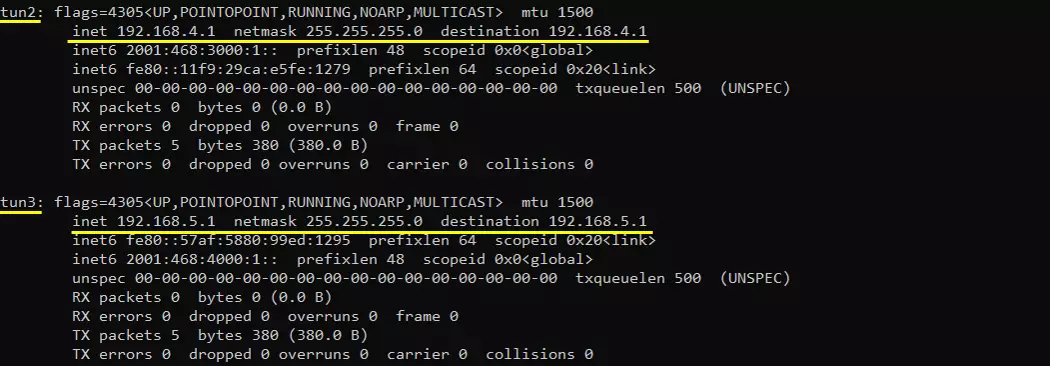
Make it sure that the network interface with internet connectivity is up and tun0,1,2,3 are up.
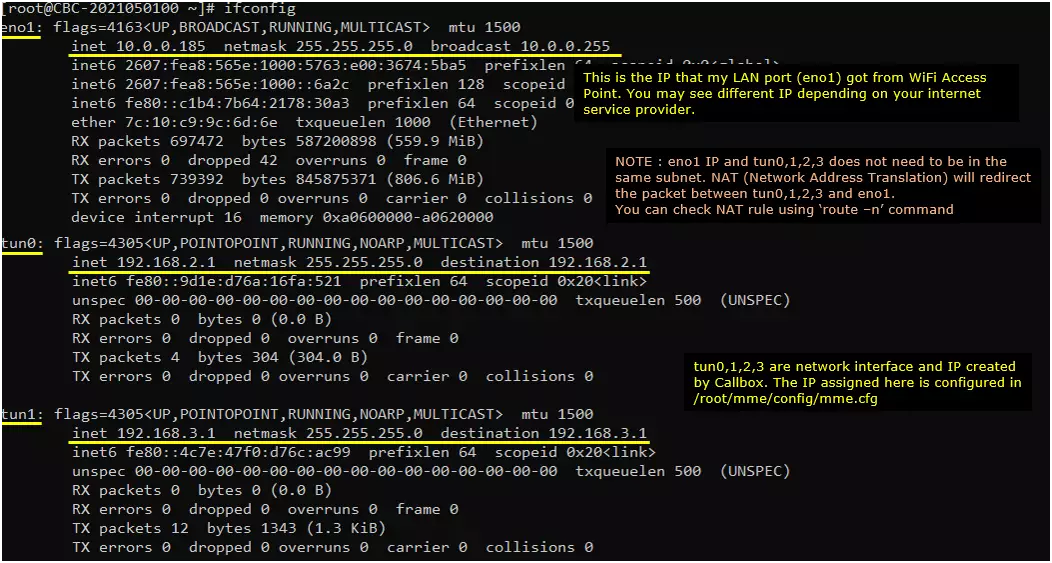
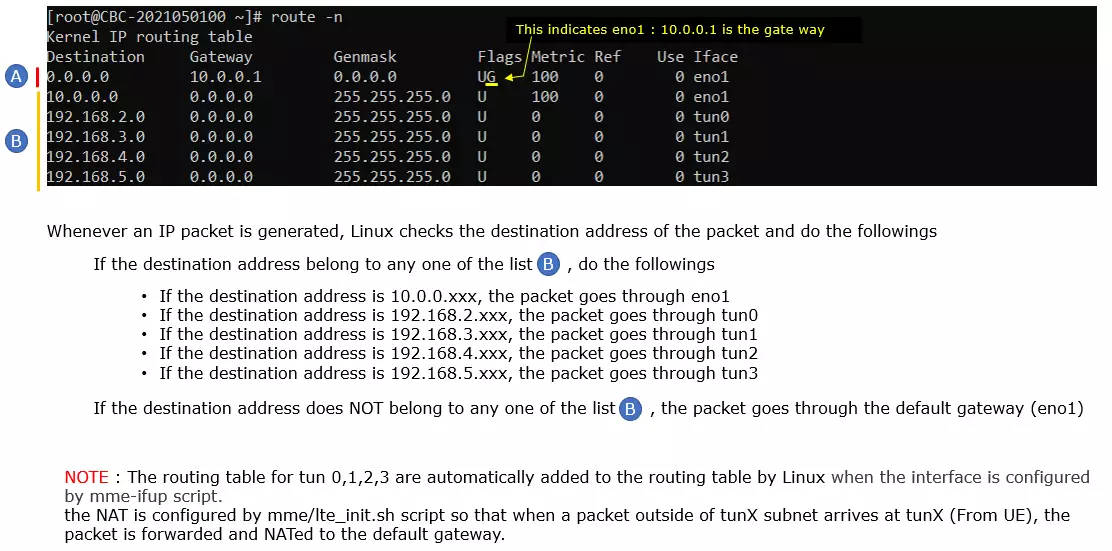
Check up the routing table on CallBox PC. It would usually be as follows. (NOTE : The gateway Iface name may be different on your system depending on your system configuration. But you should see tun0, tun1, tun2, tun3 as shown below)
Make it sure that the call box can reach a server over the internet. I am checking the connectivity as follows
Try ping to 8.8.8.8. This is google DNS and this is configured as DNS by default in mme.cfg

Try ping to a url to check the DNS is working

[Optional] you may find the IP address to a specific url and try ping to the server with both in direct IP and url

Setting Logging Property
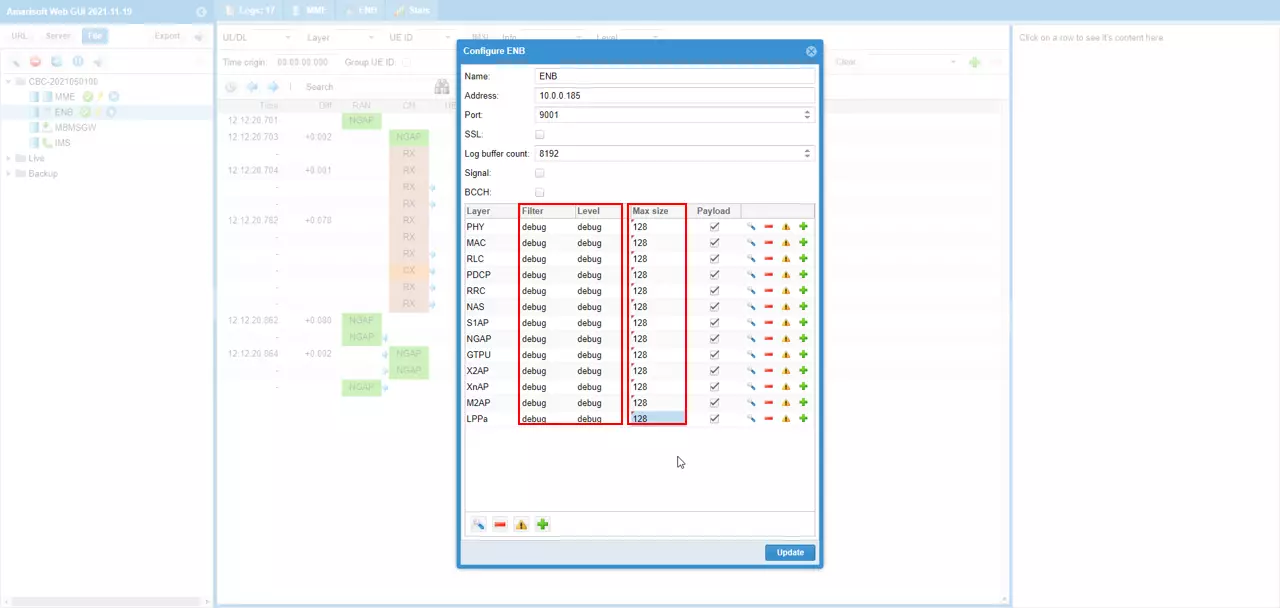
For the detailed analysis, I set the (ENB) logging properties as follows. Increased Max size to capture the full IP header.
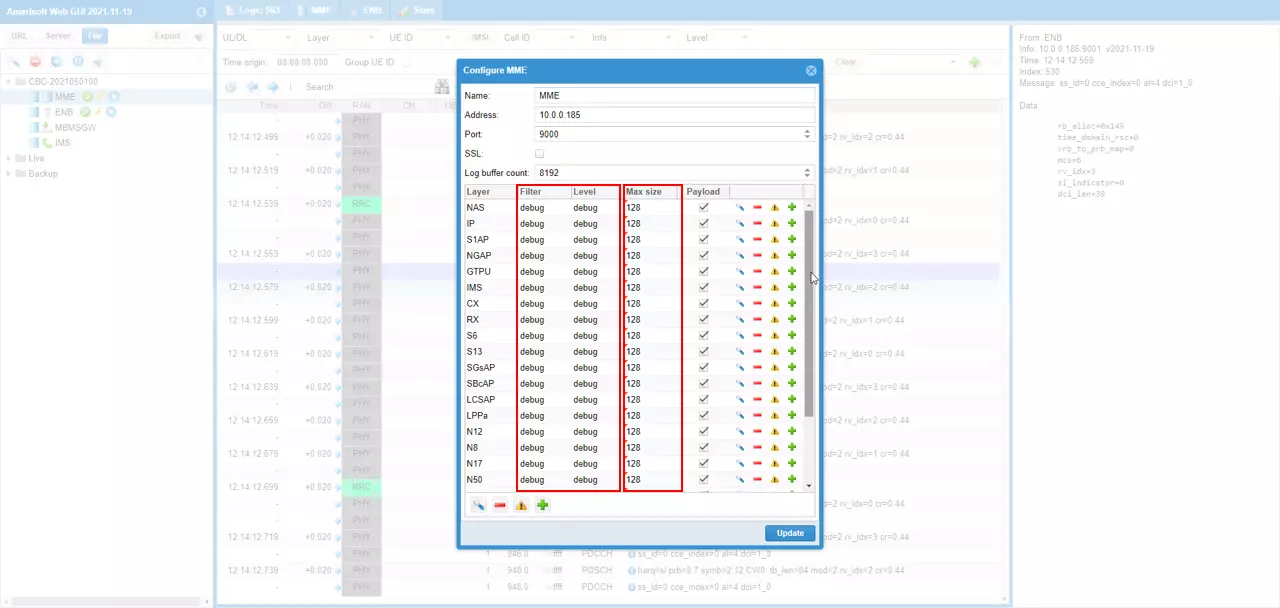
For the same purpose, set the (MME) logging properties as follows. Increased Max size to capture the full IP header.
Test 1 : WiFi
This Test is NOT a main purpose of the tutorial. This is just to show a comparative setup (a reference) to other tests. This Test is done with WiFi and PC. No cellular protocol and mobile phone is involved
ping from the point (A) to point (C). This is to check the connectivity within Local WiFi Network.
ping from the point (A) to point (B). This is also to check the connectivity within Local WiFi Network.
ping from the point (C) to point (B). This is also to check the connectivity within Local WiFi Network.
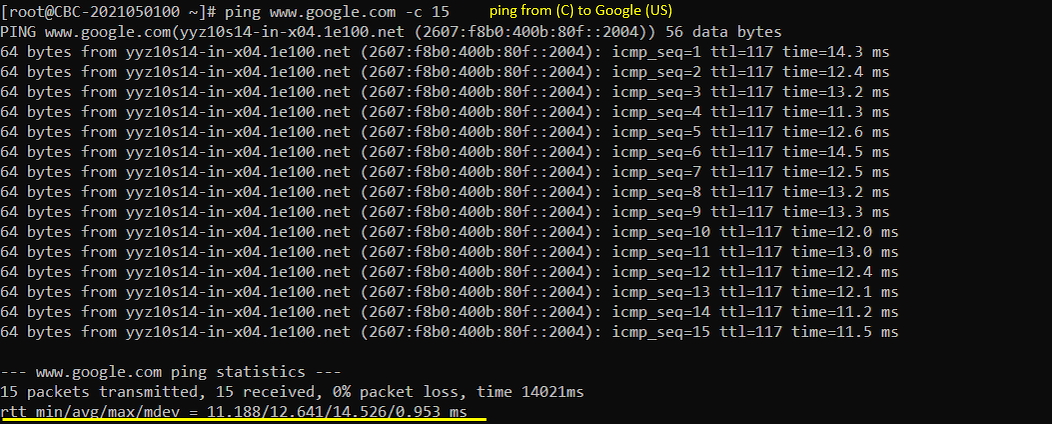
ping from the point (C) to Google. This is to check the connectivity and RTT from the callbox to Google DNS located in US
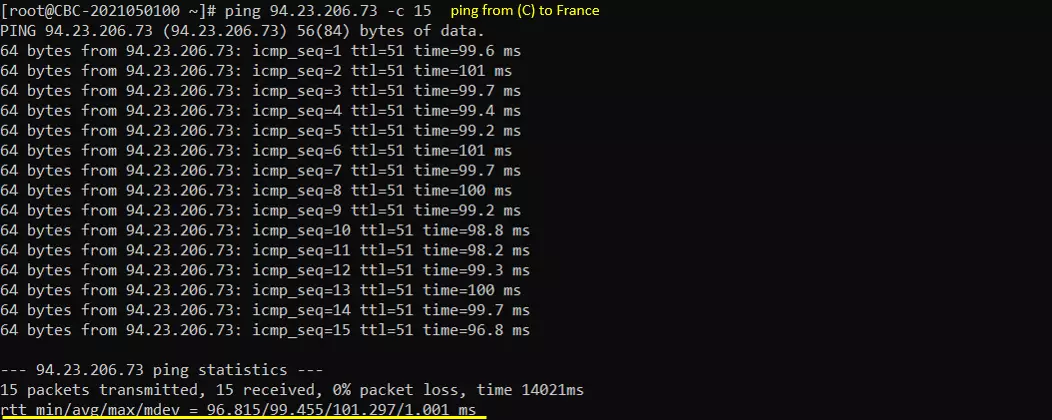
ping from the point (C) to a PC located in France to check Connectivity and RTT.
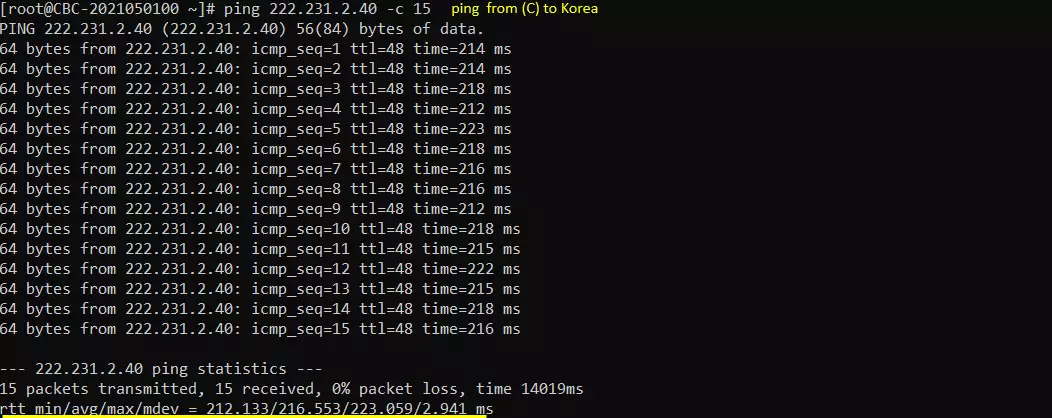
ping from the point (C) to a PC located in Korea to check Connectivity and RTT.
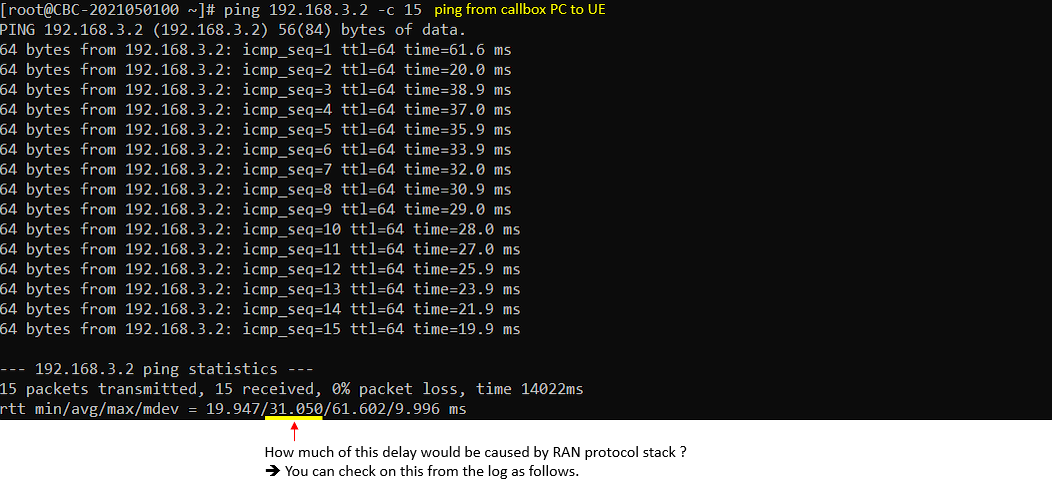
Test 2 : LTE Ping
In this test, I ran the test with enb.cfg file (LTE, 5 Mhz Bandwidth)
You can check on ping packet (ICMP packet) at higher layer (GTPU) log
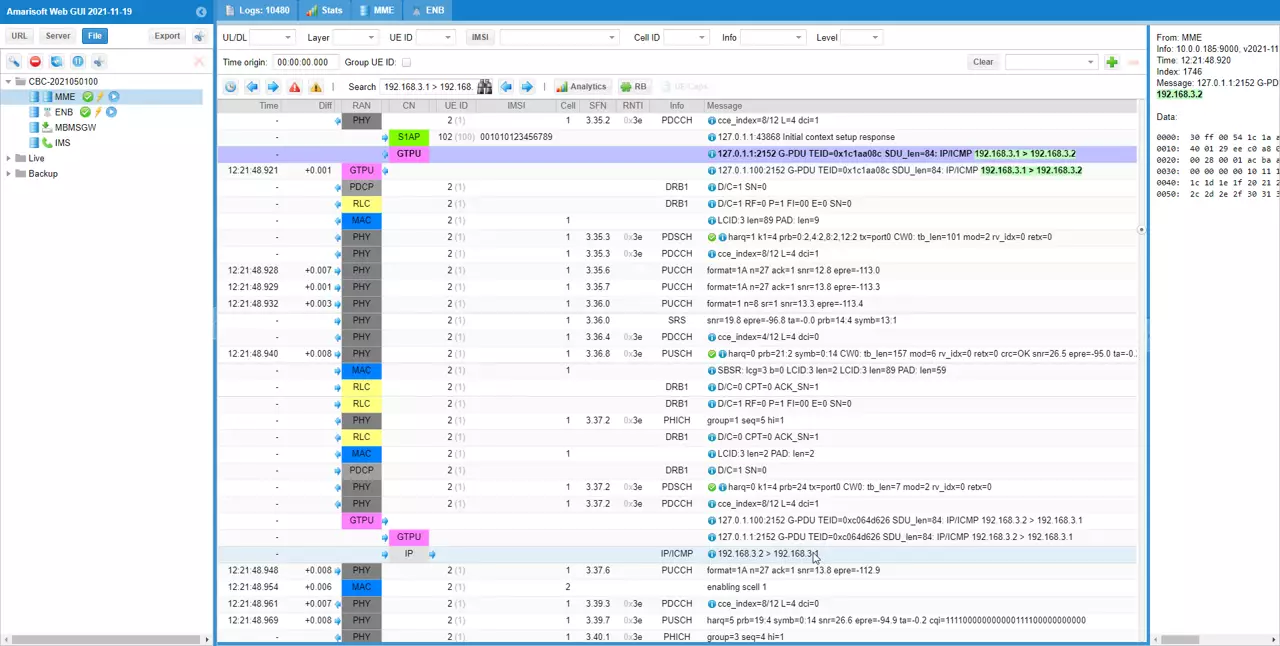
You can check the exact timing when the ICMP packet is transmitted at PHY layer by checking the contents of PHY frame. This is for the packet transmitted from the callbox. This is why I set the large value to (ENB) log property at the beginning.
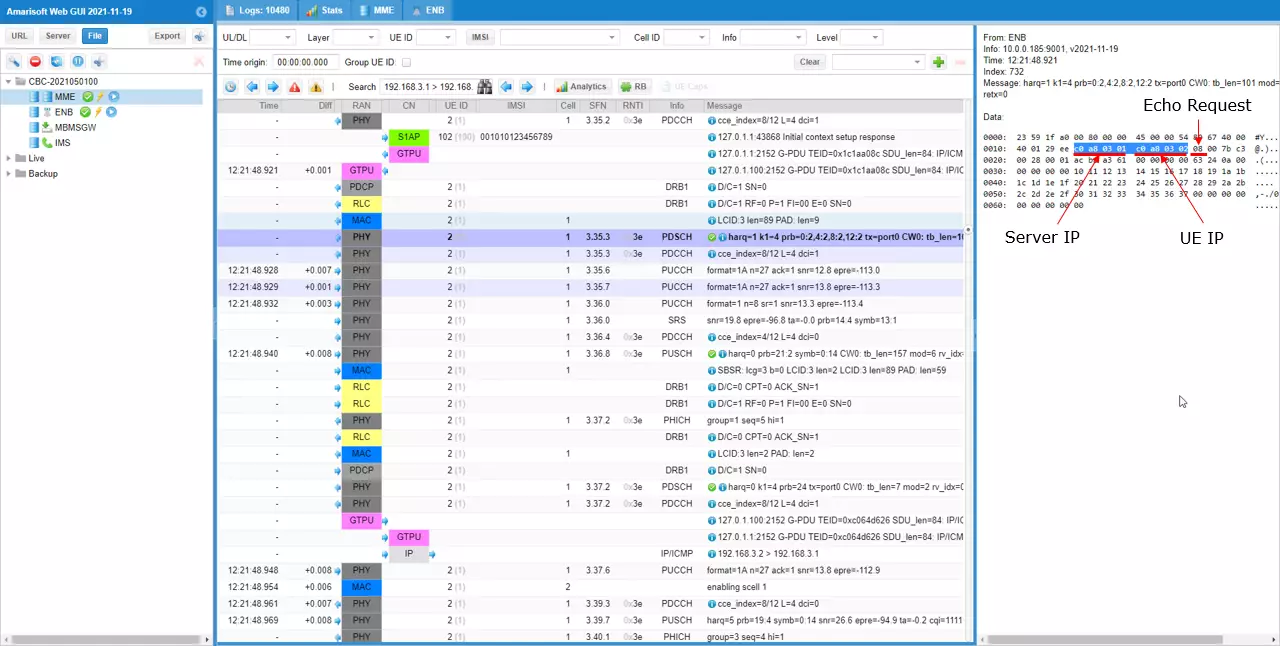
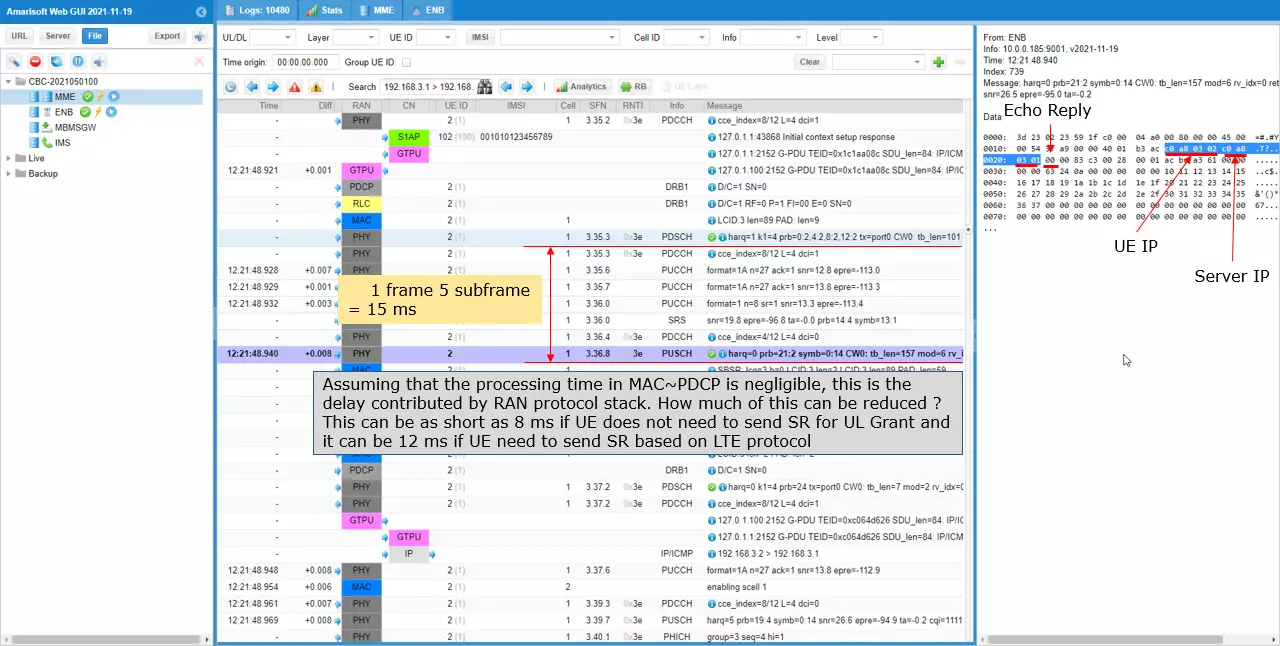
You can check the exact timing when the ICMP packet is recieved at PHY layer by checking the contents of PHY frame. This is for the packet received by the callbox.
If you assume that the processing time in MAC~PDCP is negligibly short, you can check the delay time caused by RAN by comparing the PHY frame timing for Echo Request and Echo Reply.
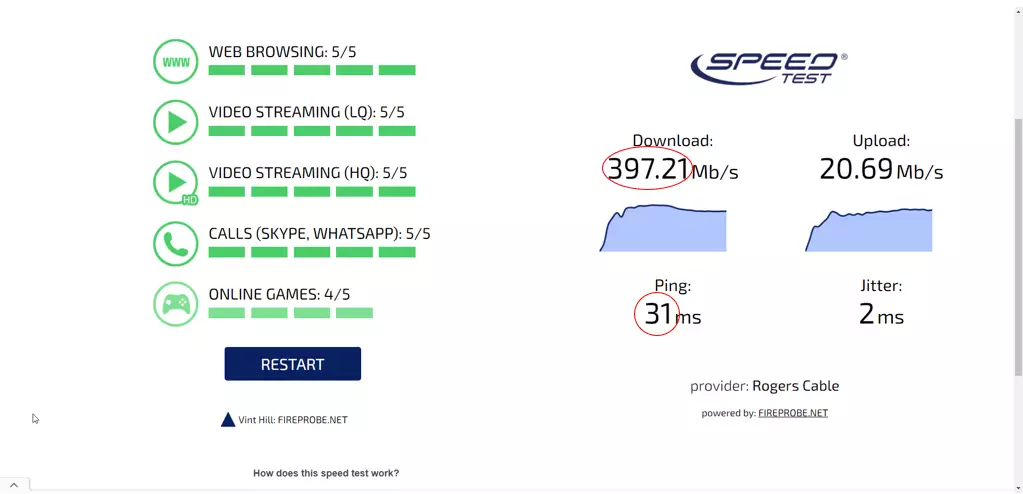
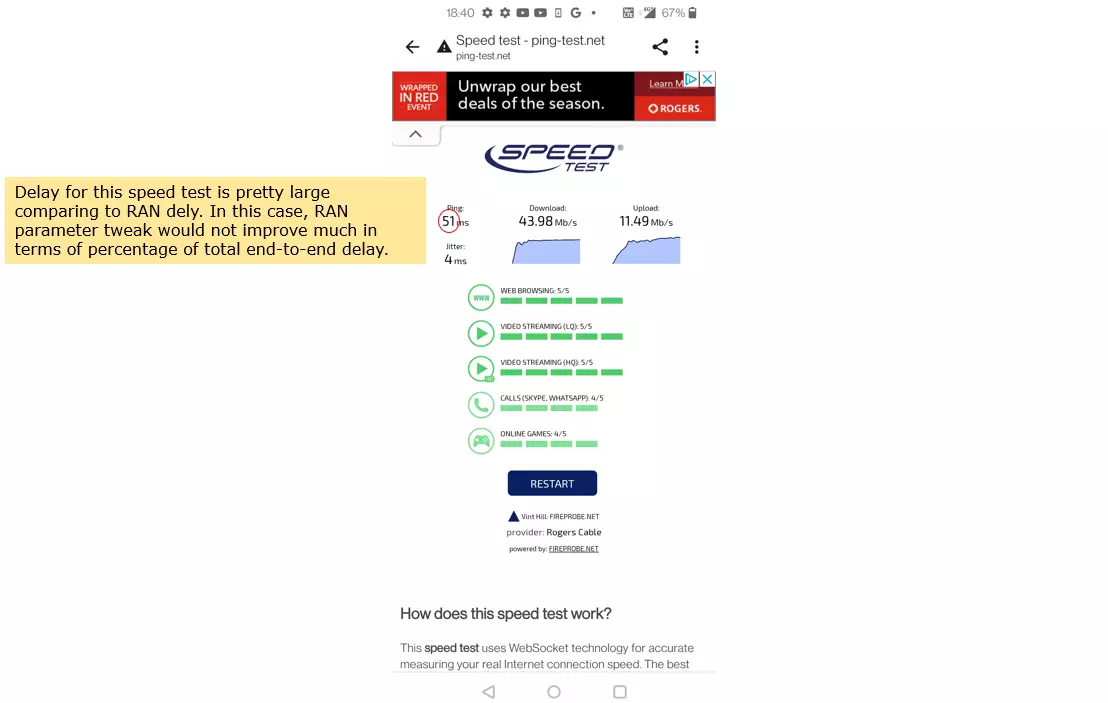
You can also check on the end to end delay from an Application layer using a speed test tool. Not all speed test tool shows delay time (like Ping delay). It would be good to find the speed test tool that shows the delay (and jitter).
If you compare the delay at the application layer and the delay by RAN as shown above, you can break down the end to end delay into RAN delay and Core/Internet delay.
Test 3 : NR/SA Ping
In this test, I used gnb-sa.cfg with CONFIG = 2. The RTT may vary depending on TDD UL/DL Configuration pattern.
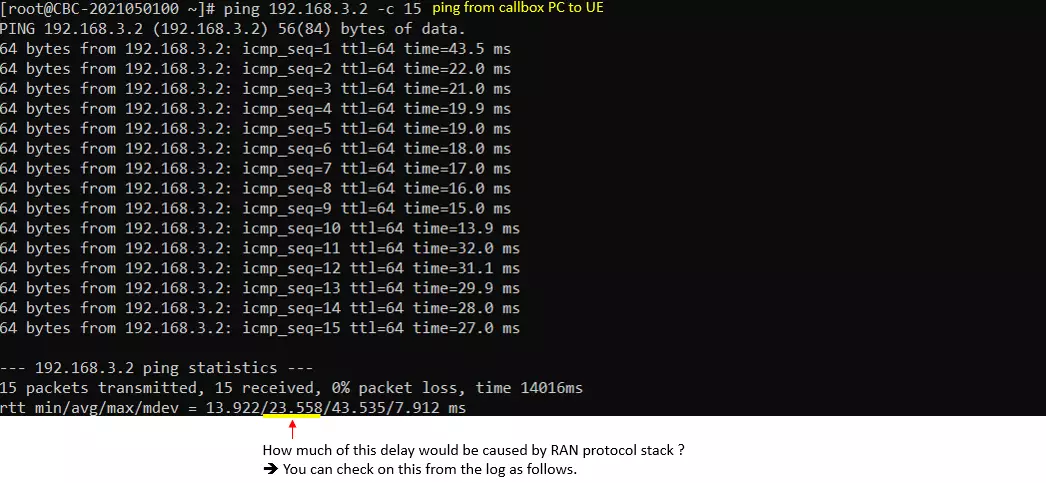
You can check on ping packet (ICMP packet) at higher layer (GTPU) log
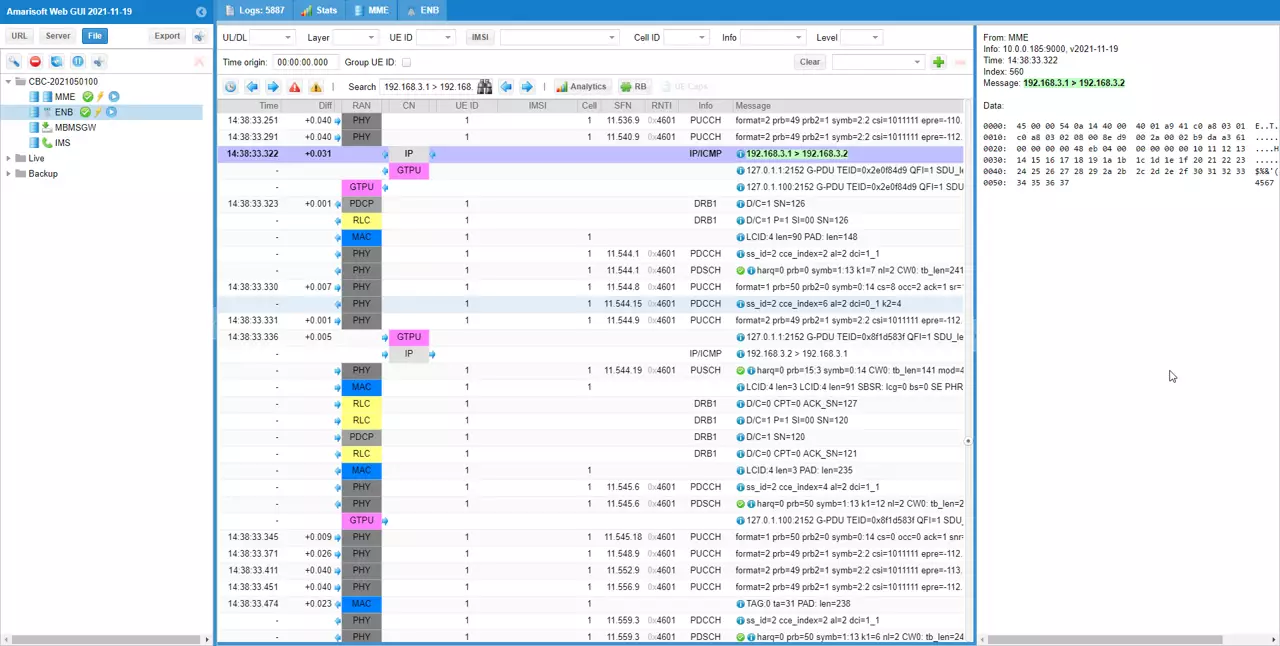
You can check the exact timing when the ICMP packet is transmitted at PHY layer by checking the contents of PHY frame. This is for the packet transmitted from the callbox. This is why I set the large value to (ENB) log property at the beginning.
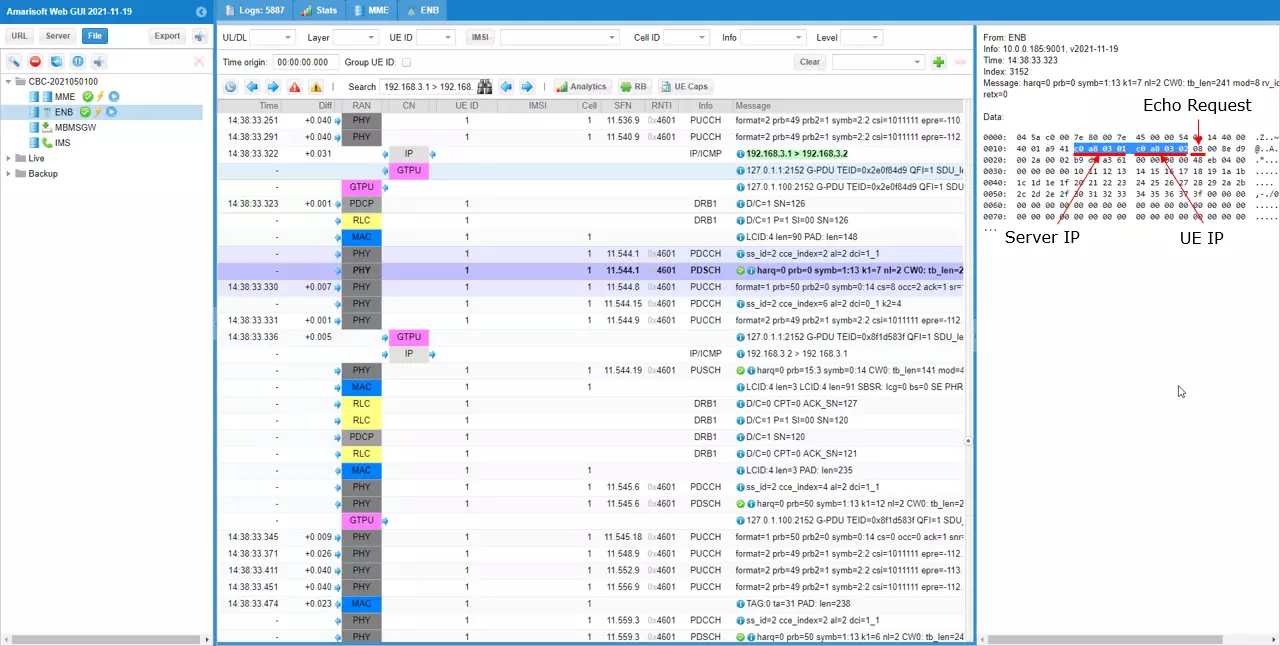
You can check the exact timing when the ICMP packet is recieved at PHY layer by checking the contents of PHY frame. This is for the packet received by the callbox.
If you assume that the processing time in MAC~PDCP is negligibly short, you can check the delay time caused by RAN by comparing the PHY frame timing for Echo Request and Echo Reply.
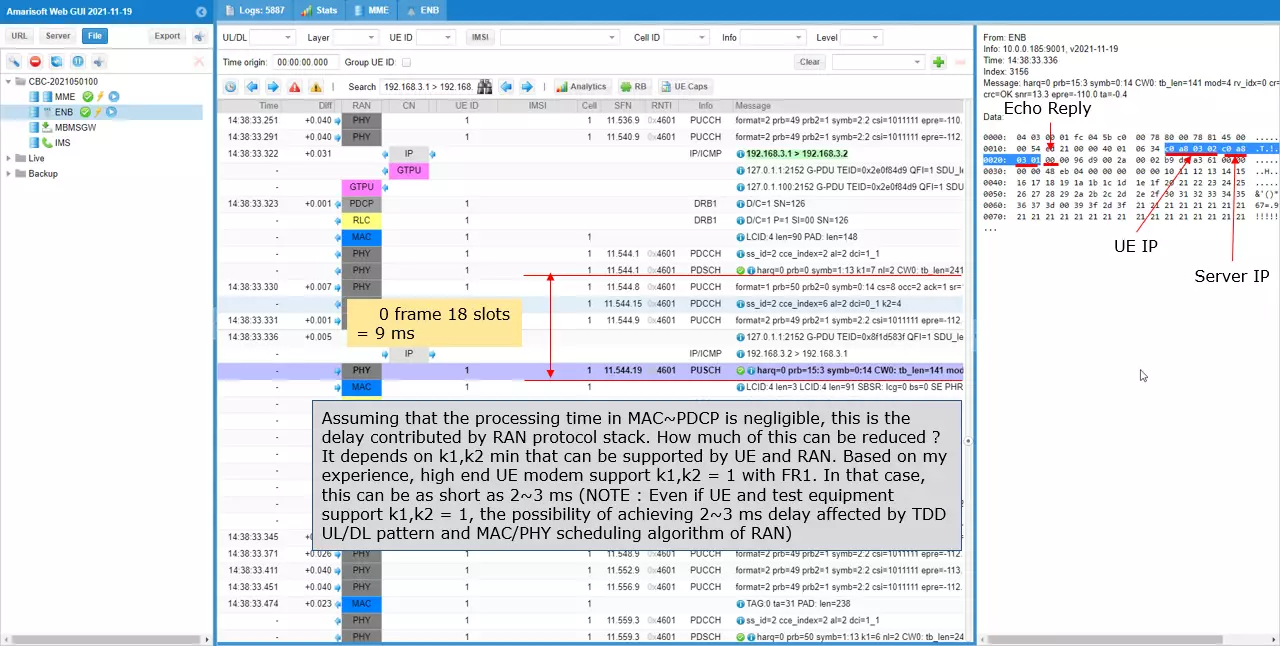
You can also check on the end to end delay from an Application layer using a speed test tool. Not all speed test tool shows delay time (like Ping delay). It would be good to find the speed test tool that shows the delay (and jitter).
If you compare the delay at the application layer and the delay by RAN as shown above, you can break down the end to end delay into RAN delay and Core/Internet delay.
