Channel Simulator - Callbox
This tutorial is about how to configure channel simulator for callbox and verify it using UEsim and Spectrum Analyzer(sdr_spectrum). Channel Simulator and sdr_spectrum is not a separate hardware, they are all software feature that comes with Callbox and UEsim. The Channel Simulator feature in Amarisoft Callbox support following features :
- 3GPP defined Fading Profile for LTE and NR (
NOTE : Amarisoft support TDL model only, does not support CDL) - User defined profile for AWGN, Rician, Reyleigh channel
- Multi Path profile with the mixture of AWGN, Rician, Reyleigh components
Table of Contents
- Channel Simulator - Callbox
- Introduction
- Summary of the Tutorial
- Test Setup
- Key Configuration Parameters
- Configuration
- Perform the Test
- Test 1 : AWGN
- Test 2 : Single Path - Rayleigh
- freq_doppler = 50
- freq_doppler = 100
- freq_doppler = 200
- freq_doppler = 300
- freq_doppler = 400
- freq_doppler = 500
- freq_doppler = 1000
- Test 3 : Multi Path - Rayleigh
- Test 4 : 3GPP Profile
Introduction
The Channel Simulator feature integrated into the Amarisoft Callbox offers a comprehensive software-based solution for emulating complex radio channel conditions in a laboratory environment. Unlike traditional hardware channel emulators, this feature operates entirely in software, leveraging the processing capabilities of the Callbox and UEsim platforms to simulate realistic radio propagation effects for LTE and 5G NR technologies. The Channel Simulator supports 3GPP-defined fading profiles, specifically the Tapped Delay Line (TDL) models, and allows users to configure custom profiles including Additive White Gaussian Noise (AWGN), Rician, and Rayleigh channel conditions, as well as multi-path environments combining these effects. This flexibility enables detailed testing and verification of user equipment (UE) behavior and network performance under controlled, repeatable conditions without requiring external hardware. Spectrum analysis and verification are facilitated via the sdr_spectrum software, providing real-time visualization of channel effects. This tutorial guides users through the configuration of the Channel Simulator, execution of simulation scenarios using UEsim, and validation of results with the integrated spectrum analyzer, forming a crucial workflow for developers, testers, and researchers working with advanced wireless communication systems.
-
Context and Background
- The Amarisoft Callbox and UEsim platforms are widely used for developing and testing LTE and 5G NR systems in controlled test environments.
- The Channel Simulator is a built-in software feature, eliminating the need for external hardware channel emulators.
- sdr_spectrum is an integrated spectrum analyzer tool within the software ecosystem, enabling direct observation and analysis of simulated channel effects.
- 3GPP-defined fading profiles, particularly TDL models, are essential for standardized, repeatable testing aligned with industry specifications.
-
Relevance and Importance of the Tutorial
- Accurate channel emulation is critical for ensuring the reliability and robustness of wireless devices and network implementations.
- This tutorial addresses the configuration and verification workflows required for advanced testing scenarios, such as mobility, multi-path, and fading conditions.
- Understanding the Channel Simulator enhances the effectiveness of test campaigns and accelerates the development lifecycle for LTE/5G NR products.
-
Learning Outcomes
- Gain practical skills in configuring the Channel Simulator for various channel models, including standardized and user-defined profiles.
- Learn to execute channel simulation scenarios using UEsim and interpret results using sdr_spectrum.
- Acquire the ability to verify system performance under diverse radio conditions using purely software-based tools.
- Develop proficiency in creating custom channel profiles to address unique testing requirements.
-
Prerequisite Knowledge and Skills
- Familiarity with LTE and 5G NR concepts, including radio propagation and fading phenomena.
- Basic experience with Amarisoft Callbox and UEsim operation and configuration workflows.
- Understanding of spectrum analysis principles and interpreting spectrum analyzer outputs.
- General knowledge of wireless communication test environments and performance metrics.
Summary of the Tutorial
This tutorial describes a series of low-layer channel simulation tests, focusing on configuring and analyzing different channel conditions using Amarisoft's simulation environment. The tests are designed to evaluate the impact of various channel impairments, including AWGN noise and Rayleigh fading (single and multipath), as well as standardized 3GPP fading profiles. Below is a structured summary of the test procedures and methodologies:
-
Test Setup and Configuration:
- Uses a basic SIM card and default configuration files (enb-chan-sim-ref.cfg for gNB/eNB, ue-enb-chan-sim-ref.cfg for UEsim), with modifications applied only to the channel_dl section for each test.
- Physical layer scheduler parameters are set to maintain a fixed modulation scheme and PRB allocation, ensuring constant signal characteristics for clear comparison.
- Test steps common to all cases:
- Verify cell configuration using cell phy output.
- Power on UEsim and confirm connection establishment.
- Analysis tools:
- WebGUI on UEsim with I/Q logging for constellation analysis.
- Spectrum analysis using sdr_spectrum on a spare SDR card, with frequency and time domain plots for signal quality evaluation.
-
Test 1: AWGN Injection
- Objective: Evaluate the effect of additive white Gaussian noise (AWGN) at different noise levels on the downlink signal.
- Procedure:
- Set channel simulator type to awgn in the configuration.
- Iteratively adjust the noise_level parameter to values: -30dB, -20dB, -10dB.
- For each noise level:
- Analyze constellation diagram via WebGUI (expect minimal impact at tested levels).
- Capture and review frequency and time domain plots with sdr_spectrum (minimal visible effect unless AWGN is very high).
-
Test 2: Single-Path Rayleigh Fading
- Objective: Demonstrate the impact of Rayleigh fading, focusing on Doppler shift effects in a single-path (single-tap) scenario.
- Procedure:
- Set channel simulator type to Rayleigh with a single fading path.
- Vary freq_doppler parameter through values: 50Hz, 100Hz, 200Hz, 300Hz, 400Hz, 500Hz, 1000Hz.
- For each Doppler value:
- Observe constellation (equalizer compensates frequency drift, so only amplitude variation is notable).
- Capture and analyze frequency spectrum (small amplitude variations) and time domain plots (more noticeable fading effects) with sdr_spectrum.
-
Test 3: Multi-Path Rayleigh Fading
- Objective: Analyze the effects of multipath Rayleigh fading by configuring multiple fading taps, simulating a more realistic wireless channel.
- Procedure:
- Configure multiple Rayleigh paths (tabs) in channel_dl, as per 3GPP or custom fading profiles.
- Set freq_doppler to 100Hz and 1000Hz for all paths.
- For each Doppler setting:
- Review constellation (mainly amplitude variation visible due to equalization).
- Analyze frequency and time domain signals using sdr_spectrum, comparing the increased variation with single-path results.
- Note: For MIMO testing, adjust channel_matrix dimensions and optionally configure mimo_correlation.
-
Test 4: 3GPP Fading Profiles
- Objective: Apply standardized 3GPP channel profiles (EVA, EPA, ETU) to simulate real-world radio environments.
- Procedure:
- Configure channel_dl to use 3GPP fading profiles with freq_doppler set to 1000Hz.
- Profiles tested:
- EVA (Extended Vehicular A)
- EPA (Extended Pedestrian A)
- ETU (Extended Typical Urban)
- For each profile:
- Analyze constellation, frequency, and time domain signals using WebGUI and sdr_spectrum.
- Compare the observed fading and Doppler effects with previous results for intuitive understanding.
Common Methodology: All tests utilize the same configuration workflow, analysis tools, and evaluation procedures, with only specific channel parameters modified per test scenario. This ensures reproducibility and consistent comparison across different channel conditions.
Test Setup
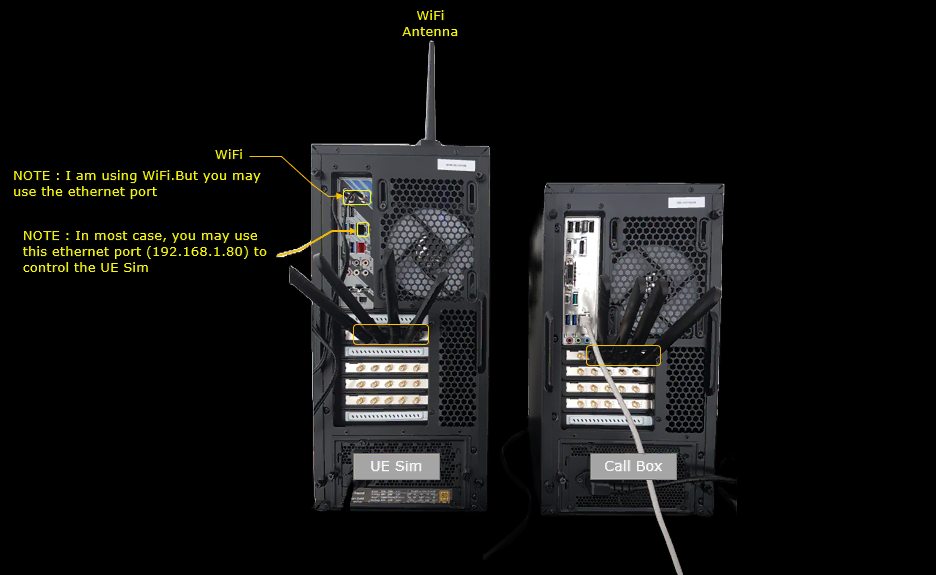
Test setup for this tutorial is as shown below. This is just for low layer testing, you may not need any complicated IP layer setup.
- SIM Card used in this tutorial is the one delivered with the system as it is.
- If you want to change the configuration, The tutorial Configuration Guide would help
Key Configuration Parameters
Followings are important configuration parameters for this tutorial. You may click on the items for the descriptions from Amarisoft documents.
- rf_ports
- channel_dl
- type
- freq_doppler
- delay_spread
- mimo_correlation
- paths . In this link, you will get the descriptions for all the items listed below
- type
- gain
- delay
- channel_matrix
- freq_shift
- freq_doppler
- mimo_correlation
- noise_level
Configuration
I have used enb-chan-sim-ref.cfg that is copied and modified from enb.default.cfg. I will use the same file for all the test in this tutorial and just modify the parameters in the file without creating a new file.
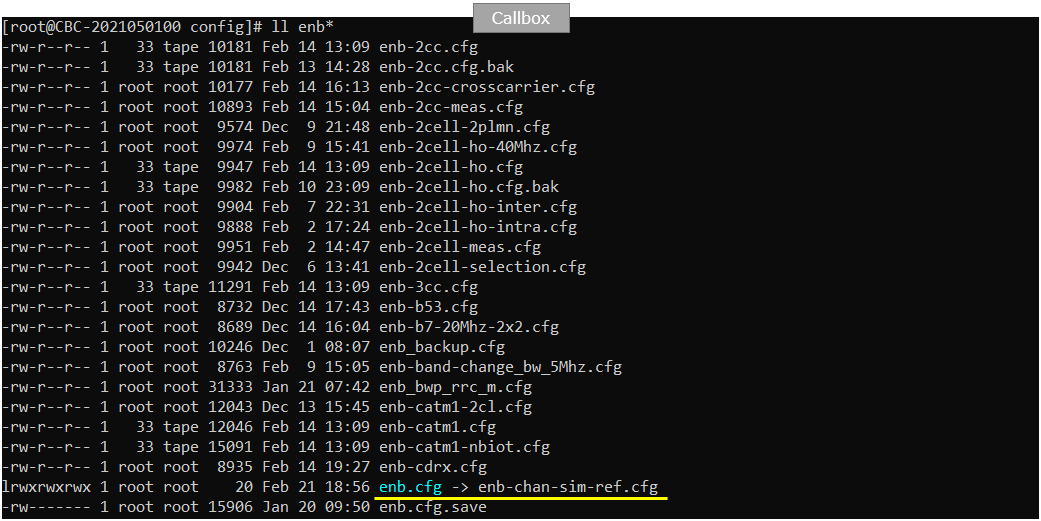
I am using the default mme, ims config as shown below.

I used ue-enb-chan-sim-ref.cfg which is copied and modifed from ue.default.cfg on UEsim.

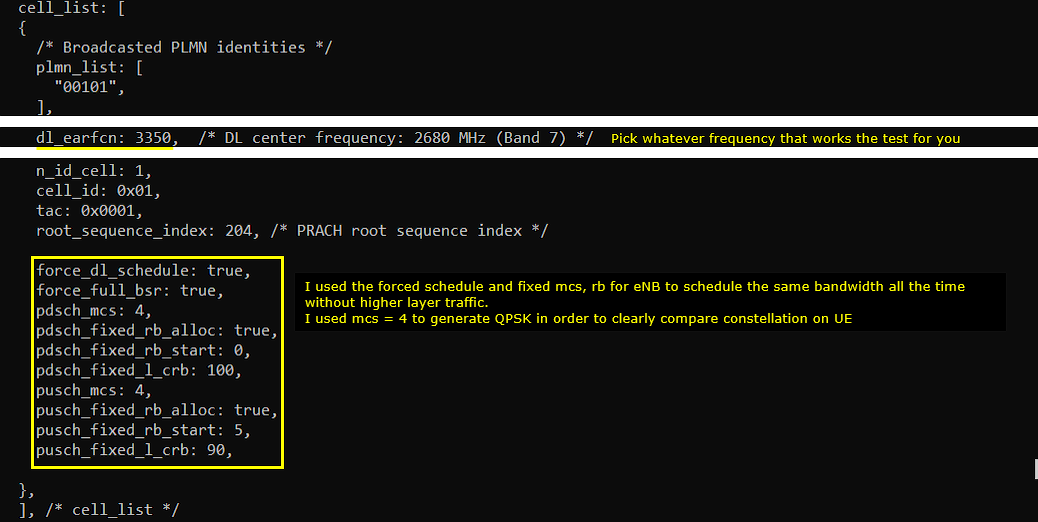
Following is the basic configuration in enb-chan-sim-ref.cfg and only channel_dl:{ } part will be changed for each of the test and all other parts would remain same.
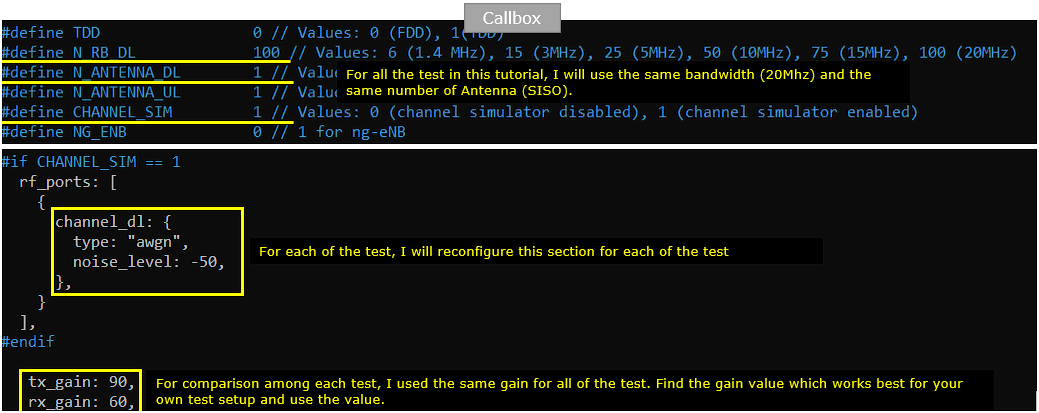
I configured physical layer scheduler parameters so that I can schedule PDSCH and PUSCH continuously with specific modulation scheme and the number of PRBs that I like without injecting any IP layer data. This is not mandatory to enable channel simulation, but I applied these configuration just to create the same signals with constant modulation scheme to better visualize the effect of channel simulation.

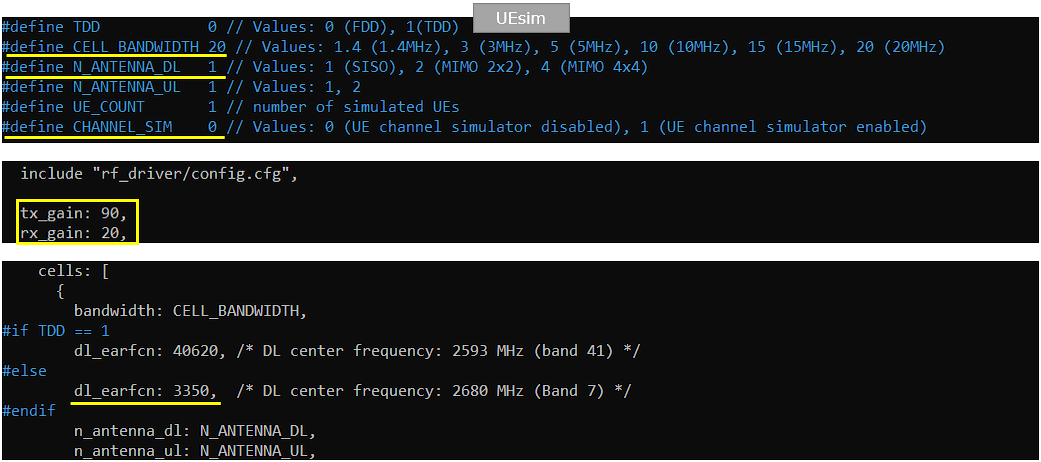
Following is the basic configuration in ue-enb-chan-sim-ref.cfg .cfg. The configuration here should match the configuration of Callbox(gNB). The only thing to be set independantly are tx_gain and rx_gain that should be adjusted depending on test setup.
Perform the Test
I will follow the same procedure as shown here for all the test in this tutorial.
Check if the cell is configured as intended by checking the output of 'cell phy'

Power on UE (UEsim in this tutorial) and make it sure that the connection is established.

Analysis of Constellation
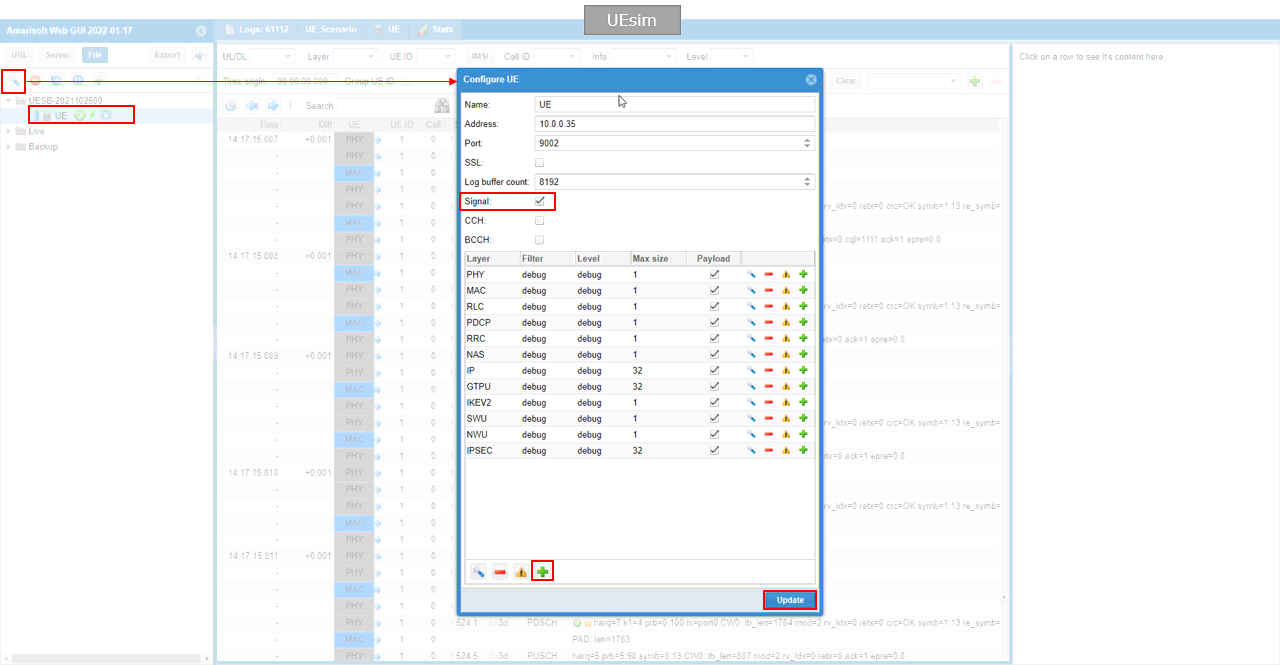
For constellation check, run WebGUI on UEsim with the following logging option('singal' checked). This option is to capture I/Q data in the log.
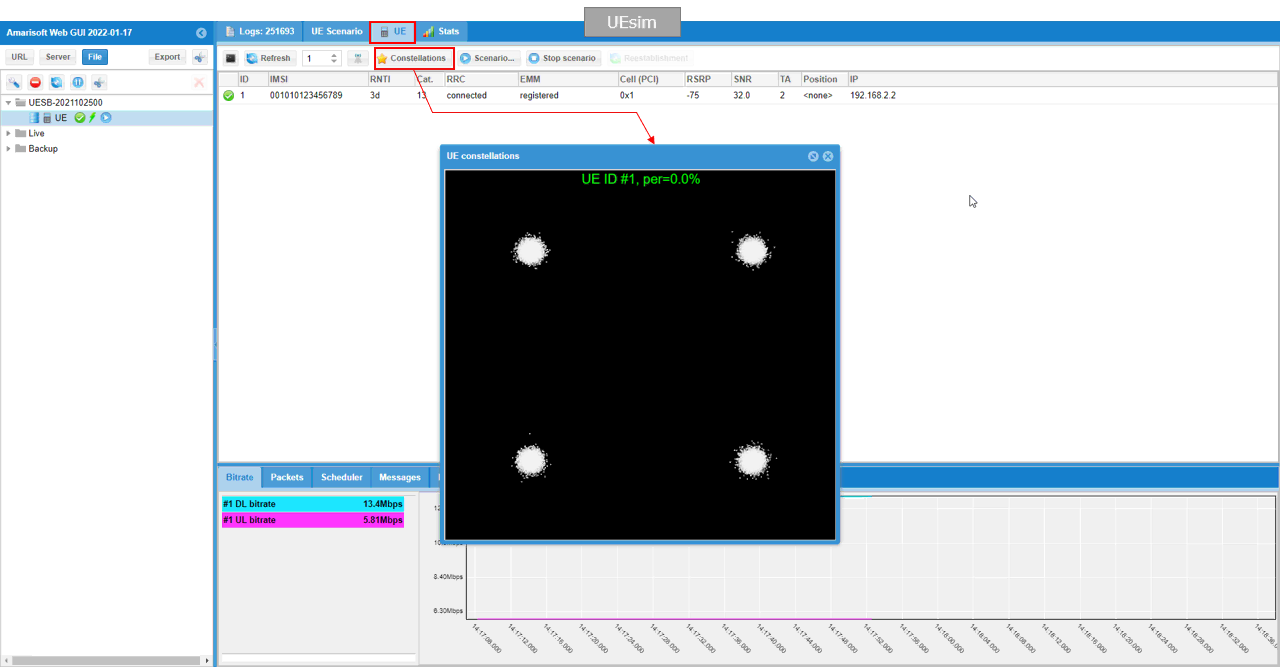
Run Constellation as shown below. You can check on the constellation visually and by checking per value.
Analysis on Spectrum Analyzer
For the verification with spectrum analyzer (sdr_spectrum), you can run sdr_spectrum on a sdr which is not used for the test. I am using an sdr card on callbox since all the test is being done with antenna, but you can use the sdr_spectrum/sdr card on UEsim as well. (
This is the command line command that I used to run the sdr (NOTE : Exact command parameters should be changed based on the specific test case and sdr card availability on your system)
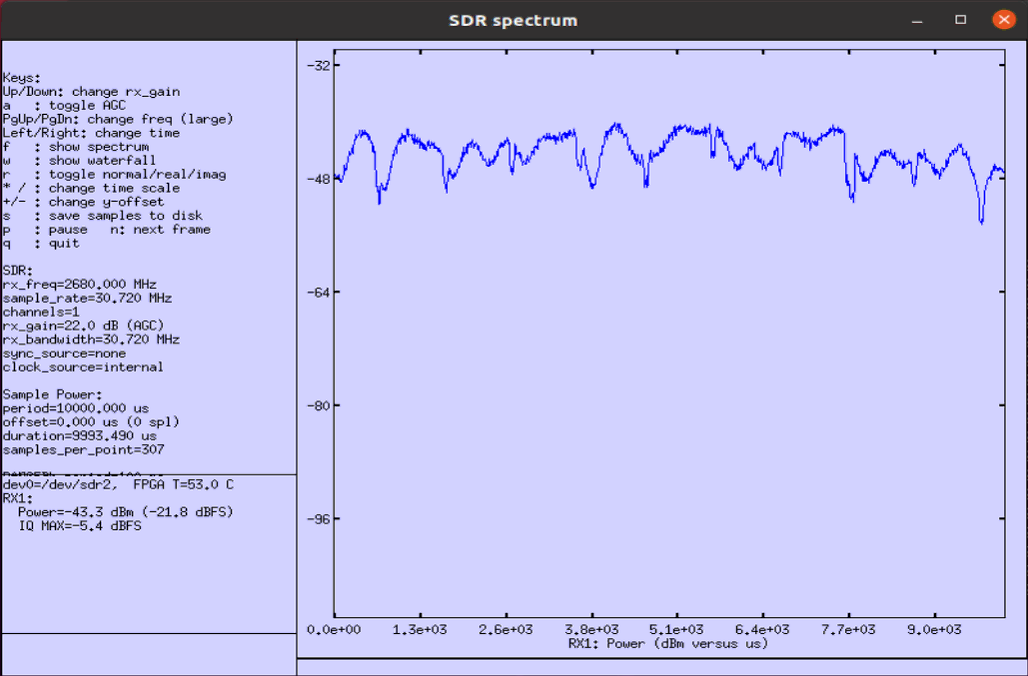
./sdr_spectrum -arg="dev0=/dev/sdr2", -rx_freq 2680e6

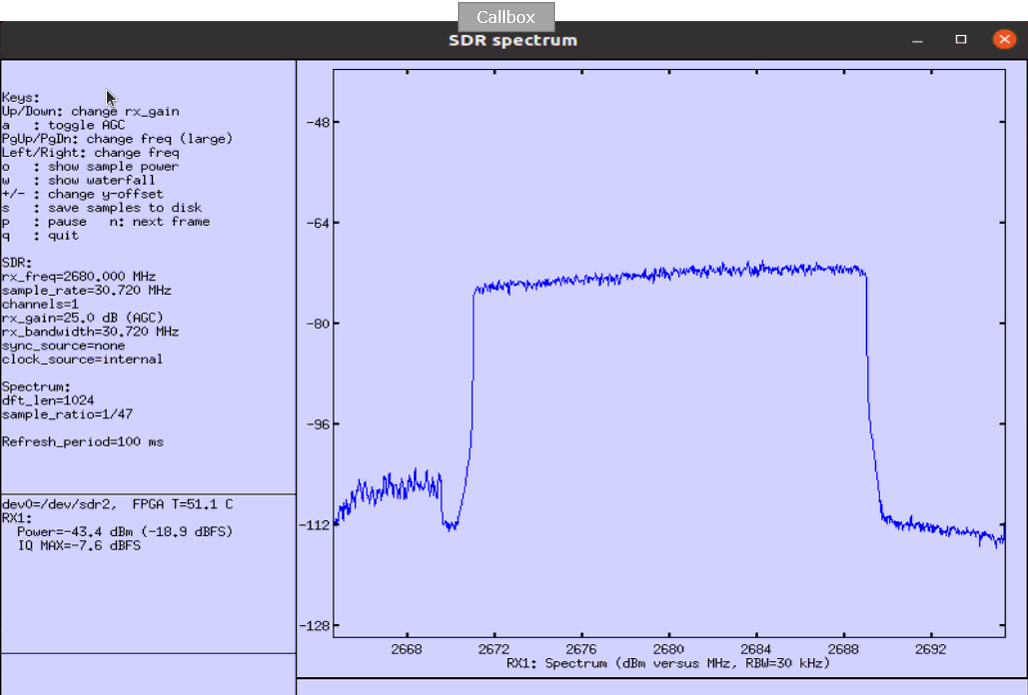
This is frequency domain waveform (we normall call this 'Frequency Spectrum')
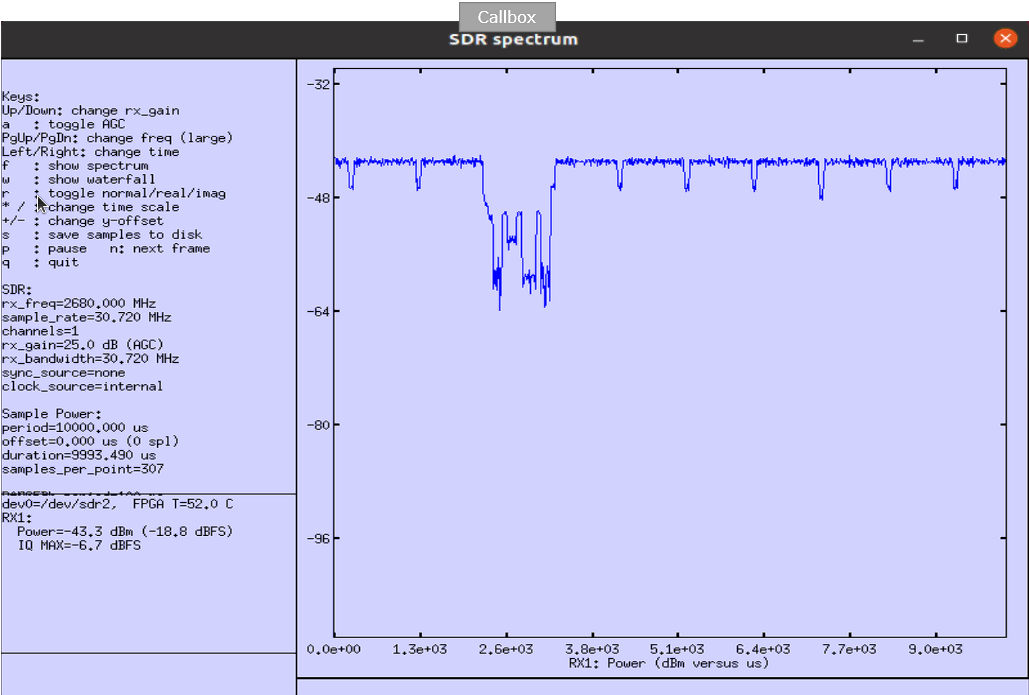
Following shows the time vs power plot (in some cases we call this as 'Zero Span plot').
Test 1 : AWGN
In this test, I will show you how to inject AWGN to do downlink signal of gNB and change the level of AWGN. There would be users who wants to change SNR for the transmitted signal from gNB and we don't have any explicit configuration parameter to set SNR. But using this awgn injection capability, you can simulate varying SNR of the transmitted signal.
In this test, I will set the channel simulator type to "awgn" and see the constellation / spectrum at various noise_level


noise_level = -30
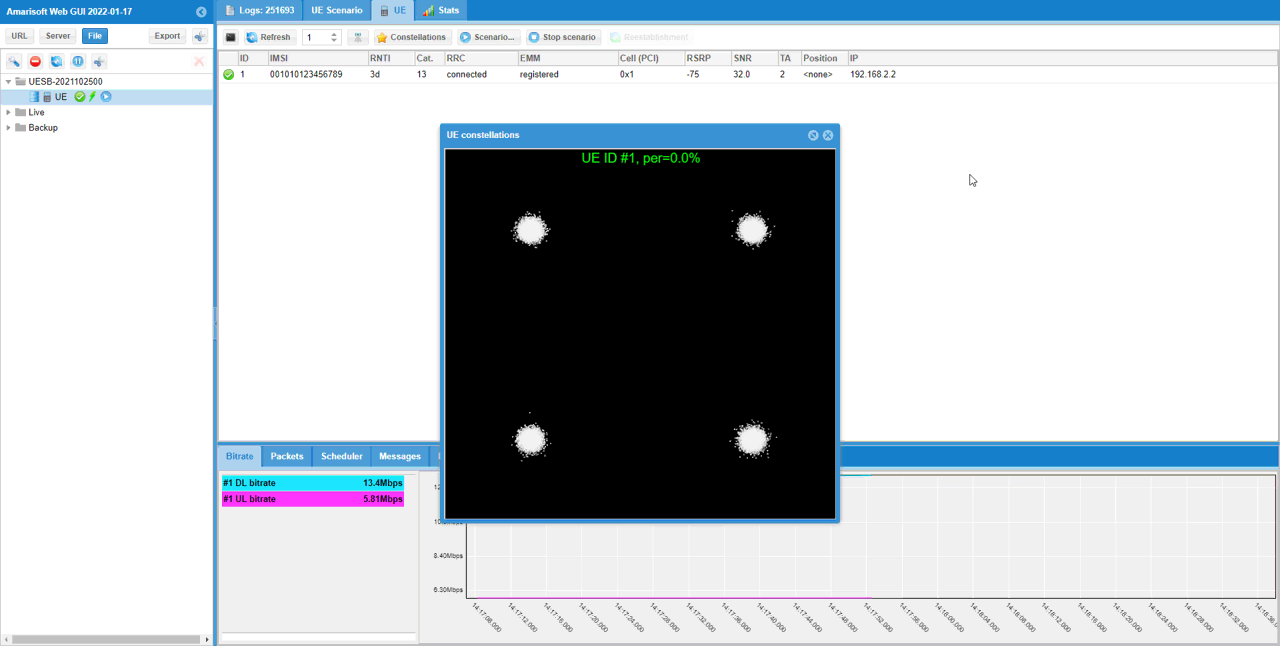
This test shows the case where adding -30dB AWGN to the signal carrying QAM data.
In terms of the constellation, -30dB AWGN shows almost no negative impact on the signal decoding since per shows 0.0%. This is the signal capture and analysis from the reciever (in this case Amarisoft UEsim) using WebGUI.
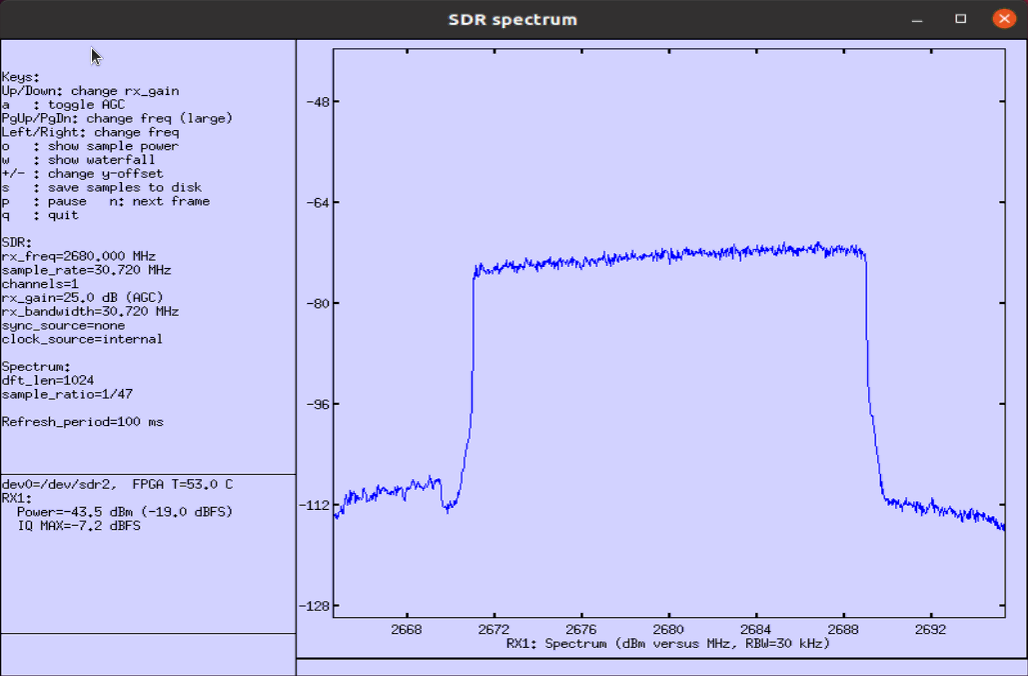
This is the capture of the signal using the built-in spectrum analyzer (called sdr_spectrum) as explained here.
Following shows frequency spectrum. Usually it would not get much of noticiable changes in frequency spectrum with AWGN because the level of AWGN is much smaller comparing to the signal. If the AWGN is so high to be noticiable on spectrum, it would be highly likely that the connection would be broken and call drop would happen).
Following shows time domain plot. Usually it would not get much of noticiable changes in frequency spectrum with AWGN because the level of AWGN is much smaller comparing to the signal and the amlitude is represnted in log scale. If the AWGN is so high to be noticiable on spectrum, it would be highly likely that the connection would be broken and call drop would happen).
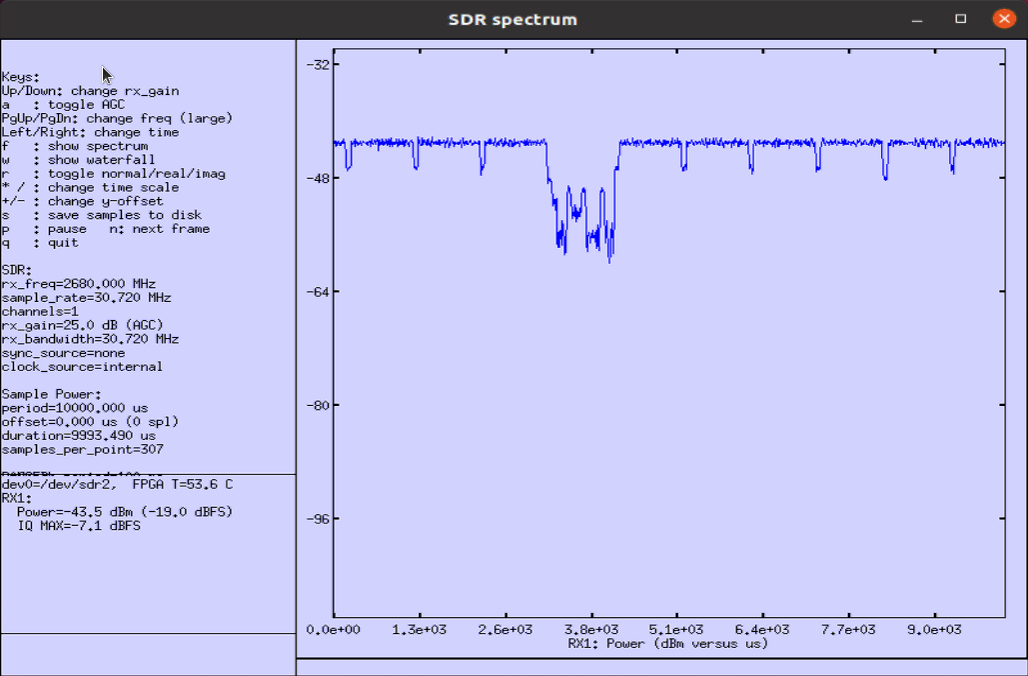
noise_level = -20
This test shows the case where adding -20dB AWGN to the signal carrying QAM data.
In terms of the constellation, -20dB AWGN shows almost no negative impact on the signal decoding since per shows 0.0%. This is the signal capture and analysis from the reciever (in this case Amarisoft UEsim) using WebGUI.
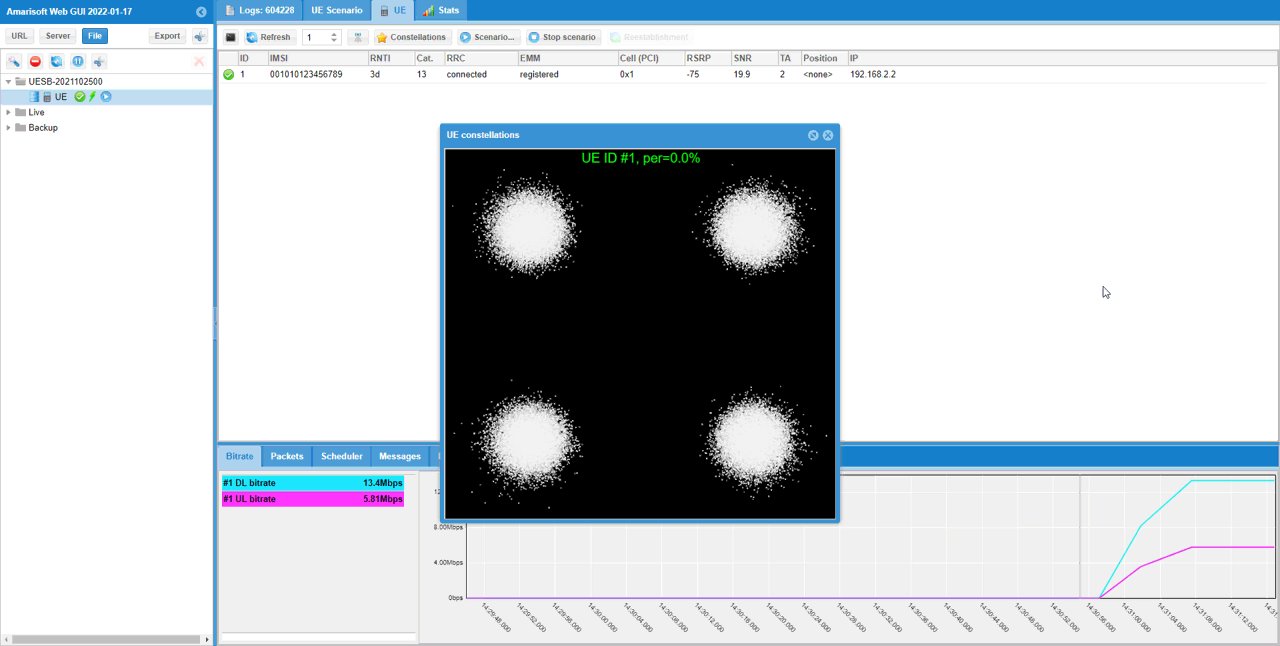
This is the capture of the signal using the built-in spectrum analyzer (called sdr_spectrum) as explained here.
Following shows frequency spectrum. Usually it would not get much of noticiable changes in frequency spectrum with AWGN because the level of AWGN is much smaller comparing to the signal. If the AWGN is so high to be noticiable on spectrum, it would be highly likely that the connection would be broken and call drop would happen).
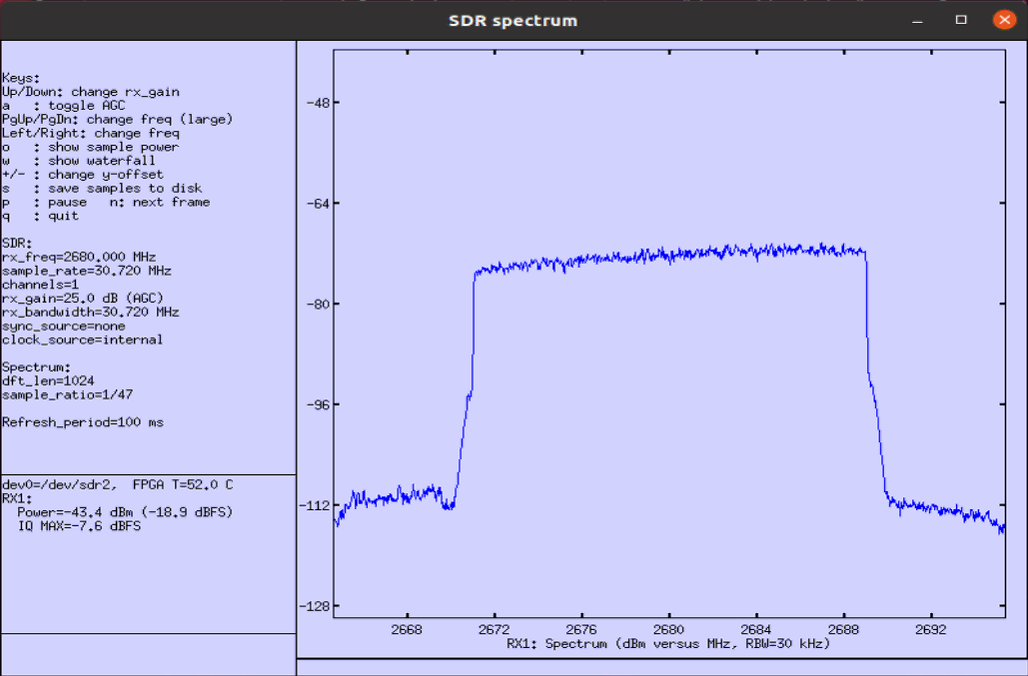
Following shows time domain plot. Usually it would not get much of noticiable changes in frequency spectrum with AWGN because the level of AWGN is much smaller comparing to the signal and the amlitude is represnted in log scale. If the AWGN is so high to be noticiable on spectrum, it would be highly likely that the connection would be broken and call drop would happen).
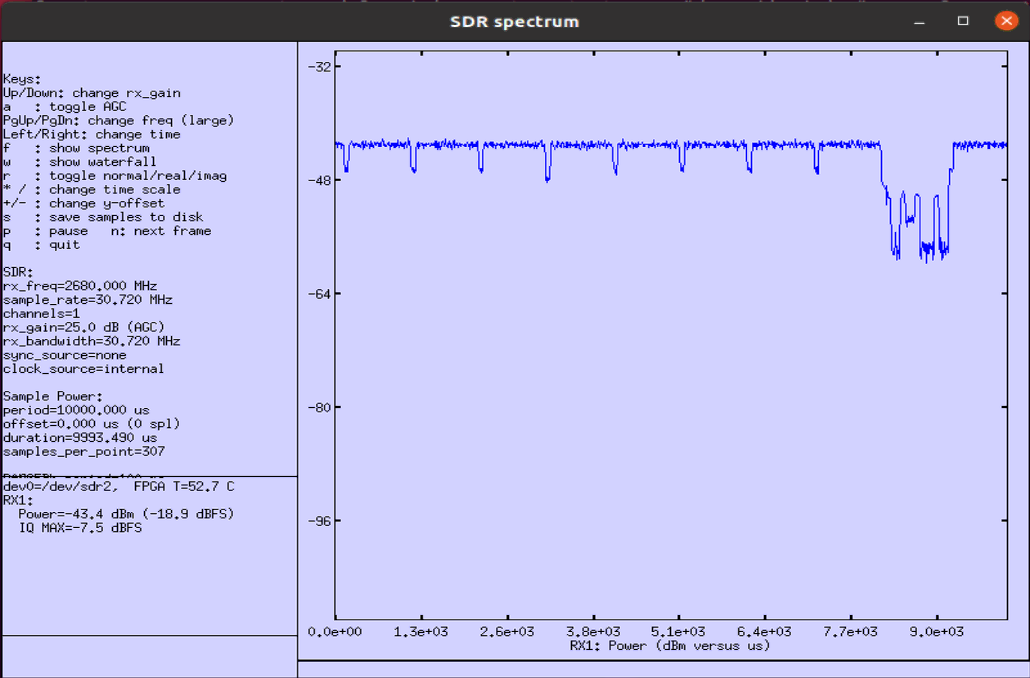
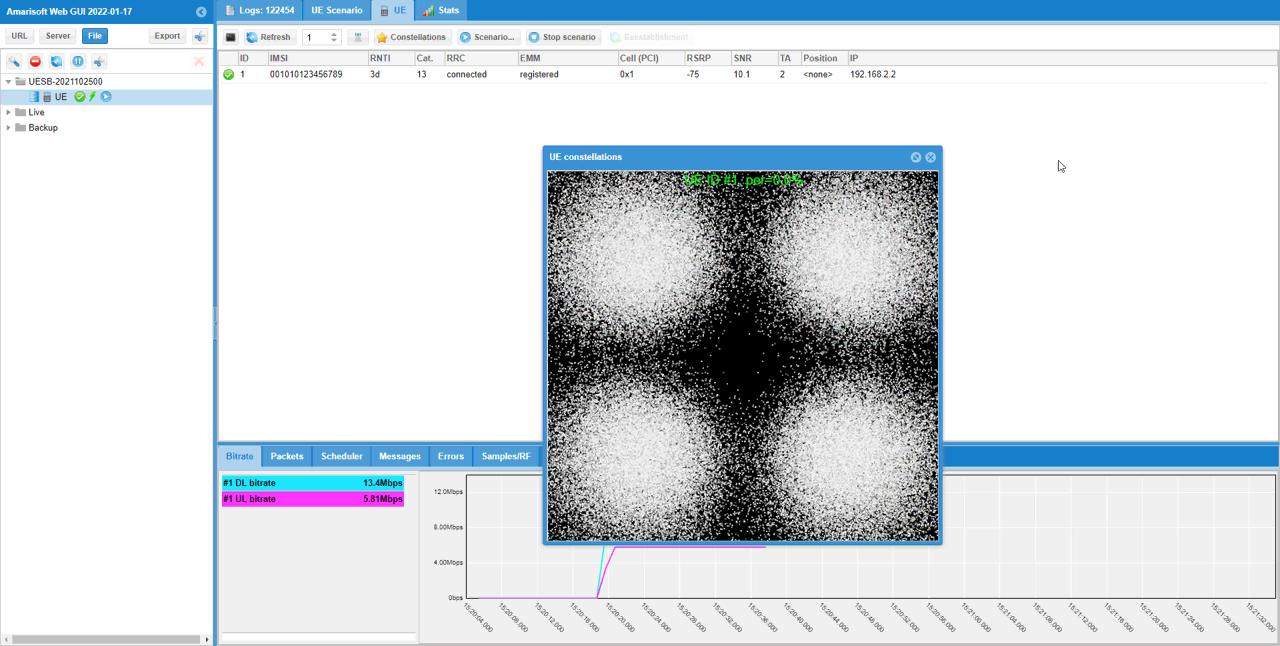
noise_level = -10
This test shows the case where adding -30dB AWGN to the signal carrying QAM data.
In terms of the constellation, -30dB AWGN shows almost no negative impact on the signal decoding since per shows 0.0%. This is the signal capture and analysis from the reciever (in this case Amarisoft UEsim) using WebGUI.
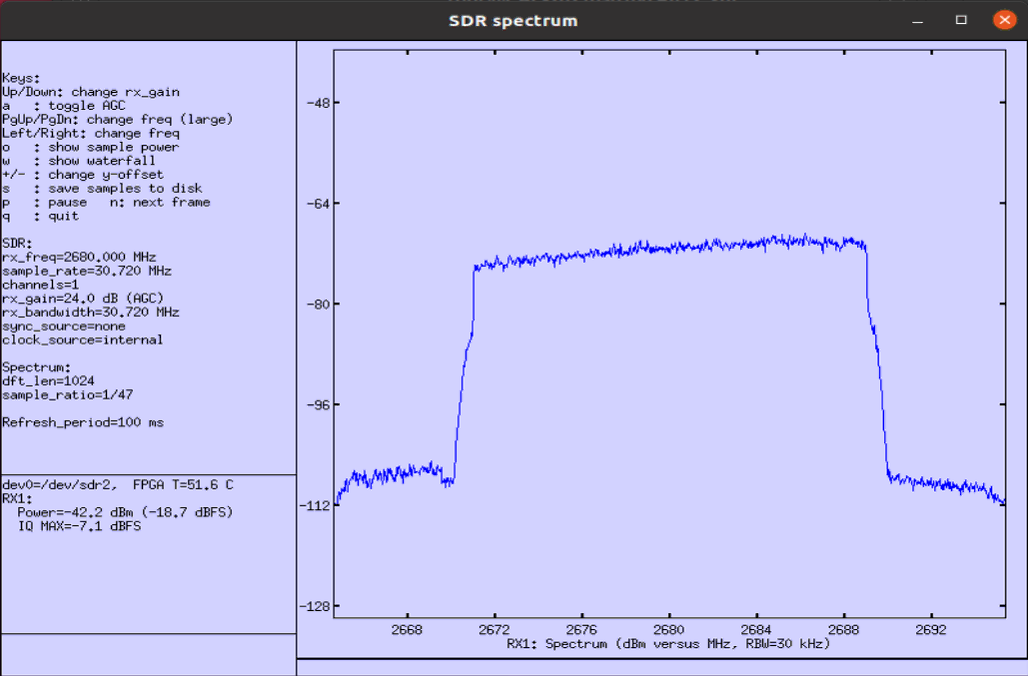
This is the capture of the signal using the built-in spectrum analyzer (called sdr_spectrum) as explained here.
Following shows frequency spectrum. Usually it would not get much of noticiable changes in frequency spectrum with AWGN because the level of AWGN is much smaller comparing to the signal. If the AWGN is so high to be noticiable on spectrum, it would be highly likely that the connection would be broken and call drop would happen).
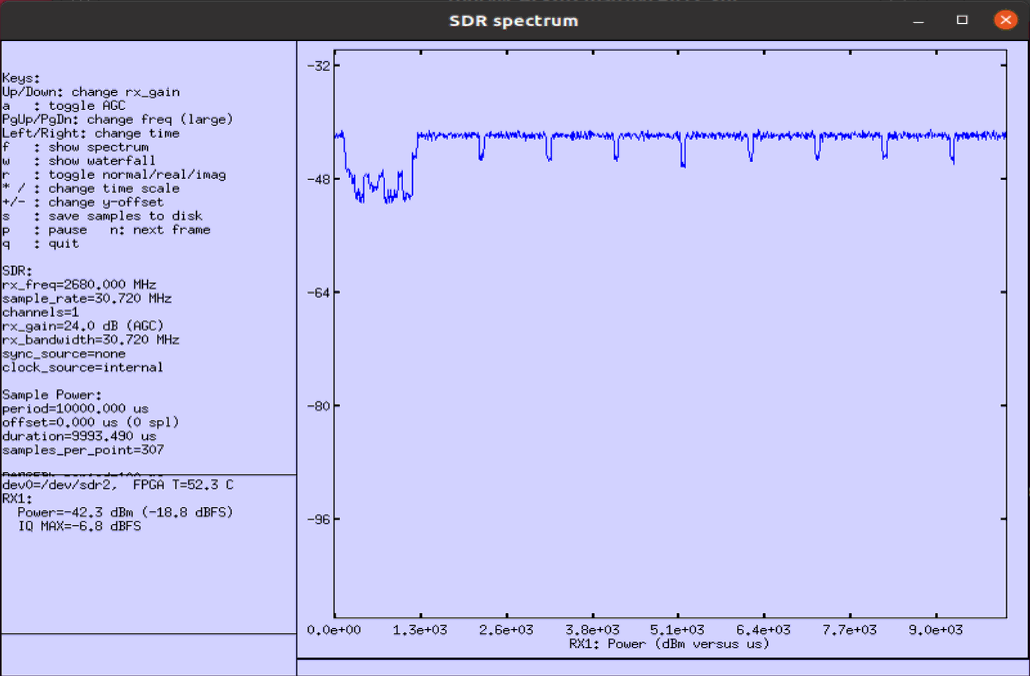
Following shows time domain plot. Usually it would not get much of noticiable changes in frequency spectrum with AWGN because the level of AWGN is much smaller comparing to the signal and the amlitude is represnted in log scale. If the AWGN is so high to be noticiable on spectrum, it would be highly likely that the connection would be broken and call drop would happen).
Test 2 : Single Path - Rayleigh
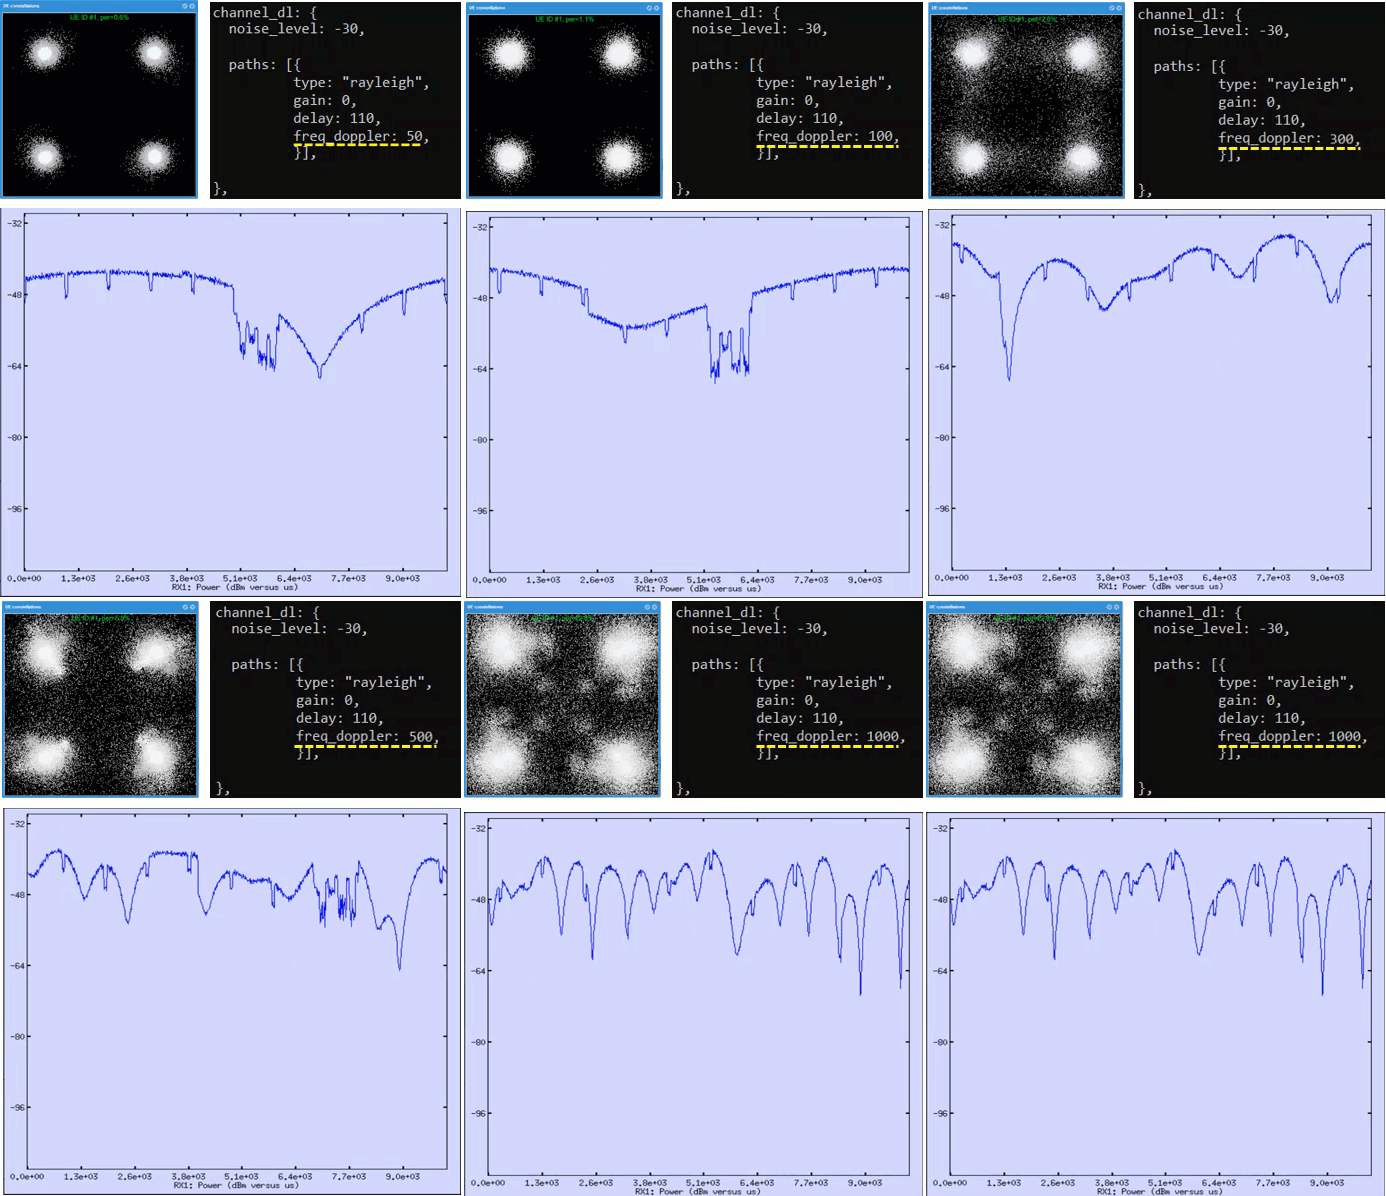
In this test, I want to show you how to apply fading to the transmit signal from callbox (eNB or gNB). For the simplicity and to better visualize the effect of each of the fading components, I applied only one Rayleigh channel(one tab) to the signal. In this test, I am trying to show the effect of doppler shift on the configured fading channel, but you may try changing other parameters as per your necessity.
In short, I wanted to share the intution as shown below.
Following is the basic configuration in enb-chan-sim-ref.cfg and only channel_dl:{ } part will be changed for each of the test and all other parts would remain same.


freq_doppler = 50
This test shows the case where 50Hz doppler shift is applied.
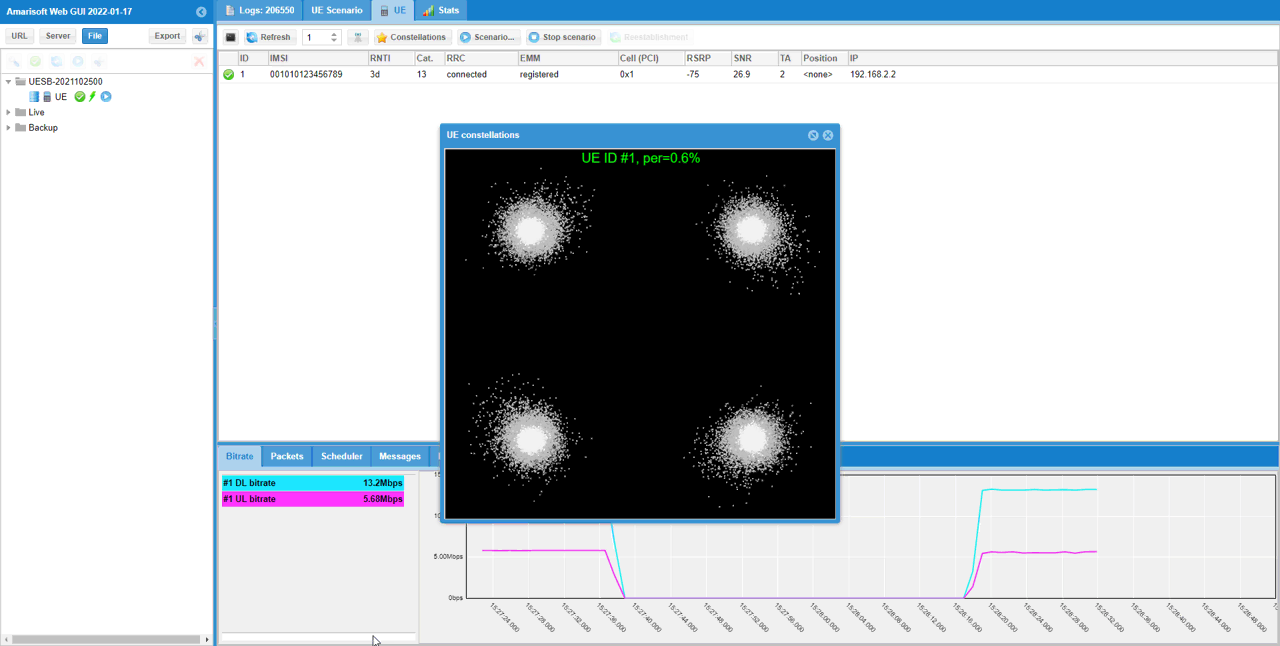
In terms of the constellation shown in WebGUI, you may not see the noticiable fading effect because this constellation is obtained after equalization. In this case, considerable part of random amplitude variation due to the fading would be reflected on the constellation but frequency drift due to doppler shift would not appear clearly since those impacts get corrected (compensated) by equalizer.
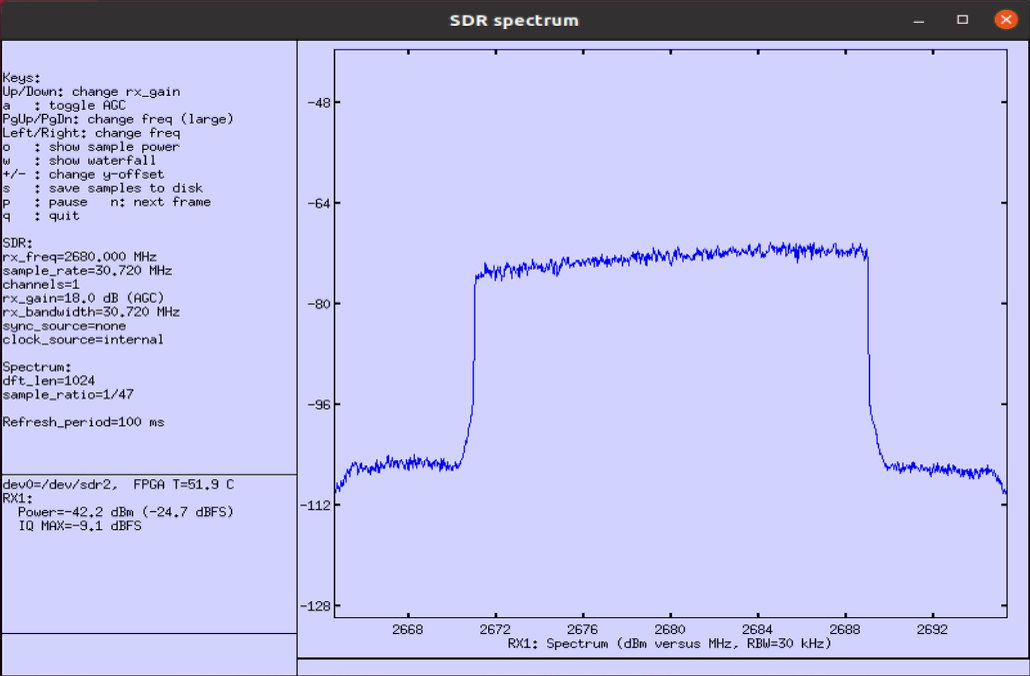
This is the capture of the signal using the built-in spectrum analyzer (called sdr_spectrum) as explained here.
Following shows frequency spectrum. You would see a little bit of larger variation in the amplitude, but not an huge variation in frequency spectrum.
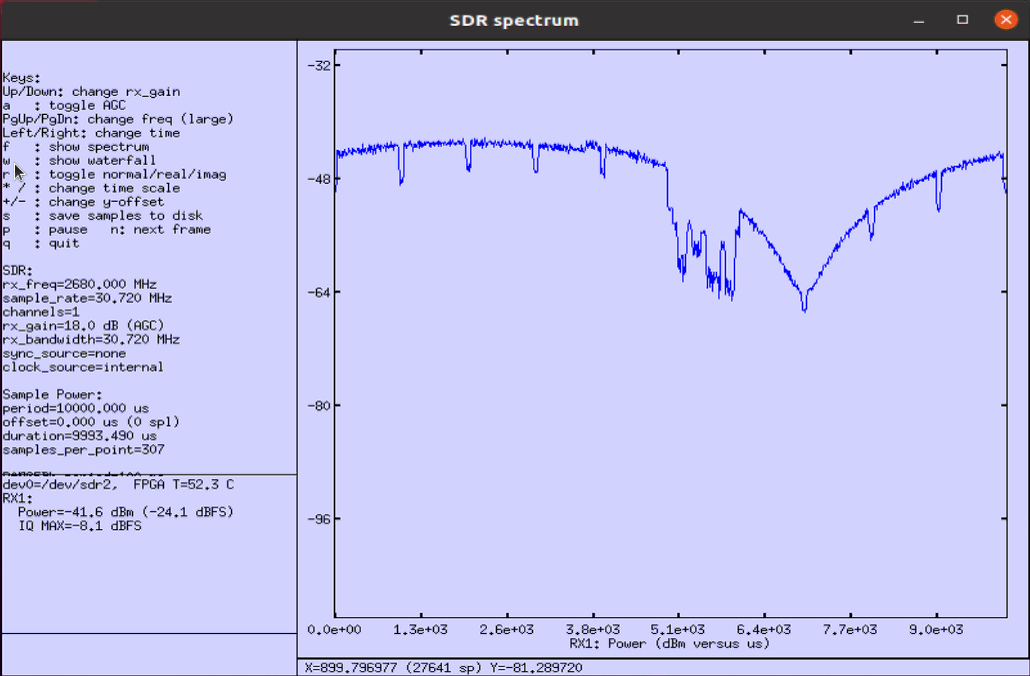
Following shows time domain plot. You would get more noticiable difference (effect) of fading in time domain plot.
freq_doppler = 100
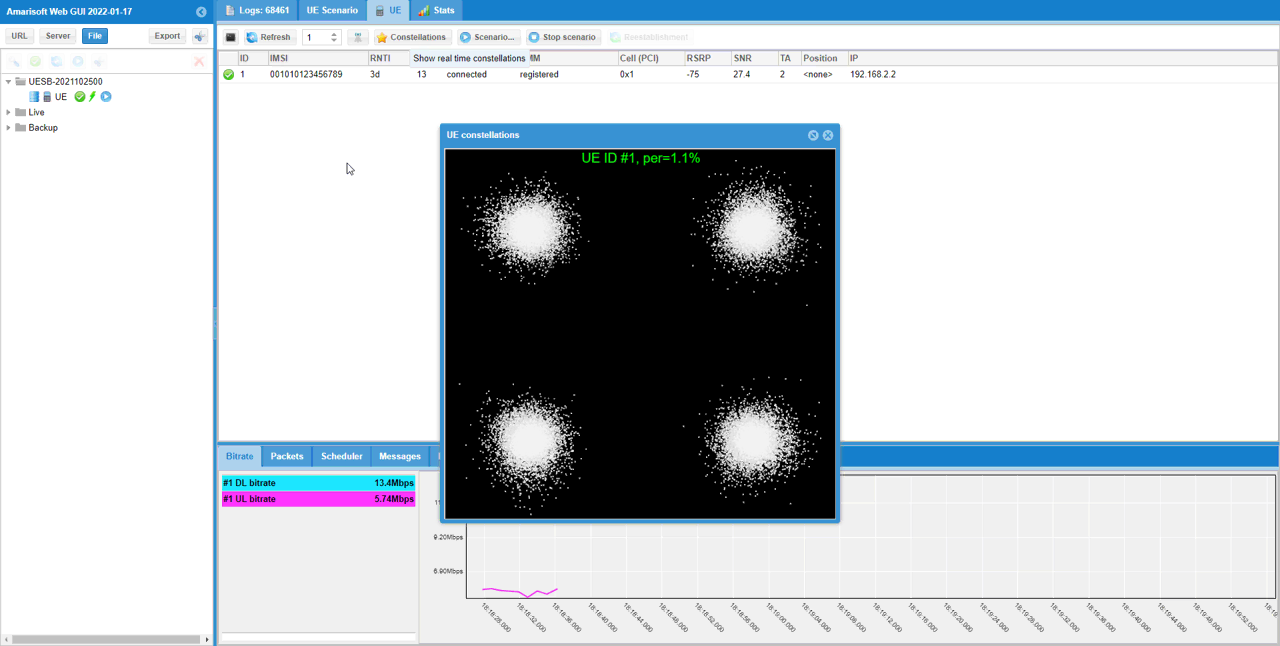
This test shows the case where 100Hz doppler shift is applied.
In terms of the constellation shown in WebGUI, you may not see the noticiable fading effect because this constellation is obtained after equalization. In this case, considerable part of random amplitude variation due to the fading would be reflected on the constellation but frequency drift due to doppler shift would not appear clearly since those impacts get corrected (compensated) by equalizer.
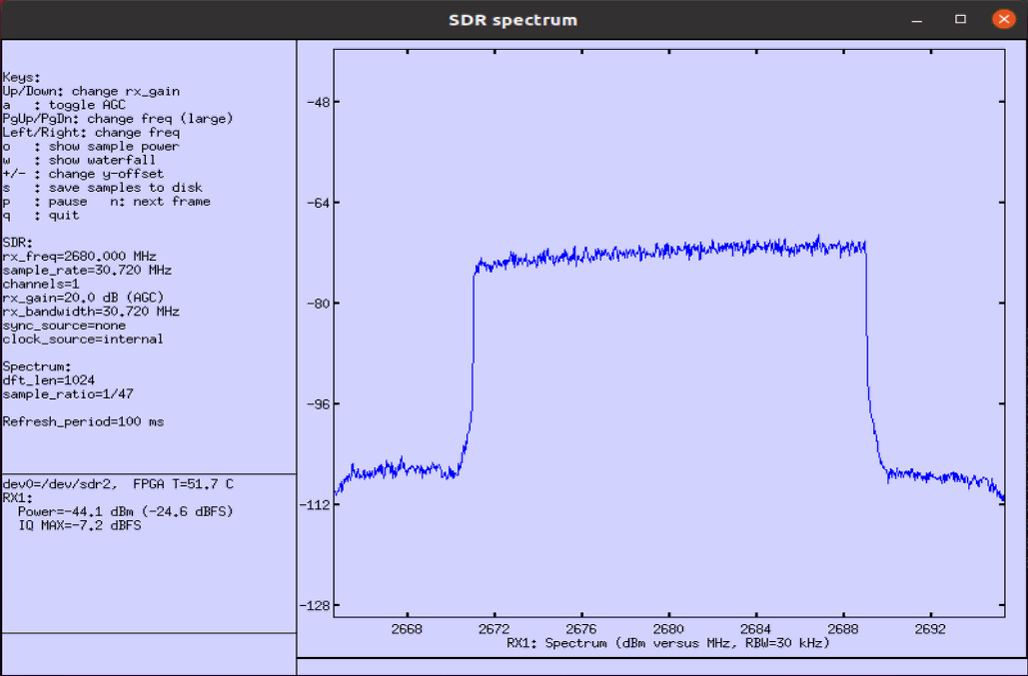
This is the capture of the signal using the built-in spectrum analyzer (called sdr_spectrum) as explained here.
Following shows frequency spectrum. You would see a little bit of larger variation in the amplitude, but not an huge variation in frequency spectrum.
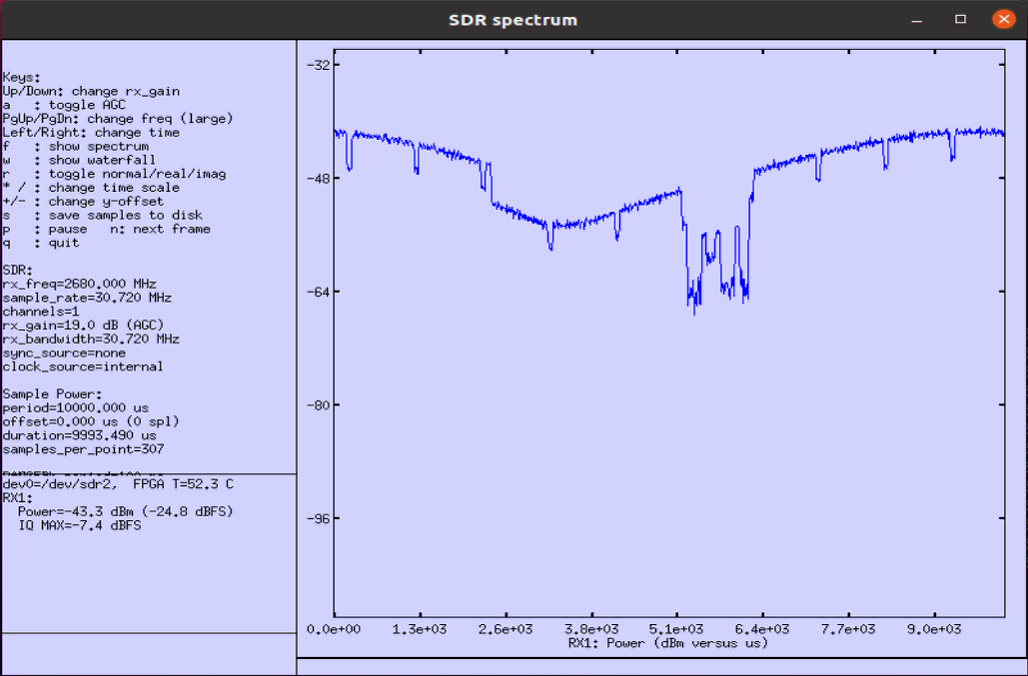
Following shows time domain plot. You would get more noticiable difference (effect) of fading in time domain plot. Compare this with the result of the previous test and you would notice the effect of doppler shift more intuitively.
freq_doppler = 200
This test shows the case where 200Hz doppler shift is applied.
In terms of the constellation shown in WebGUI, you may not see the noticiable fading effect because this constellation is obtained after equalization. In this case, considerable part of random amplitude variation due to the fading would be reflected on the constellation but frequency drift due to doppler shift would not appear clearly since those impacts get corrected (compensated) by equalizer.
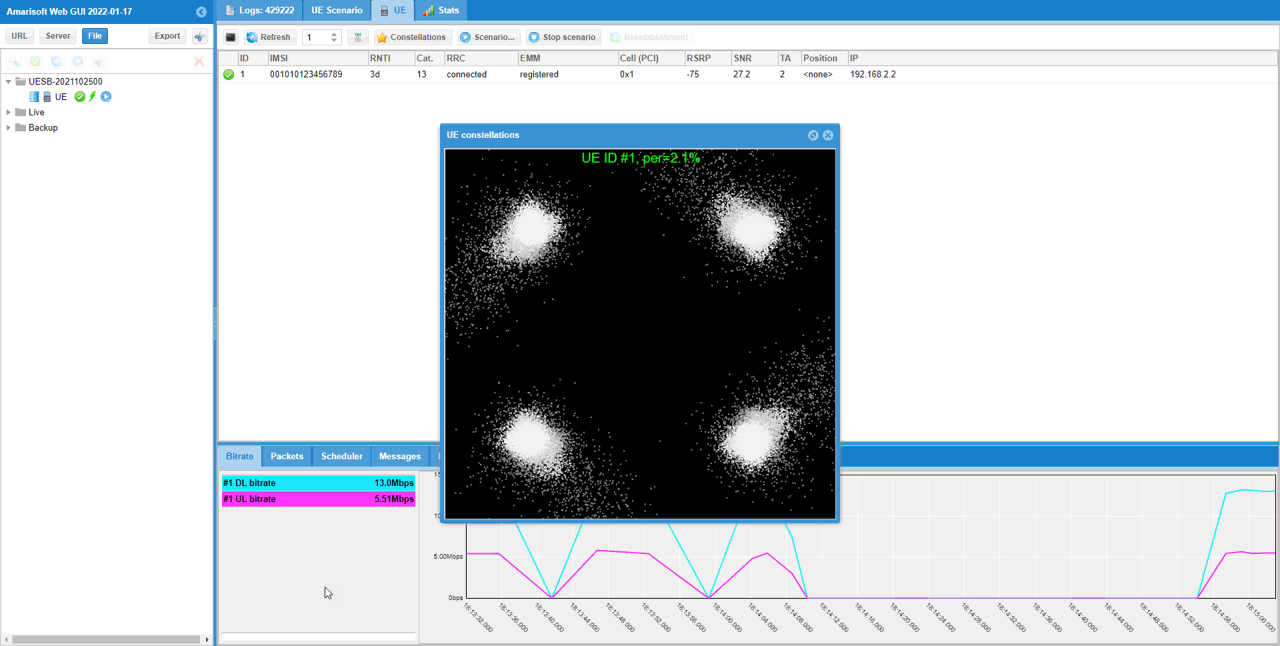
This is the capture of the signal using the built-in spectrum analyzer (called sdr_spectrum) as explained here.
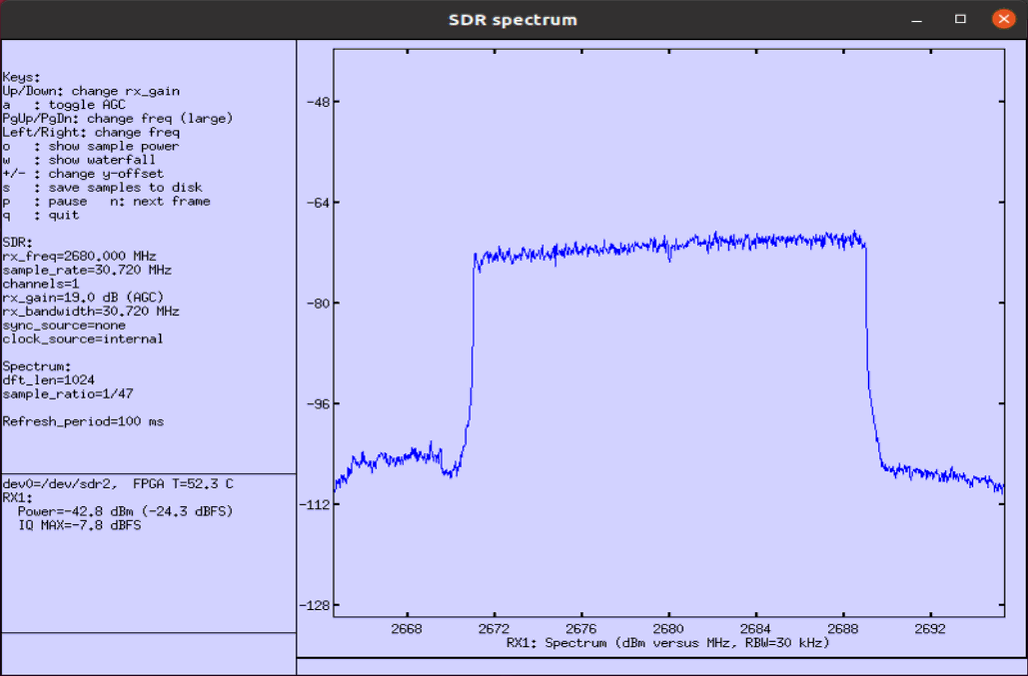
Following shows frequency spectrum. You would see a little bit of larger variation in the amplitude, but not an huge variation in frequency spectrum.
Following shows time domain plot. You would get more noticiable difference (effect) of fading in time domain plot. Compare this with the result of the previous test and you would notice the effect of doppler shift more intuitively.
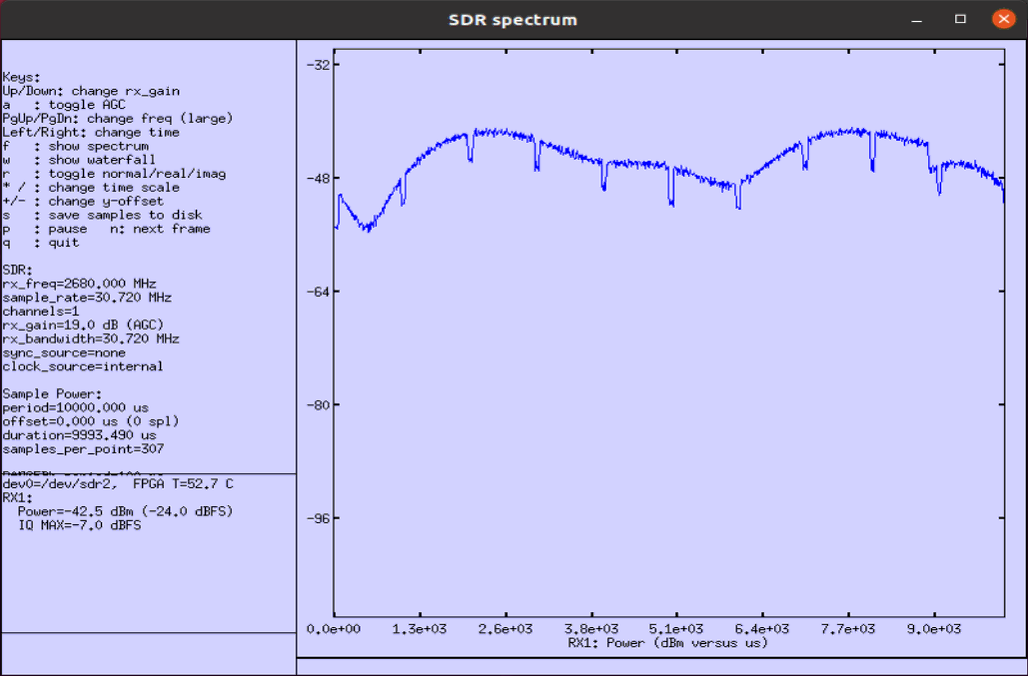
freq_doppler = 300
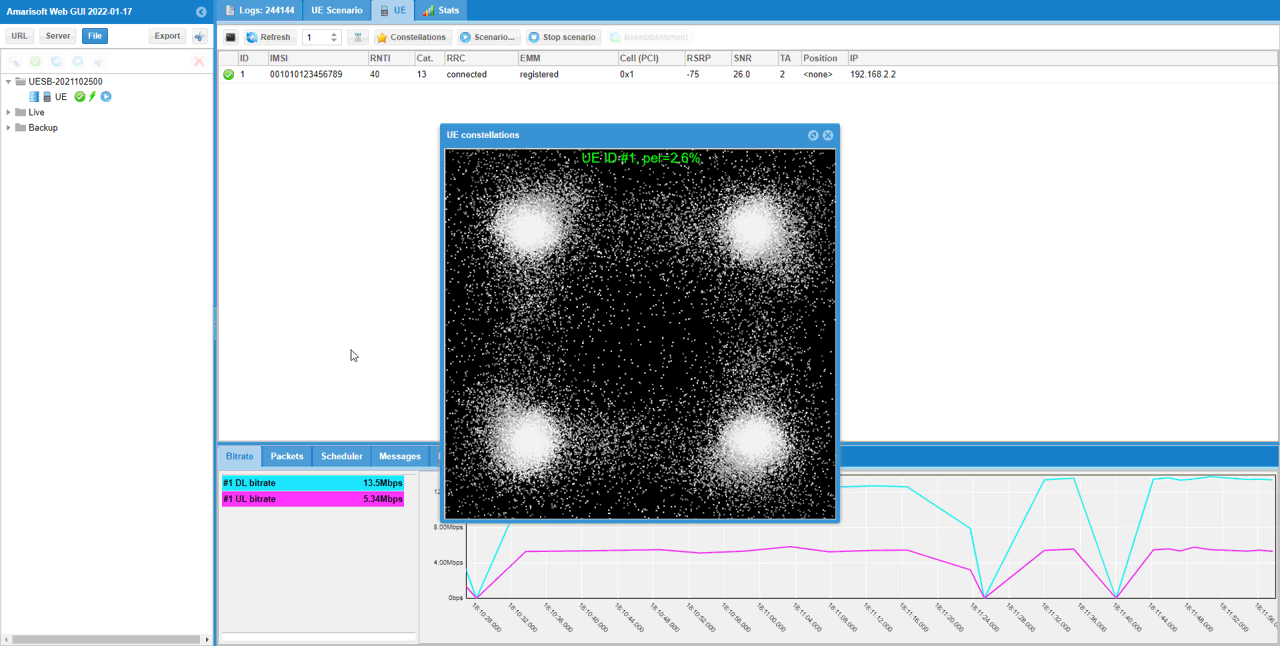
This test shows the case where 300Hz doppler shift is applied.
In terms of the constellation shown in WebGUI, you may not see the noticiable fading effect because this constellation is obtained after equalization. In this case, considerable part of random amplitude variation due to the fading would be reflected on the constellation but frequency drift due to doppler shift would not appear clearly since those impacts get corrected (compensated) by equalizer.
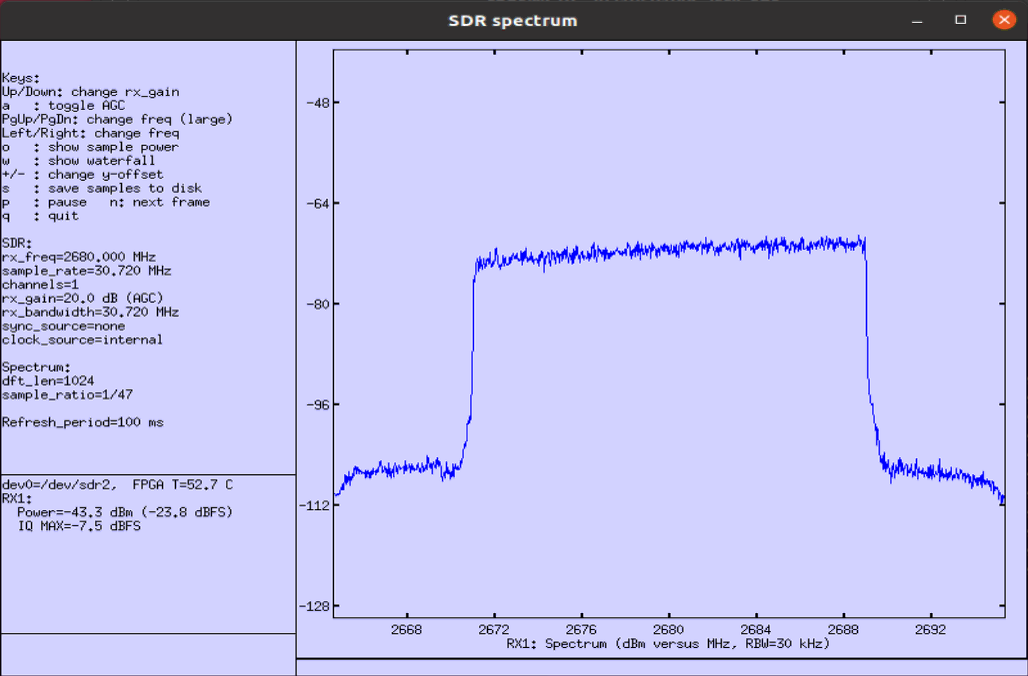
This is the capture of the signal using the built-in spectrum analyzer (called sdr_spectrum) as explained here.
Following shows frequency spectrum. You would see a little bit of larger variation in the amplitude, but not an huge variation in frequency spectrum.
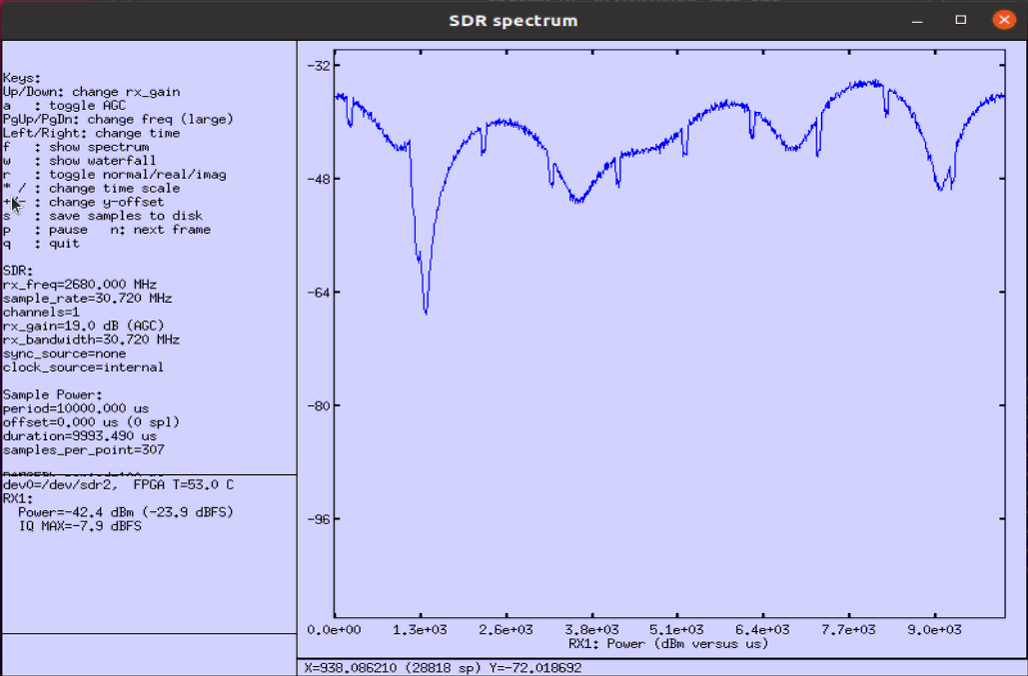
Following shows time domain plot. You would get more noticiable difference (effect) of fading in time domain plot. Compare this with the result of the previous test and you would notice the effect of doppler shift more intuitively.
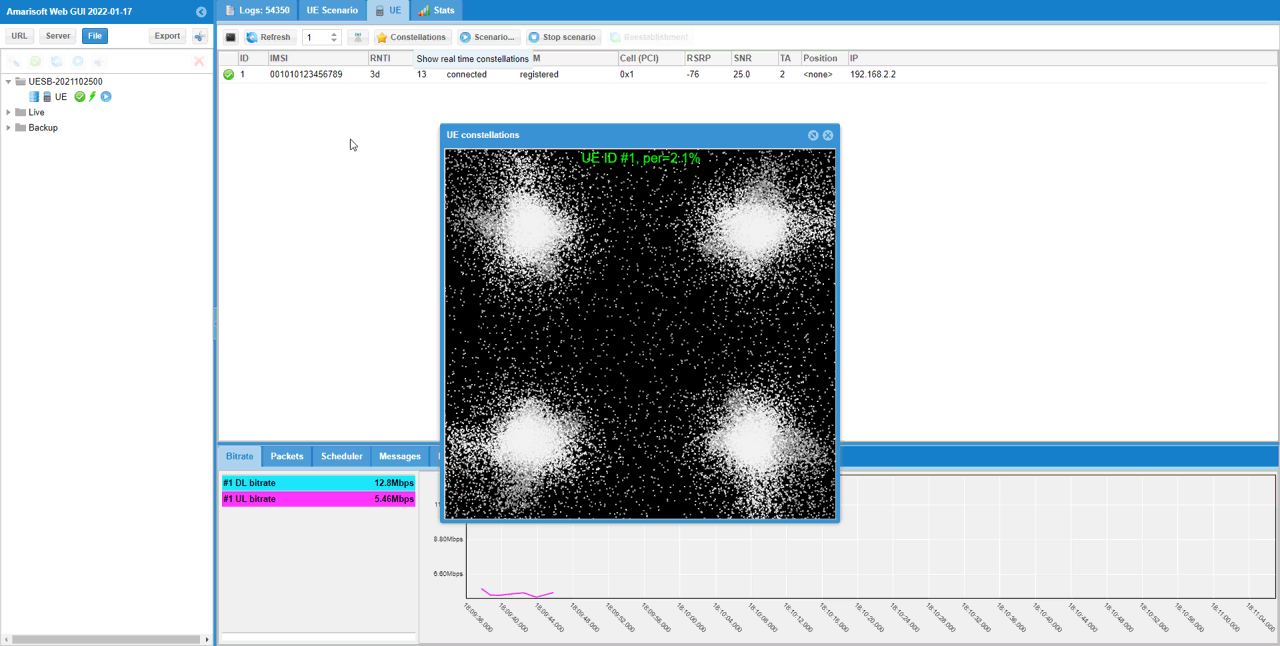
freq_doppler = 400
This test shows the case where 400Hz doppler shift is applied.
In terms of the constellation shown in WebGUI, you may not see the noticiable fading effect because this constellation is obtained after equalization. In this case, considerable part of random amplitude variation due to the fading would be reflected on the constellation but frequency drift due to doppler shift would not appear clearly since those impacts get corrected (compensated) by equalizer.
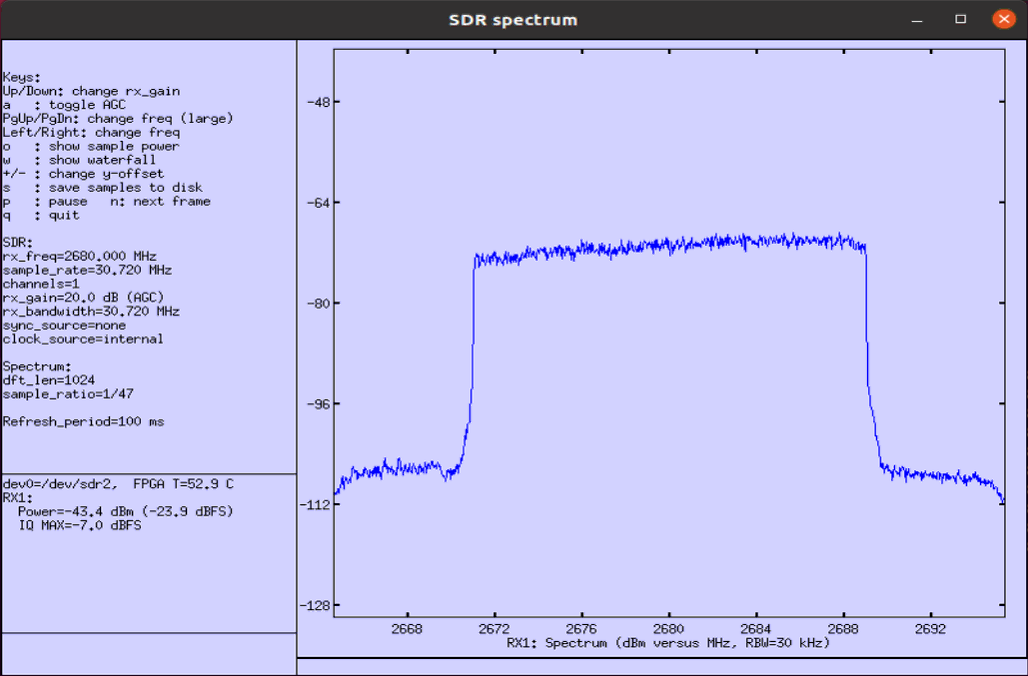
This is the capture of the signal using the built-in spectrum analyzer (called sdr_spectrum) as explained here.
Following shows frequency spectrum. You would see a little bit of larger variation in the amplitude, but not an huge variation in frequency spectrum.
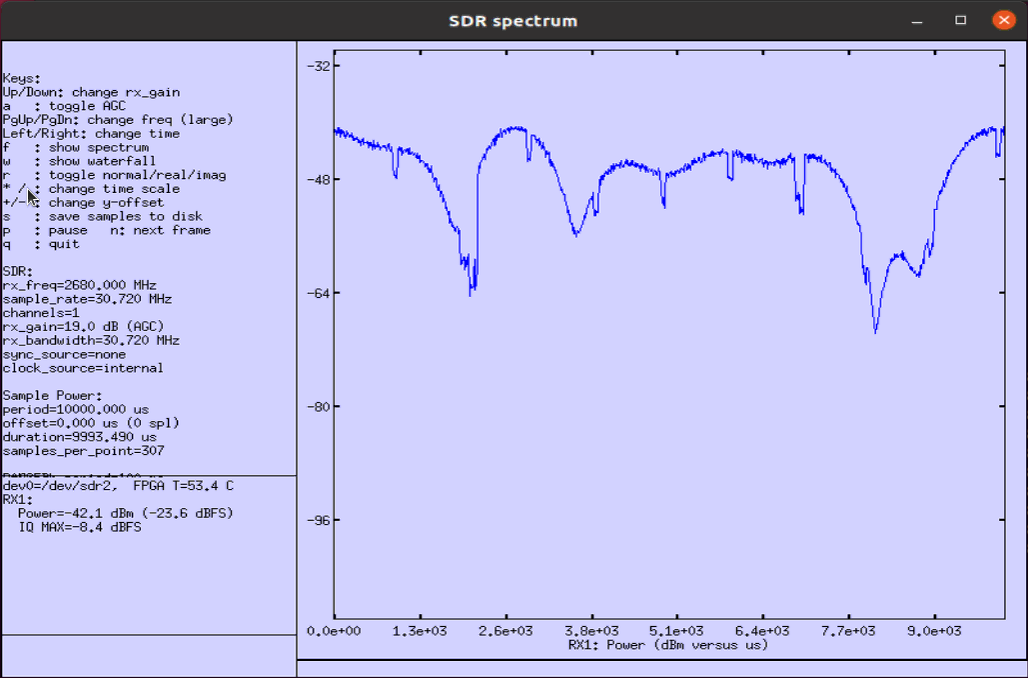
Following shows time domain plot. You would get more noticiable difference (effect) of fading in time domain plot. Compare this with the result of the previous test and you would notice the effect of doppler shift more intuitively.
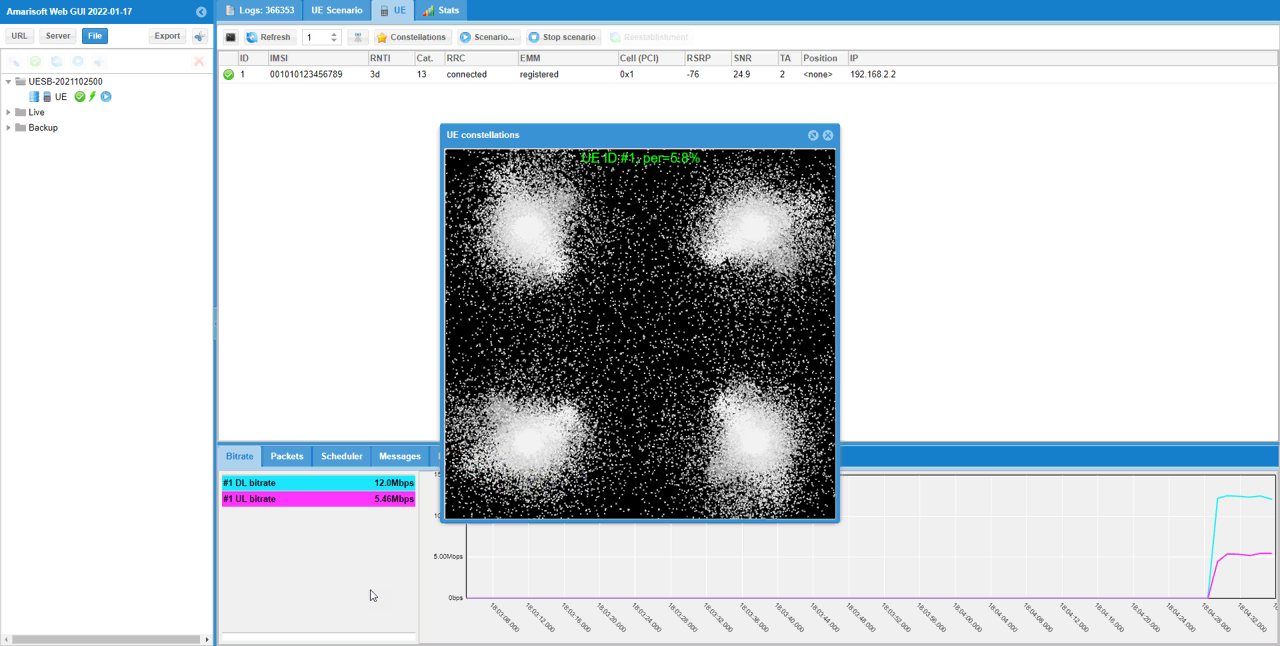
freq_doppler = 500
This test shows the case where 500Hz doppler shift is applied.
In terms of the constellation shown in WebGUI, you may not see the noticiable fading effect because this constellation is obtained after equalization. In this case, considerable part of random amplitude variation due to the fading would be reflected on the constellation but frequency drift due to doppler shift would not appear clearly since those impacts get corrected (compensated) by equalizer.
This is the capture of the signal using the built-in spectrum analyzer (called sdr_spectrum) as explained here.
Following shows frequency spectrum. You would see a little bit of larger variation in the amplitude, but not an huge variation in frequency spectrum.
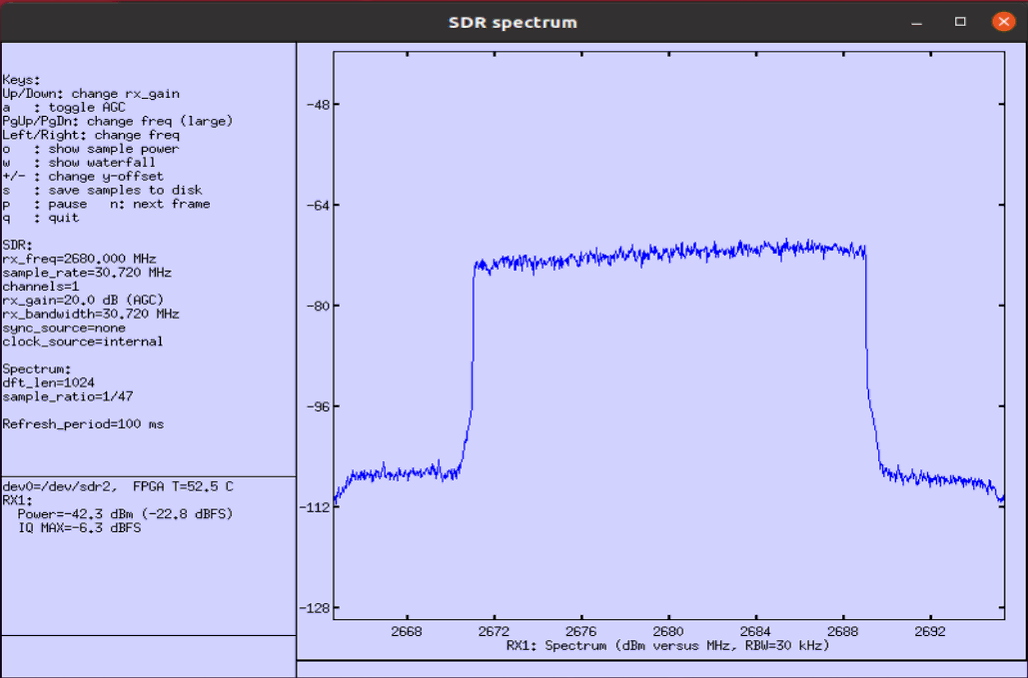
Following shows time domain plot. You would get more noticiable difference (effect) of fading in time domain plot. Compare this with the result of the previous test and you would notice the effect of doppler shift more intuitively.
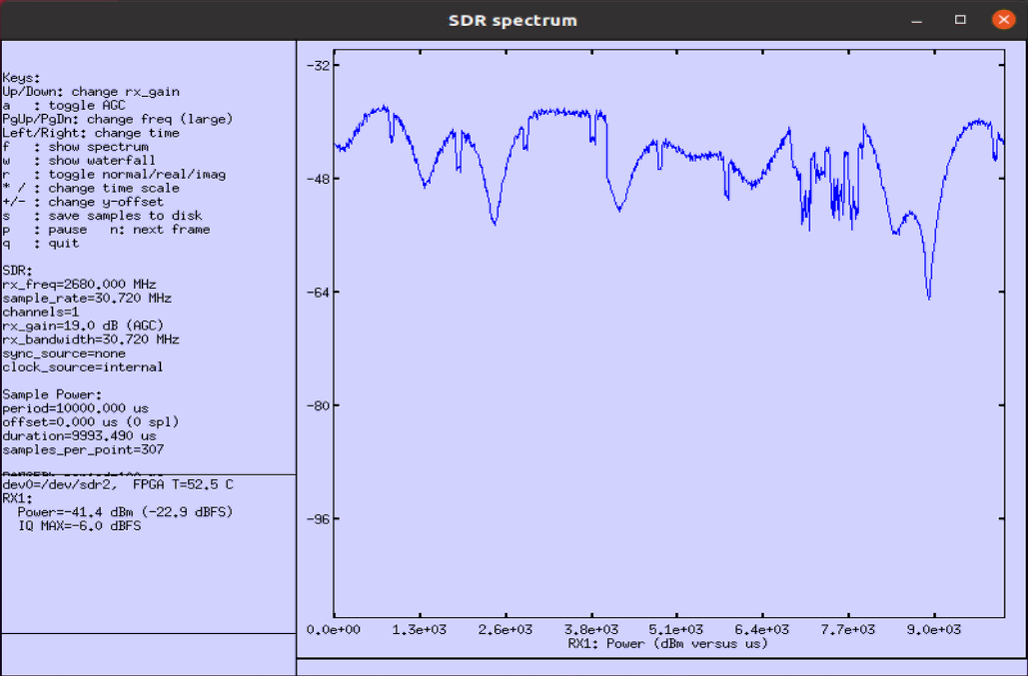
freq_doppler = 1000
This test shows the case where 1000Hz doppler shift is applied.
In terms of the constellation shown in WebGUI, you may not see the noticiable fading effect because this constellation is obtained after equalization. In this case, considerable part of random amplitude variation due to the fading would be reflected on the constellation but frequency drift due to doppler shift would not appear clearly since those impacts get corrected (compensated) by equalizer.
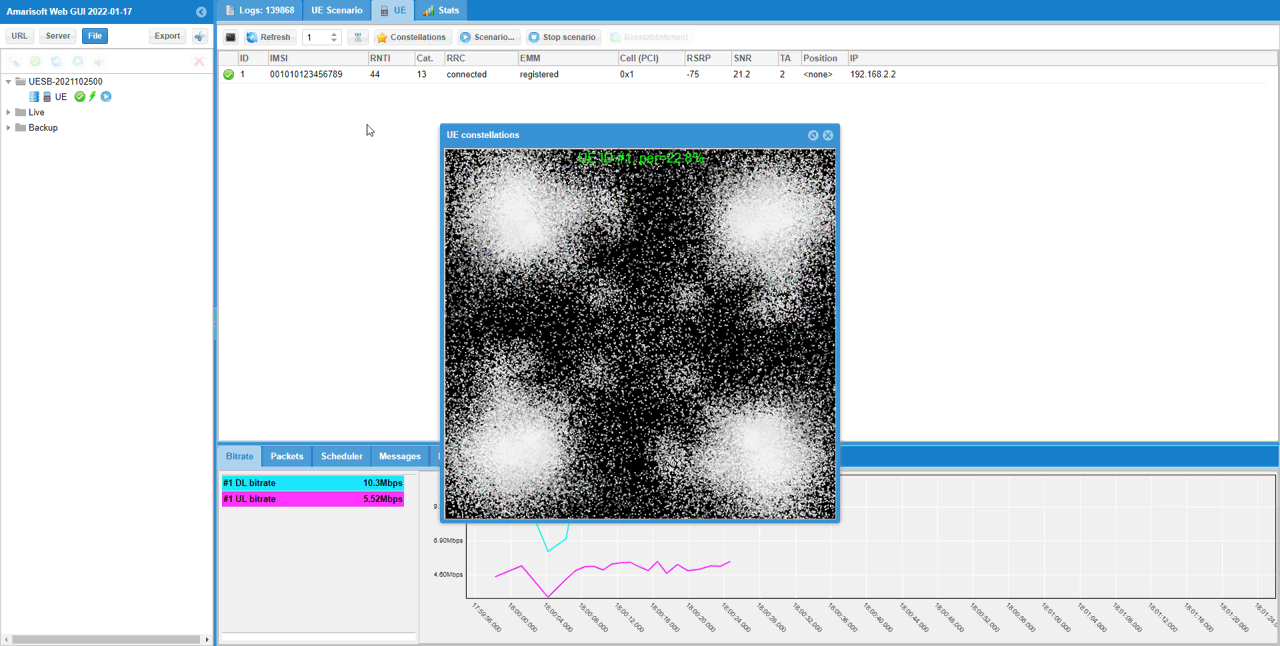
This is the capture of the signal using the built-in spectrum analyzer (called sdr_spectrum) as explained here.
Following shows frequency spectrum. You would see a little bit of larger variation in the amplitude, but not an huge variation in frequency spectrum.
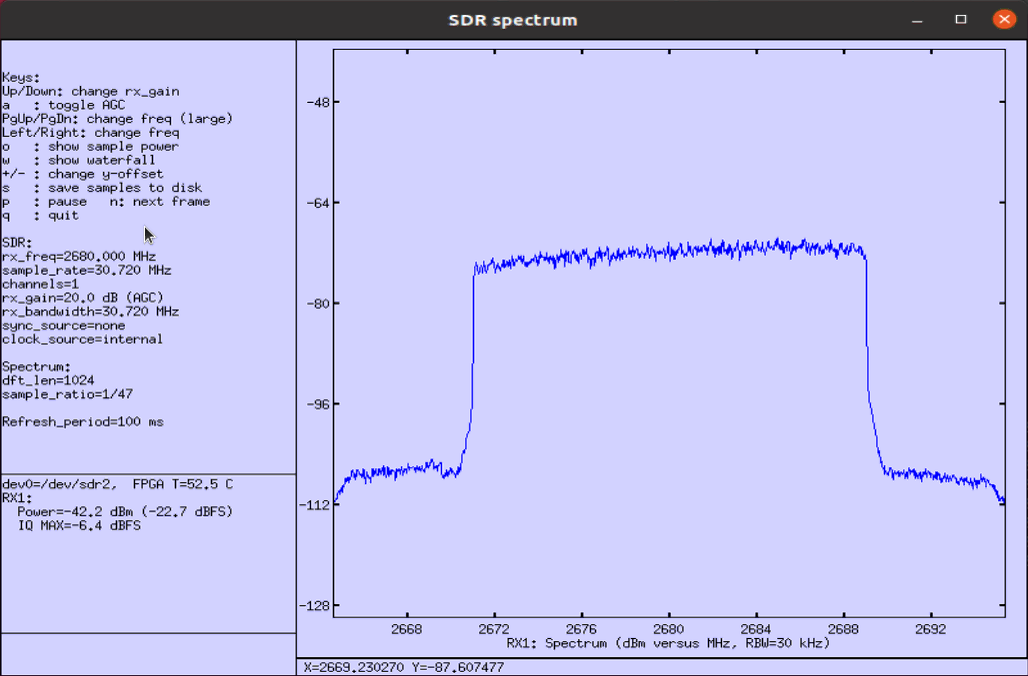
Following shows time domain plot. You would get more noticiable difference (effect) of fading in time domain plot. Compare this with the result of the previous test and you would notice the effect of doppler shift more intuitively.
Test 3 : Multi Path - Rayleigh
In this test, I want to show you how to apply fading to the transmit signal from callbox (eNB or gNB). Basically the usage is similar to the previous test, but in this test I will add more tabs in fading profile. In this way, you may apply the faiding profile similar to what is defined in 3GPP specification. In this test, I am trying to show the effect of doppler shift on the configured fading channel, but you may try changing other parameters as per your necessity.
Following is the basic configuration in enb-chan-sim-ref.cfg and only channel_dl:{ } part will be changed for each of the test and all other parts would remain same.

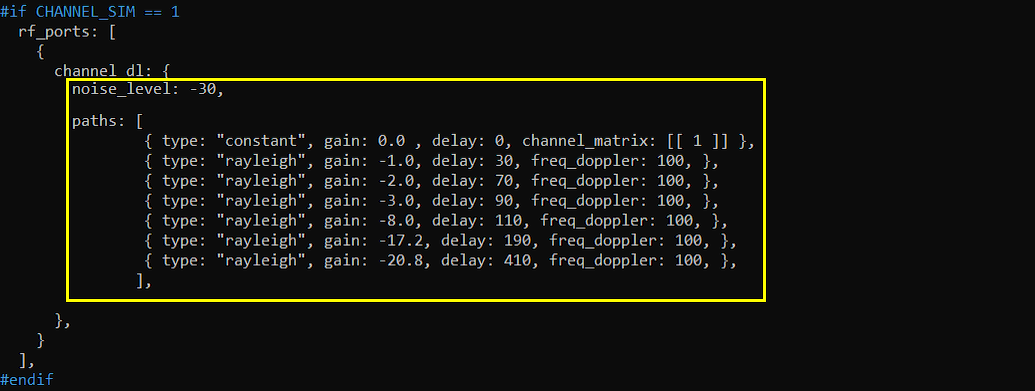
{ type: "constant", gain: 0.0 , delay: 0, channel_matrix: [[ 1,0 ],[0,1]] },
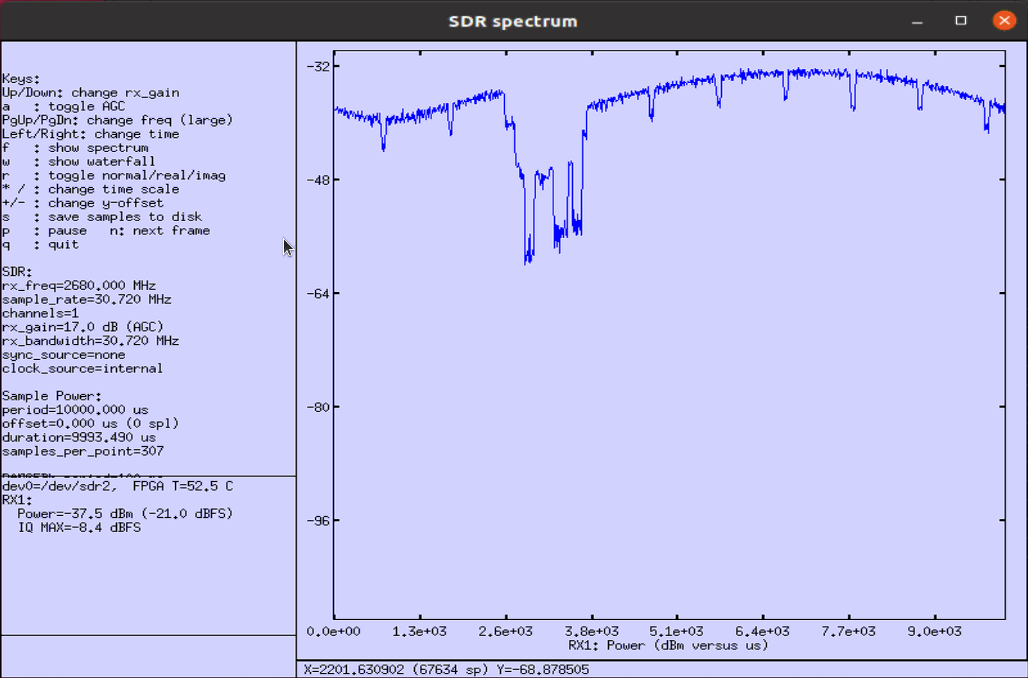
freq_doppler = 100
This test shows the case where 100Hz doppler shift is applied. I applied the same doppler shift (i.e, freq_doppler) to every rayleigh component.
In terms of the constellation shown in WebGUI, you may not see the noticiable fading effect because this constellation is obtained after equalization. In this case, considerable part of random amplitude variation due to the fading would be reflected on the constellation but frequency drift due to doppler shift would not appear clearly since those impacts get corrected (compensated) by equalizer.
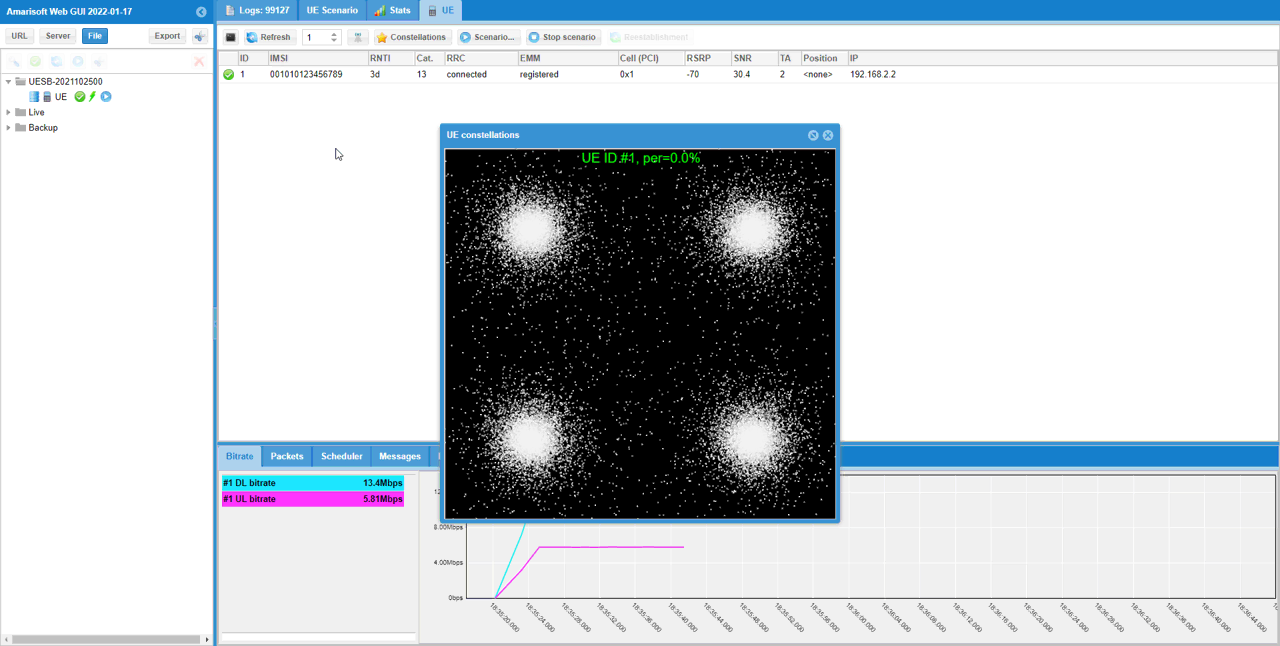
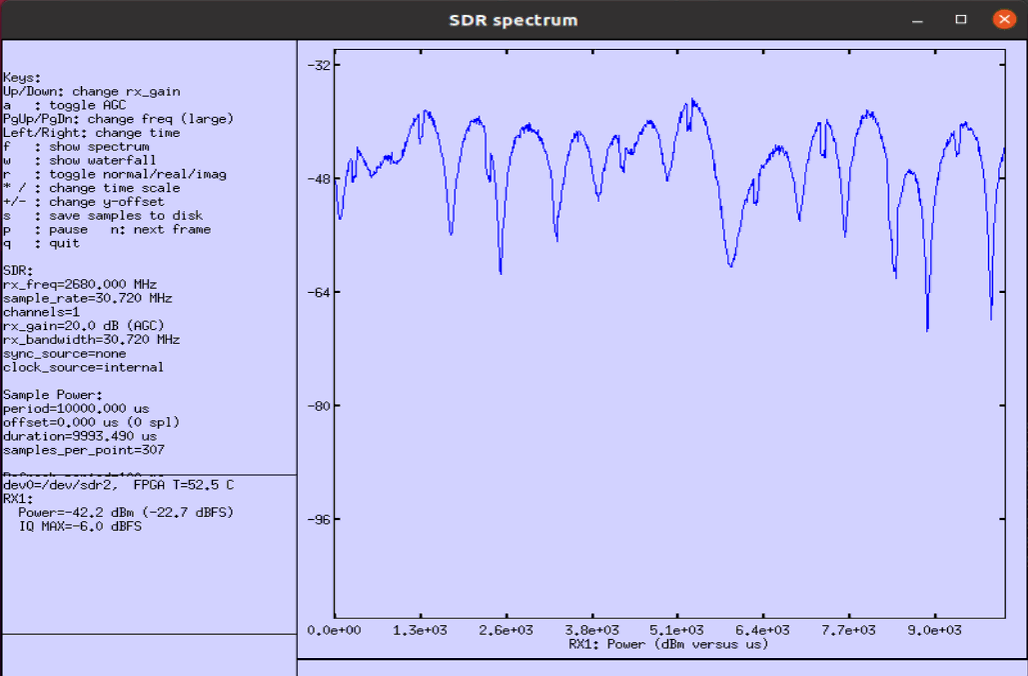
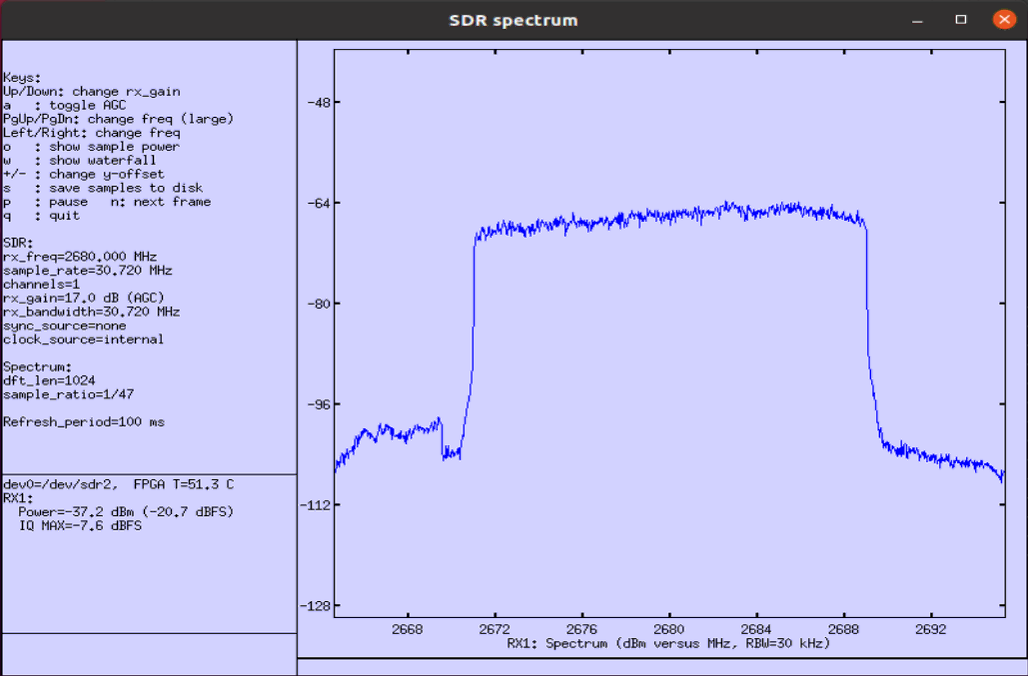
This is the capture of the signal using the built-in spectrum analyzer (called sdr_spectrum) as explained here.
Following shows frequency spectrum. You would see a little bit of larger variation in the amplitude, but not an huge variation in frequency spectrum.
Following shows time domain plot. You would get more noticiable difference (effect) of fading in time domain plot.
freq_doppler = 1000
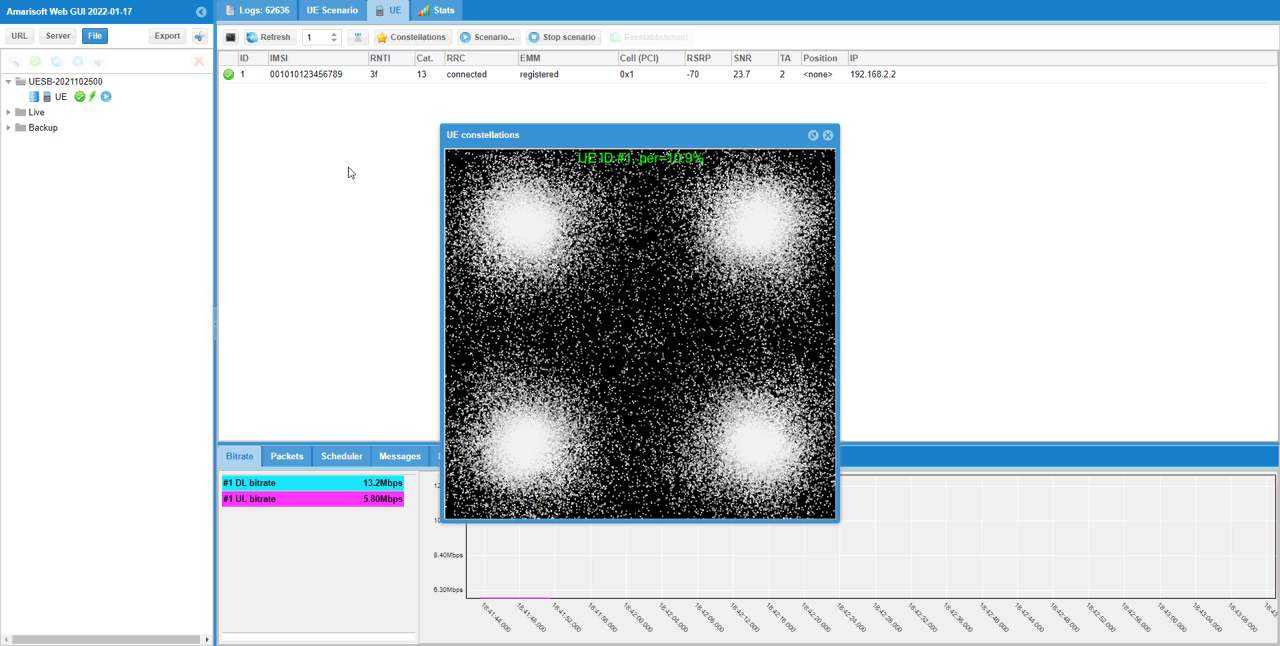
This test shows the case where 1000Hz doppler shift is applied. I applied the same doppler shift (i.e, freq_doppler) to every rayleigh component.
In terms of the constellation shown in WebGUI, you may not see the noticiable fading effect because this constellation is obtained after equalization. In this case, considerable part of random amplitude variation due to the fading would be reflected on the constellation but frequency drift due to doppler shift would not appear clearly since those impacts get corrected (compensated) by equalizer.
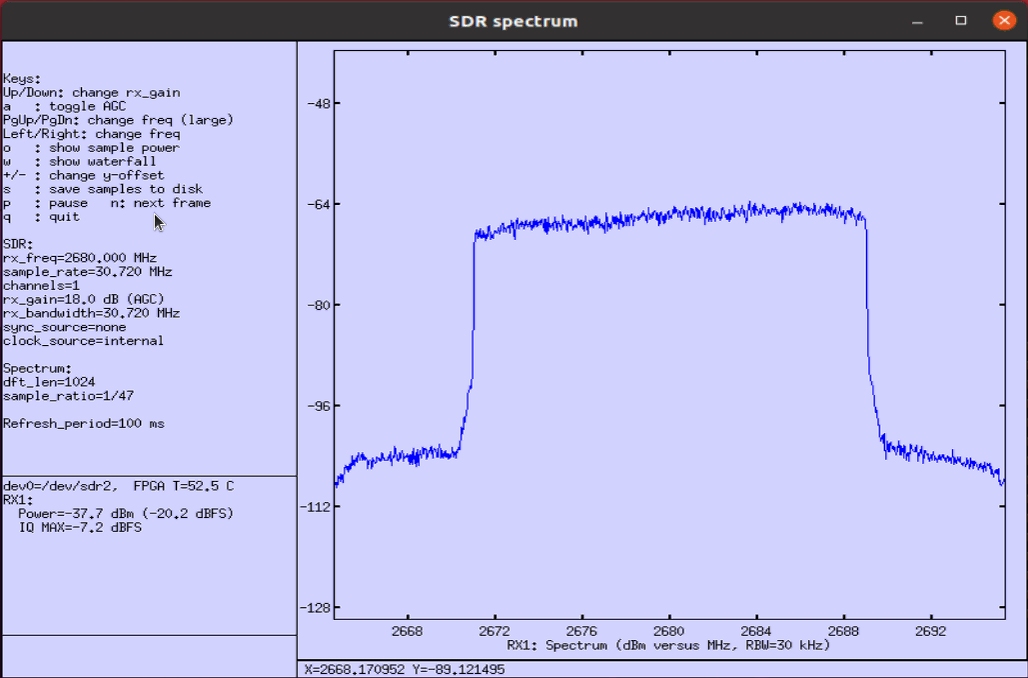
This is the capture of the signal using the built-in spectrum analyzer (called sdr_spectrum) as explained here.
Following shows frequency spectrum. You would see a little bit of larger variation in the amplitude, but not an huge variation in frequency spectrum.
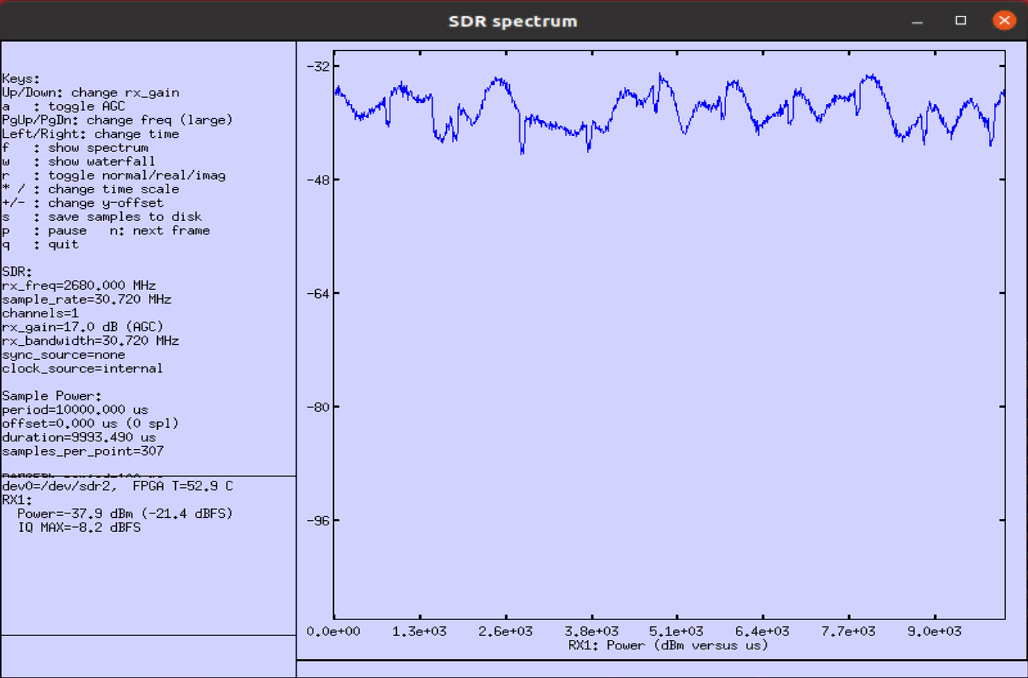
Following shows time domain plot. You would get more noticiable difference (effect) of fading in time domain plot. Compare this with the result of the previous test and you would notice the effect of doppler shift more intuitively
Test 4 : 3GPP Profile
Basically this test is similar to previous test trying to apply complicated channel profile, something like the profile defined in 3GPP specification. But in case of 3GPP profile, we provide a configuration parameter to allow you to apply the profile in very simple way.
Following is the basic configuration in enb-chan-sim-ref.cfg and only channel_dl:{ } part will be changed for each of the test and all other parts would remain same.


EVA, freq_doppler = 1000
This test shows the case where EVA profile and 1000Hz doppler shift is applied.
In terms of the constellation shown in WebGUI, you may not see the noticiable fading effect because this constellation is obtained after equalization. In this case, considerable part of random amplitude variation due to the fading would be reflected on the constellation but frequency drift due to doppler shift would not appear clearly since those impacts get corrected (compensated) by equalizer.
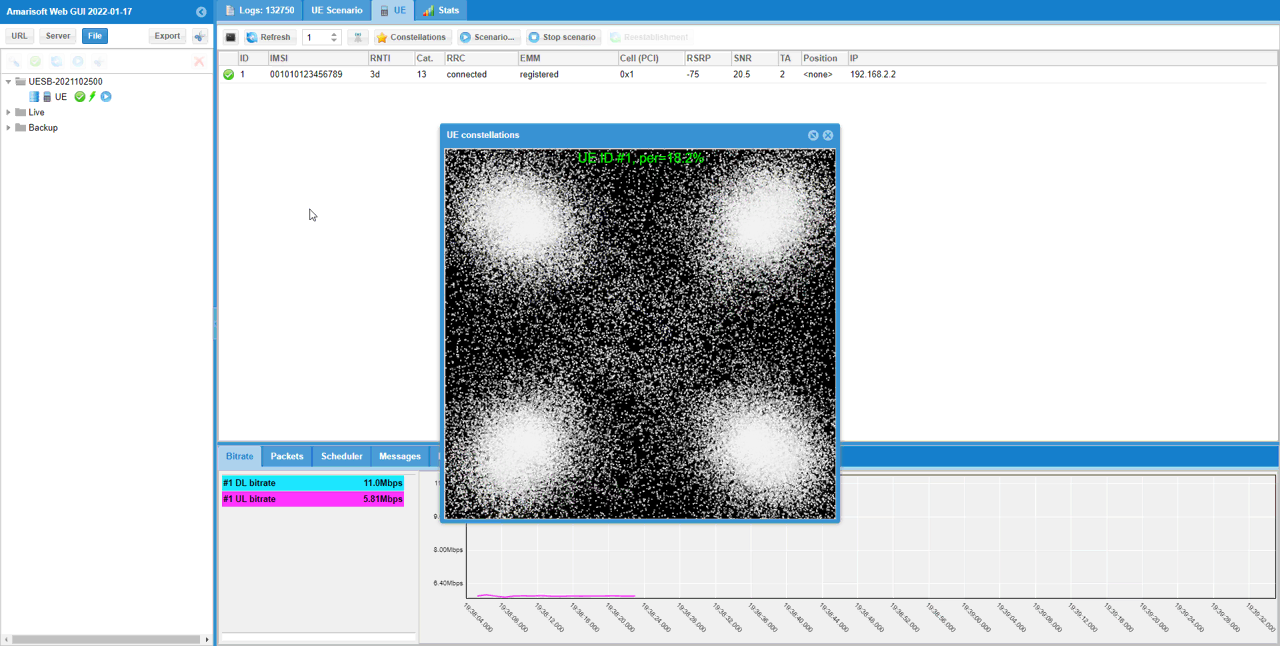
This is the capture of the signal using the built-in spectrum analyzer (called sdr_spectrum) as explained here.
Following shows frequency spectrum. You would see a little bit of larger variation in the amplitude, but not an huge variation in frequency spectrum.
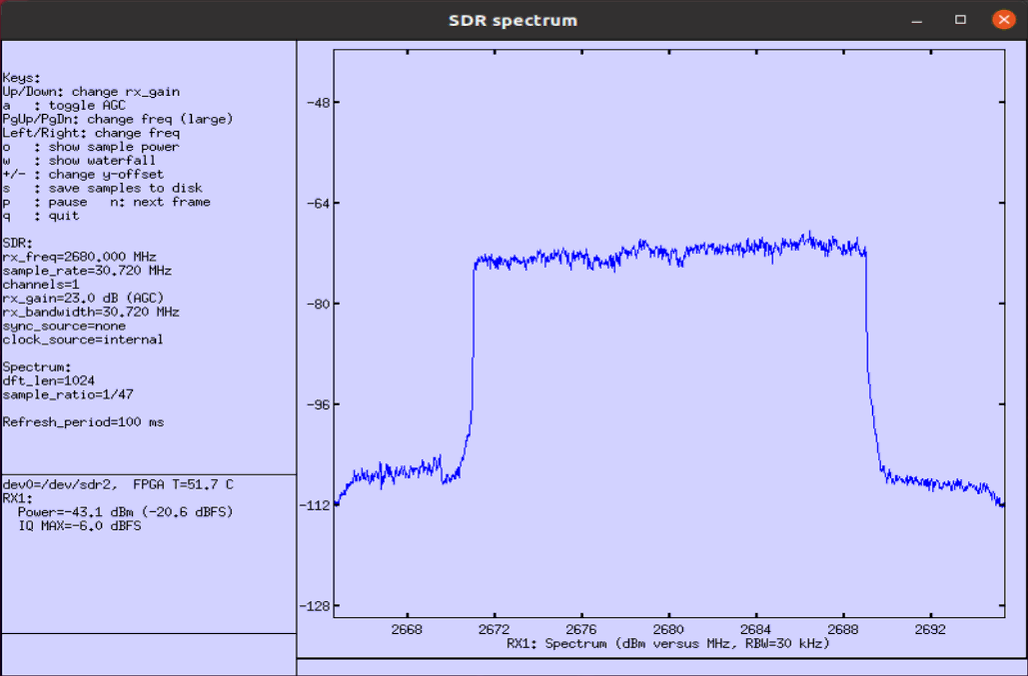
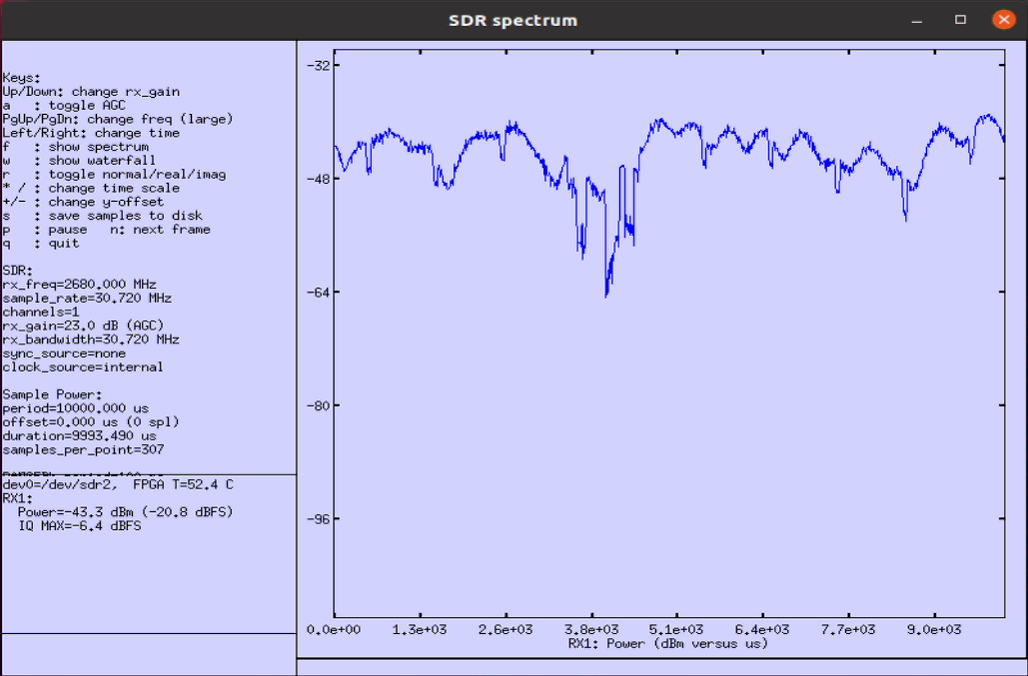
Following shows time domain plot. You would get more noticiable difference (effect) of fading in time domain plot. Compare this with the result of the previous test and you would notice the effect of doppler shift more intuitively
EPA, freq_doppler = 1000
This test shows the case where EPA profile and 1000Hz doppler shift is applied.
In terms of the constellation shown in WebGUI, you may not see the noticiable fading effect because this constellation is obtained after equalization. In this case, considerable part of random amplitude variation due to the fading would be reflected on the constellation but frequency drift due to doppler shift would not appear clearly since those impacts get corrected (compensated) by equalizer.
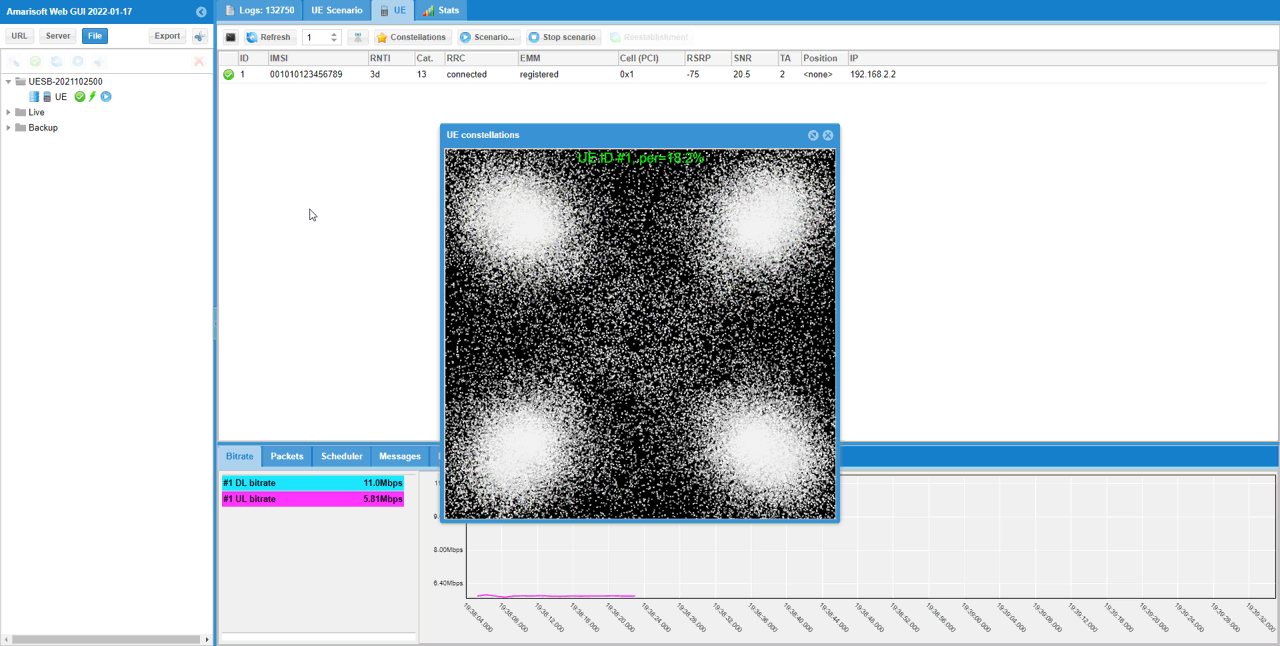
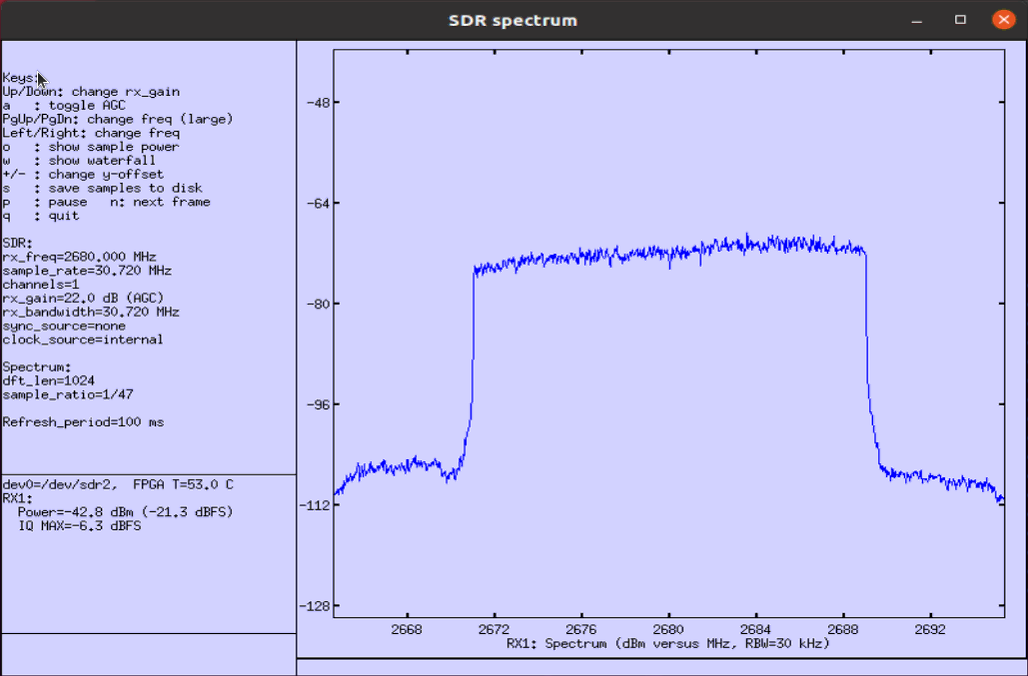
This is the capture of the signal using the built-in spectrum analyzer (called sdr_spectrum) as explained here.
Following shows frequency spectrum. You would see a little bit of larger variation in the amplitude, but not an huge variation in frequency spectrum.
Following shows time domain plot. You would get more noticiable difference (effect) of fading in time domain plot. Compare this with the result of the previous test and you would notice the effect of doppler shift more intuitively
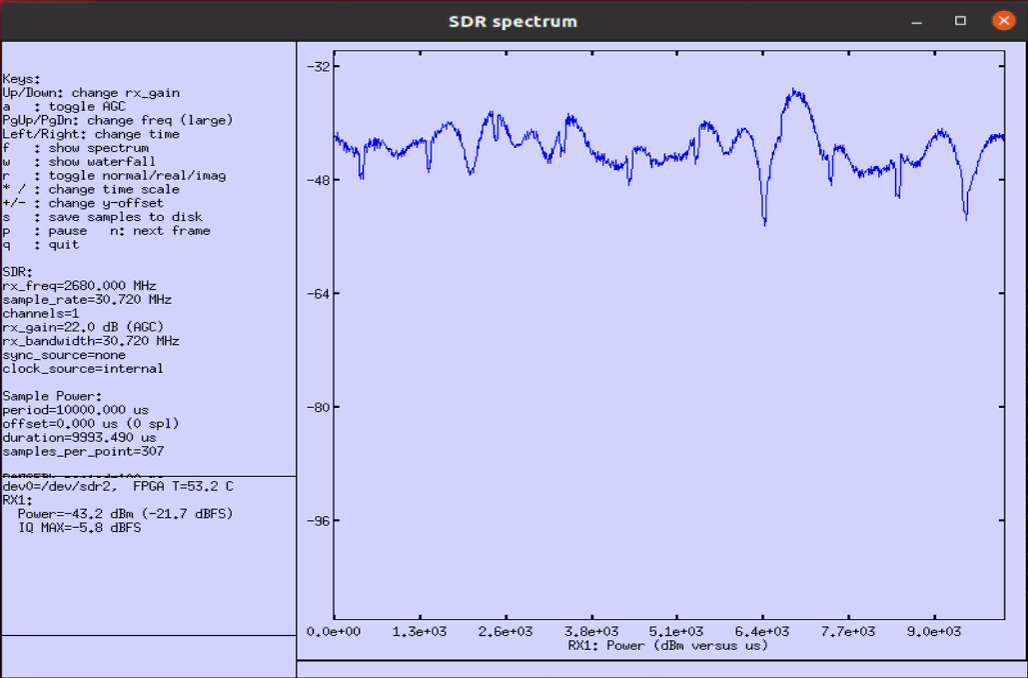
ETU, freq_doppler = 1000
This test shows the case where EPA profile and 1000Hz doppler shift is applied.
In terms of the constellation shown in WebGUI, you may not see the noticiable fading effect because this constellation is obtained after equalization. In this case, considerable part of random amplitude variation due to the fading would be reflected on the constellation but frequency drift due to doppler shift would not appear clearly since those impacts get corrected (compensated) by equalizer.
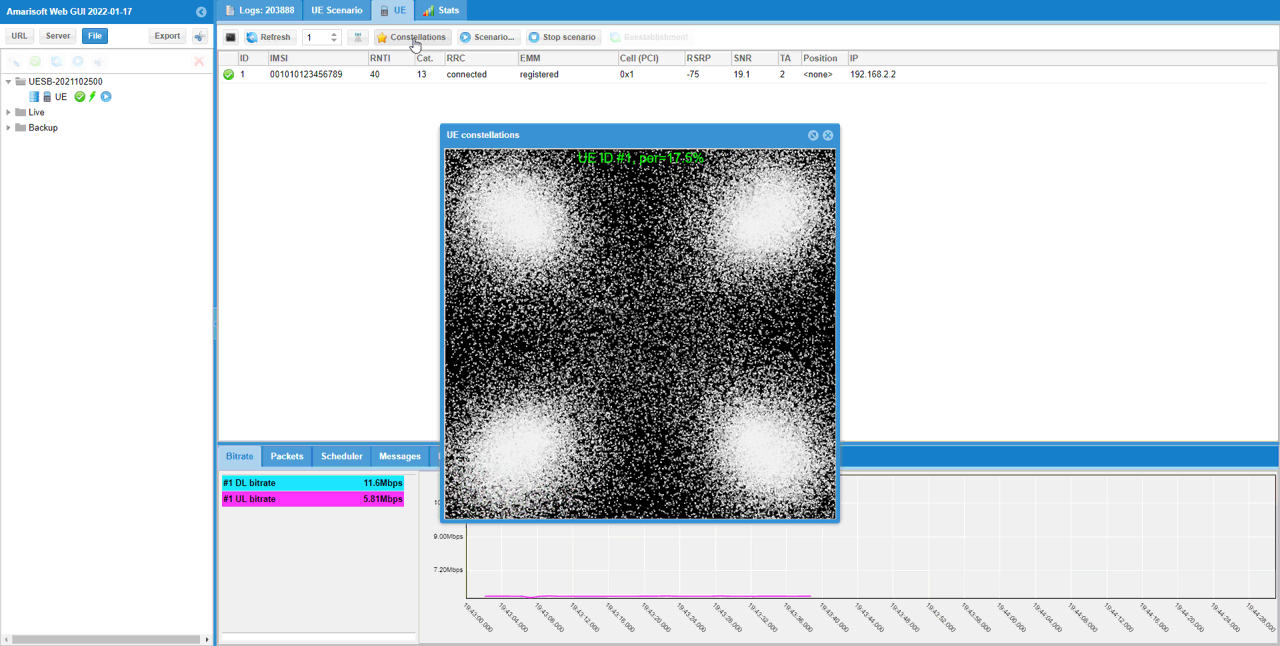
This is the capture of the signal using the built-in spectrum analyzer (called sdr_spectrum) as explained here.
Following shows frequency spectrum. You would see a little bit of larger variation in the amplitude, but not an huge variation in frequency spectrum.
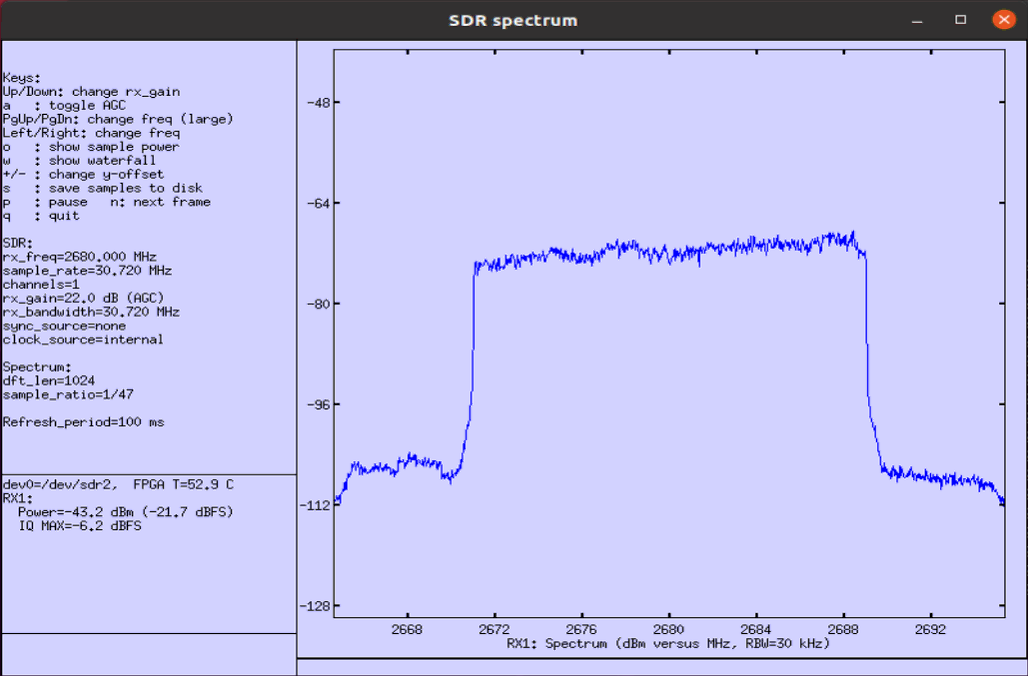
Following shows time domain plot. You would get more noticiable difference (effect) of fading in time domain plot. Compare this with the result of the previous test and you would notice the effect of doppler shift more intuitively
