NR gNB TestMode
This tutorial is to show how to test the quality of transmission signal of gNB. You can do this test without UE connection, it mean that it can transmit PDSCH or PUSCH with a special configuration without any call processing. You can use this functionality in different purposes as below.
- Verify on the quality of the transmission signal ==> Let the callbox transmit the PDSCH or PUSCH in a certain configuration and measure the quality with spectrum analyzer or signal analyzer
- Verify on the performance of Physical channel decoding performance ==> When your device is at the early stage of development and higher layer protocol stack is not implemented yet, you can configure your DUT to decode PHY channel directly without call setup and check if the DUT properly decode the channel.
In this tutorial, I will show you various examples for the first use case. Main purpose of this tutorial is to show you some references on the signal pattern and scheduling of the signal.
Table of Contents
- NR gNB TestMode
- Introduction
- Summary of the Tutorial
- Test Setup
- Key Configuration Parameters
- Common Configuration
- Test 1 : FDD - TM UEsim
- Test 2 : FDD TM UE-SIM SSB1100
- Test 3 : FDD TM UE-SIM SSB1110
- Test 4 : FDD TM UE-SIM SSB1111
- Test 5 : FDD TM UE-SIM SSB0000
- Test 6 : FDD TM1-1 SSB0000
- Test 7 : FDD TM1-2 SSB0000
- Test 8 : FDD TM2 SSB0000
- Test 9 : FDD TM1-2a SSB0000
- Test 10 : FDD TM3-1 SSB0000
- Test 11 : FDD TM3-1a SSB0000
- Test 12 : FDD TM3-2 SSB0000
- Test 13 : FDD TM3-3 SSB0000
- Test 14 : TDD TM UESIM SSB10000000
Introduction
In modern wireless communication systems, the quality and reliability of transmission signals play a critical role in overall network performance and user experience. The gNB (Next Generation NodeB) serves as the primary base station in 5G NR (New Radio) networks, responsible for radio resource management, signal transmission, and connectivity between user equipment (UE) and the 5G core network. Ensuring the integrity of the physical layer—specifically, the downlink (PDSCH) and uplink (PUSCH) shared channels—is essential for validating the infrastructure before full protocol stack integration or live user traffic. Signal quality testing at the gNB level, independent of UE connections, allows engineers to assess transmitter performance, spectral purity, and decoding capability under controlled conditions. This approach utilizes specialized configurations to generate and schedule PDSCH or PUSCH transmissions without initiating standard call processing, enabling direct measurement with laboratory equipment such as spectrum analyzers or signal analyzers. Such testing is invaluable during the initial development, troubleshooting, or certification phases, as it provides a repeatable and isolated method for evaluating the physical channel's quality, identifying potential impairments, and verifying conformance to 3GPP standards. By focusing on these foundational transmission elements, engineers can optimize radio performance and ensure the reliability of subsequent higher-layer protocols, contributing to robust and efficient 5G network deployments.
-
Context of the Technology
- The tutorial focuses on 5G NR gNB signal quality assessment, specifically testing the Physical Downlink Shared Channel (PDSCH) and Physical Uplink Shared Channel (PUSCH).
- Transmission tests are conducted without active UE connections, allowing direct characterization of the gNB's RF performance.
- This methodology is commonly used during device development, pre-certification, and troubleshooting when higher-layer signaling is not yet implemented.
-
Relevance and Importance
- Ensures the gNB transmits signals that meet quality and regulatory standards before live network deployment.
- Enables early detection of issues related to RF design, signal distortion, or scheduling errors.
- Facilitates rapid iteration in development cycles by allowing physical layer verification independently from protocol stack development.
-
Learning Outcomes
- Understand how to configure and execute gNB transmission tests without UE involvement.
- Gain the ability to use spectrum or signal analyzers to measure and interpret physical signal parameters.
- Acquire insights into the signal patterns and scheduling mechanisms used in 5G NR physical channel testing.
- Learn best practices for assessing transmission quality and identifying potential issues at the RF and PHY layers.
-
Prerequisite Knowledge and Skills
- Familiarity with 5G NR architecture, particularly gNB roles and physical layer concepts.
- Basic understanding of RF measurement equipment, such as spectrum analyzers and signal analyzers.
- General knowledge of wireless communication protocols and signal scheduling principles.
-
Purpose and Scope of the Tutorial
- The tutorial provides practical examples and references for performing gNB transmission quality tests, focusing on the first use case—signal quality verification using external measurement tools.
- It aims to equip engineers and testers with the foundational methodology to validate physical channel transmission, laying the groundwork for further protocol and system-level testing.
Summary of the Tutorial
In this tutorial, two primary test setups are described for signal transmission and spectrum quality analysis:
-
Amarisoft Callbox and Amarisoft UEsim Setup:
- The Callbox is configured to transmit the signal in test mode.
- The UEsim is utilized as a spectrum analyzer to measure and analyze the transmitted signal.
- Alternatively, any external spectrum or signal analyzer can be used in place of UEsim.
-
Single Callbox with Multiple SDR Cards Setup:
- If the Callbox is equipped with multiple SDR (Software Defined Radio) cards, one SDR card is assigned for signal transmission.
- Another SDR card is used to measure the spectrum quality of the transmitted signal.
- This configuration allows basic verification and measurement without requiring an additional spectrum analyzer device.
The tutorial emphasizes the importance of key configuration parameters, such as tm_pdsch, for performing the test procedures. The steps involve setting up the equipment, configuring the Callbox for test mode transmission, and using a secondary device (either UEsim or another SDR card/spectrum analyzer) to observe and verify the transmitted signal’s spectral quality.
Test Setup
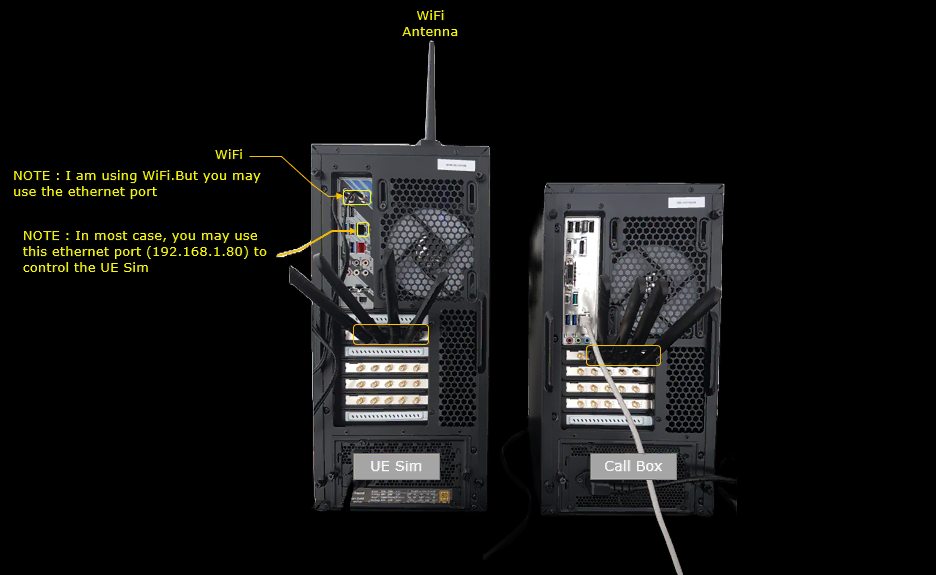
In this tutorial, I used two setups Amarisoft Callbox and Amarisoft UEsim. Callbox is used to transmit the signal in test mode and I just used UEsim as a spectrum analyzer. You can use your own spectrum analyzer or signal analyzer instead of UEsim. You can do the test and basic verification even with Callbox only if the callbox has multiple SDR cards. In that case, you can use one SDR card to transmit the signal and use another SDR card to measure the spectrum quality of the signal.
Key Configuration Parameters
Followings are important configuration parameters for this tutorial. You may click on the items for the descriptions from Amarisoft documents.
-
rb_start
-
l_crb
-
mcs
-
boosted_ratio
-
boosted_power
-
deboosted_mcs
- pusch
- rnti
- pdsch
- rnti
- pdsch_harq_ack_disable
- random_data
- load
- ue_count
Common Configuration
In this section, I will walk through the default pdsch test mode configuration and look into all the configuration that are associated with the test mode. The parameters shown in this section will apply to all the test cases in this tutorial with just some minor value changes.
You will find a template named gnb-tm-pdsch.cfg as shown below. I will use this file as a reference and modify this file for other test cases in this tutorial.

The configuration shown here is common configuration for all the subtests belonging to Test 1 and I will not show this configuration repeatedly for every subtest. You can select between TDD and FDD by changing TDD option and change BW and Subcarrier Spacing by changing BANDWIDTH and SCS option. Also you can select a specific case by setting TEST_MODEL option.
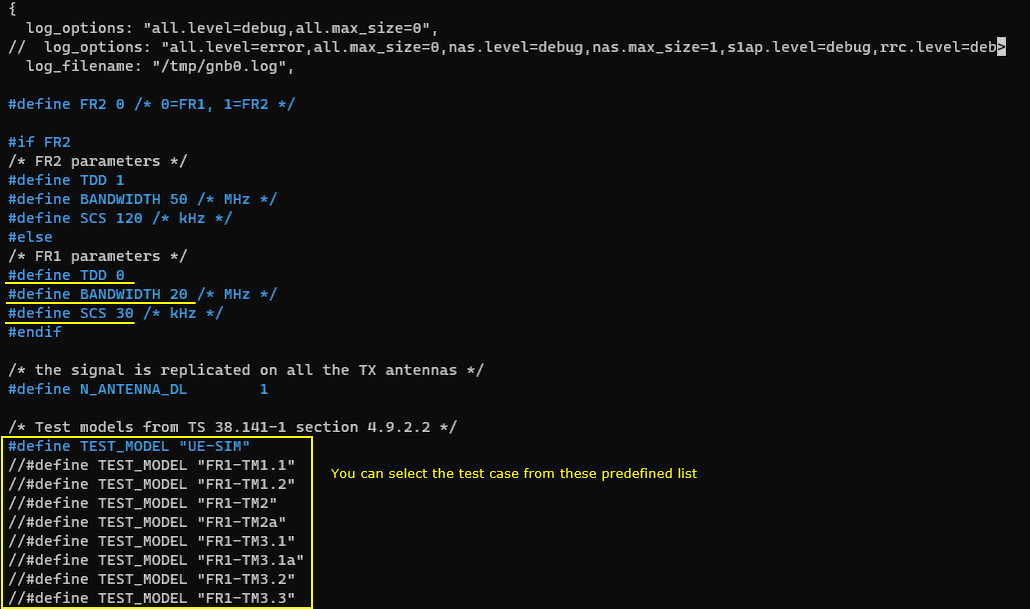
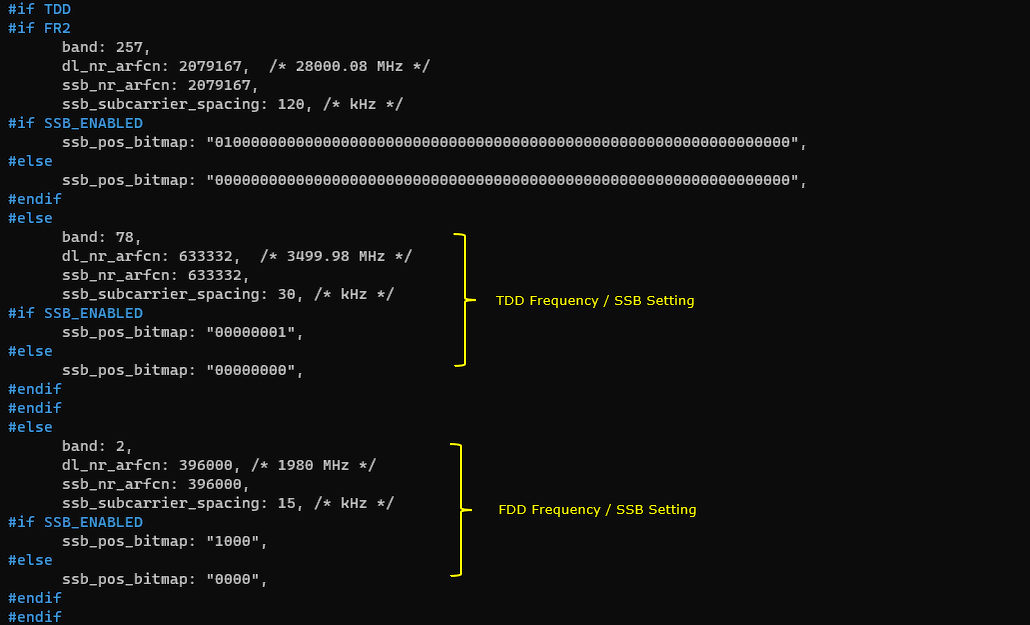
You can enable or disable SSB transmission by setting SSB_ENABLED option.

Setting the band, frequency, subcarrier spacing is same as in regular test cases. You can set these by setting the configuration parameter : band, dl_nr_arfcn, ssb_nr_arfcn, ssb_subcarrier_spacing.
You can specify mcs differently for each of the cases by setting the configuration parameter : mcs.
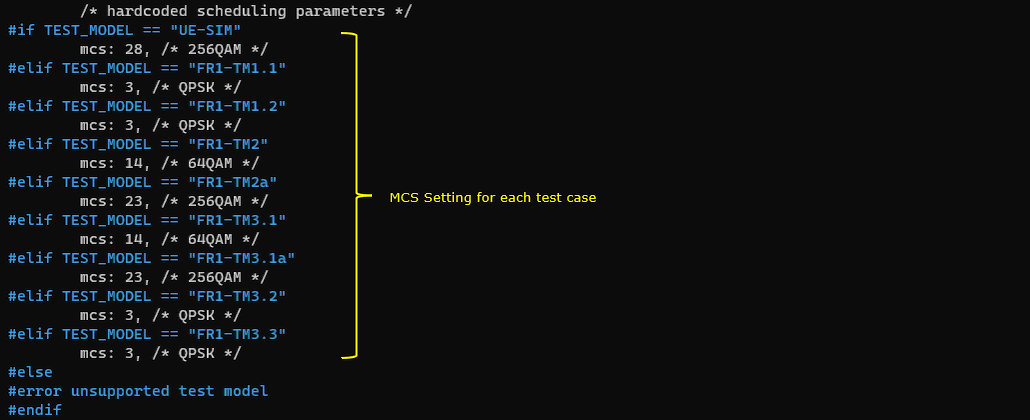
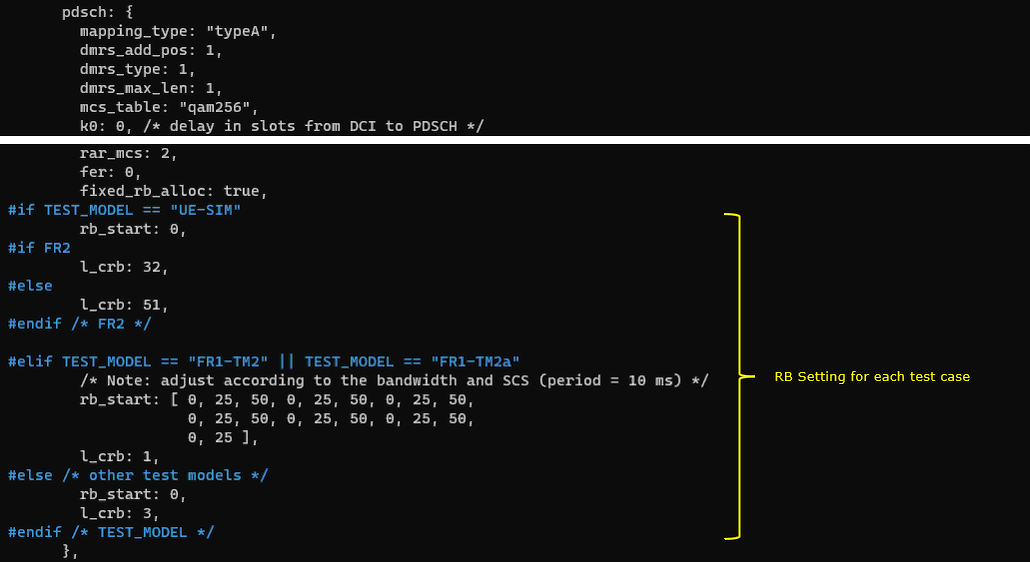
You can specify the RB allocation for each of the test cases by setting rb_start and l_crb. If needed, you can set the RB allocation differently for each slot by assigning an array to these configuration parameter.
You can adjust k2 parameter differently depending on FR1 and FR2 using the configuration parameter k2 and msg3_k2.

There are many of the configuration parameter that are specifically designed for test mode only. They are specified within tm_pdsch:[ ]. The parameters that are specified differently for each test cases are boosted_ratio, boosted_power, deboosted_mcs.
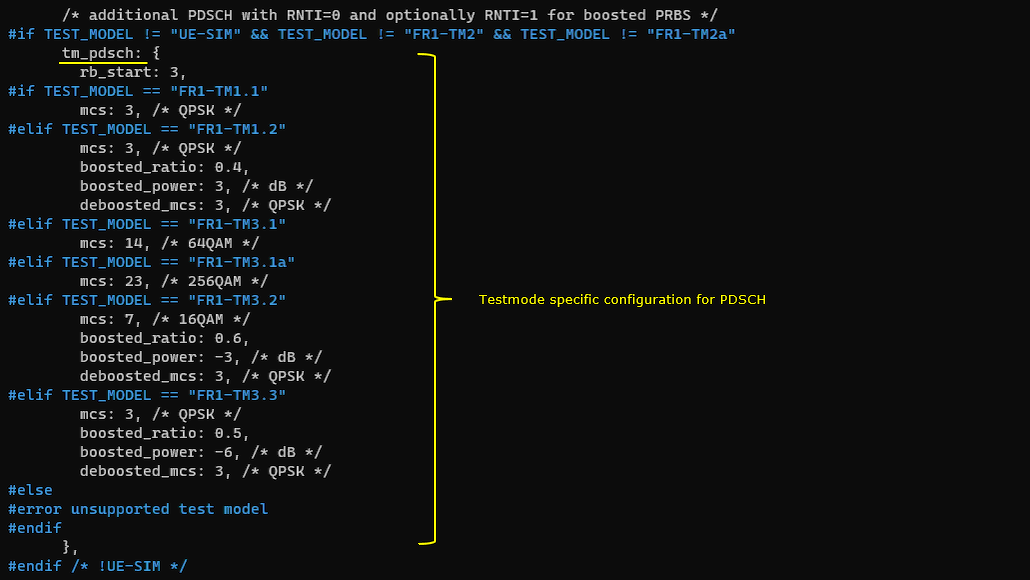
You can specify high level nature of the test_mode by setting the configurations in test_mode: { } parameter like type, random_data, pdsch_harq_ack_disable, rnti etc.

Test 1 : FDD - TM UEsim
This test shows the test configuration and the result with Test Case UEsim in FDD mode.
Configuration
I have used gnb-tm-pdsch.cfg .

Run
Check cell configuration and check if they are configured at high level as intended

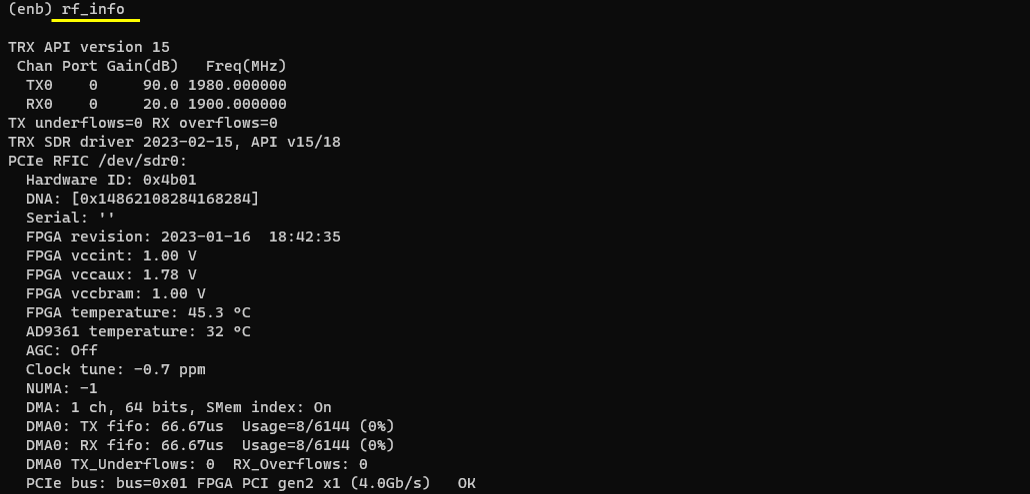
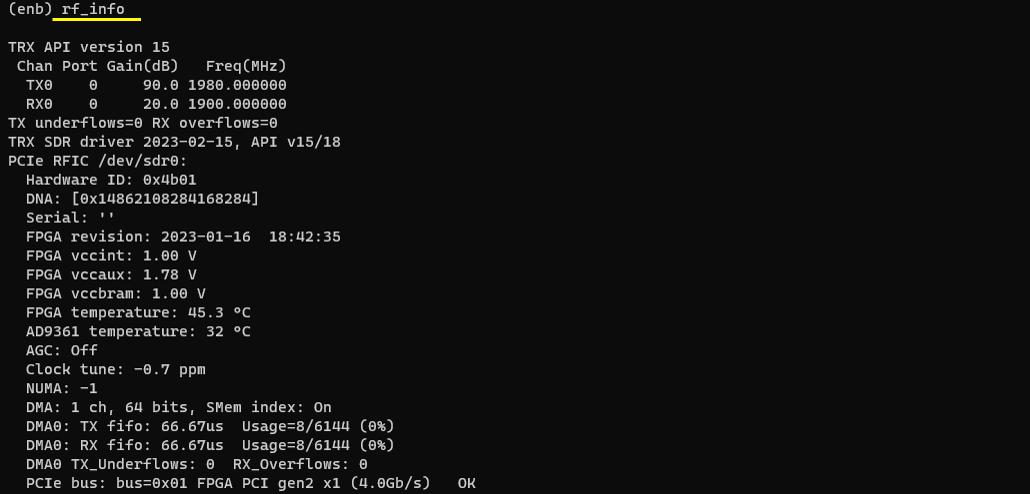
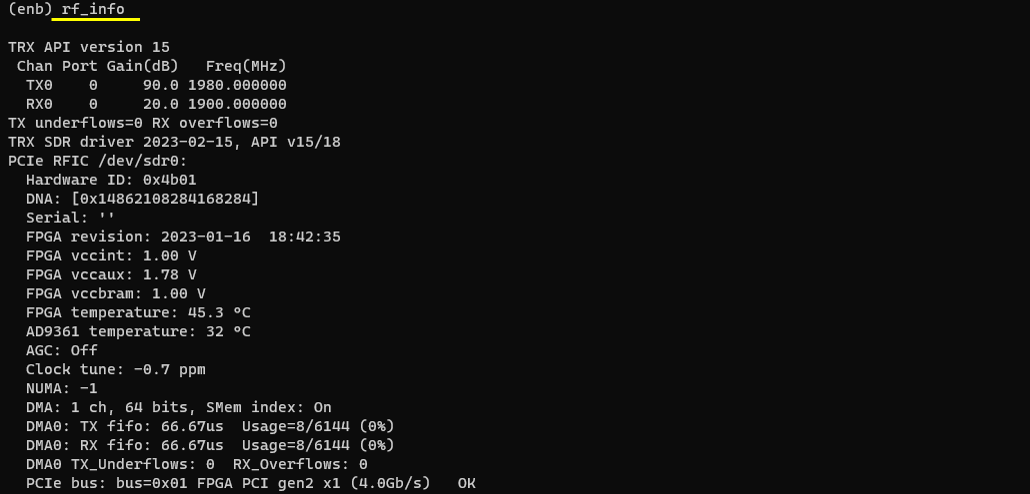
In this tutorial, I will use spectrum analyzer to check the quality of the spectrum. To do it, you need to know of the TX frequency (physical frequency, not ARFCN). You can get the information with rf_info command.
Now you can get the high level test result with t (trace) command. DL mcs and txok would be the first high level result you may want to check because these value would vary depending on configuration.

Analysis
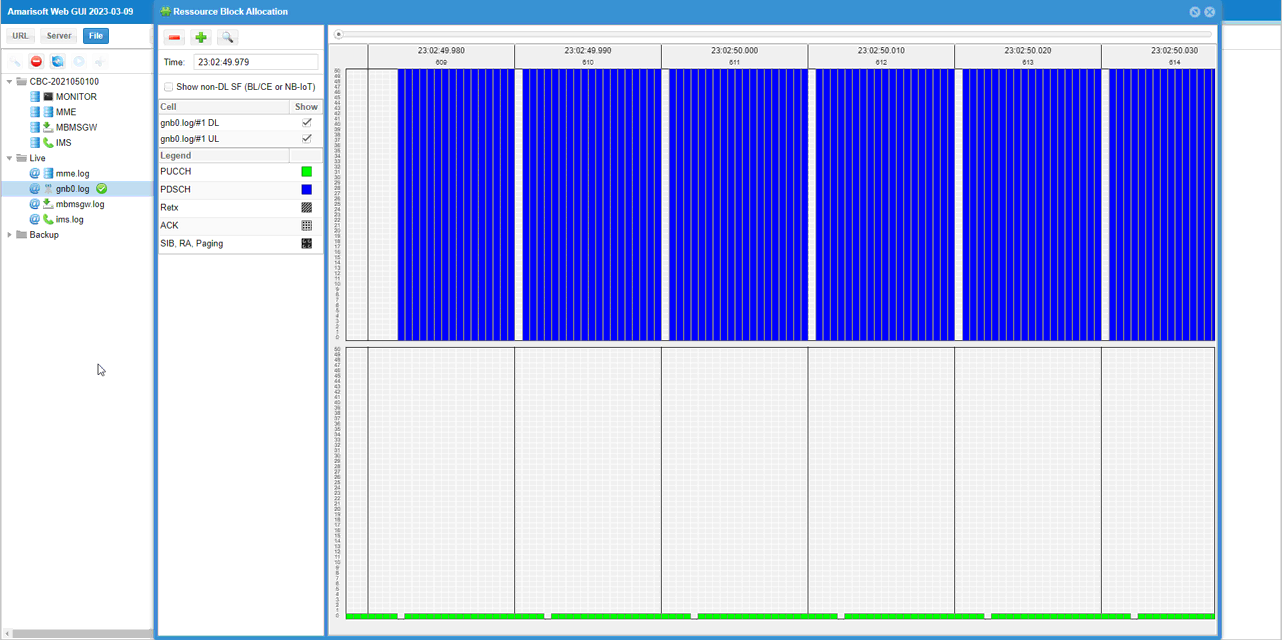
First thing you may want to check would be to check the PDSCH transmission at the PHY log level. This would be good hints on what you expect to see in "power vs time" view in the spectrum analyzer result.
Now you can run spectrum analyzer to check on signal quality. I used Amarisoft sdr card and sdr_spectrum as the spectrum analyzer. The command line command to get this result was :
./sdr_spectrum -args "dev0=/dev/sdr1" -rx_freq 1980.00e6 -period 100
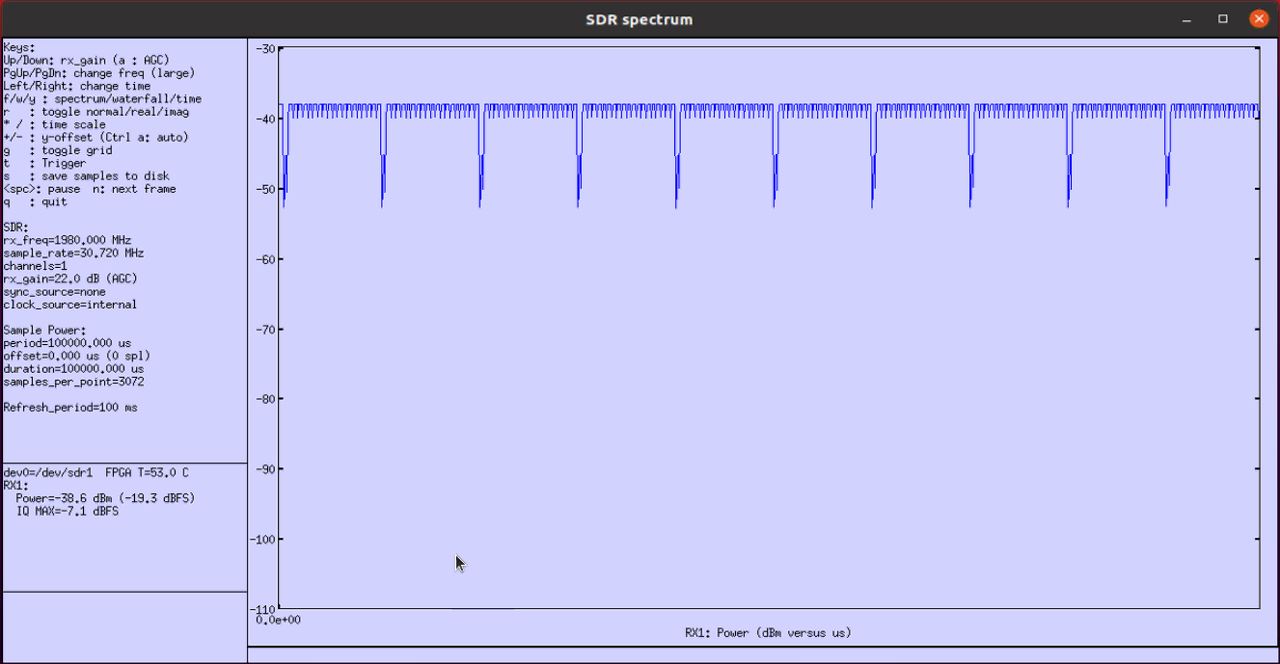
The first thing you may want to check is frequency spectrum which is the default view of sdr_spectrum. The spectrum view would vary (especialy in out of band region) depending on rx gain setting on reciever chain. The easiest way to set the optimal rx gain is to press 'a' key to let sdr_spectrum to adjust the value automatically.

Next thing to check is time domain profile (i.e, 'power vs time' or 'Zero Span' in spectrum analyzer terminology). The dips shown here is the region where SSB is transmitted and PDSCH is not transmitted.
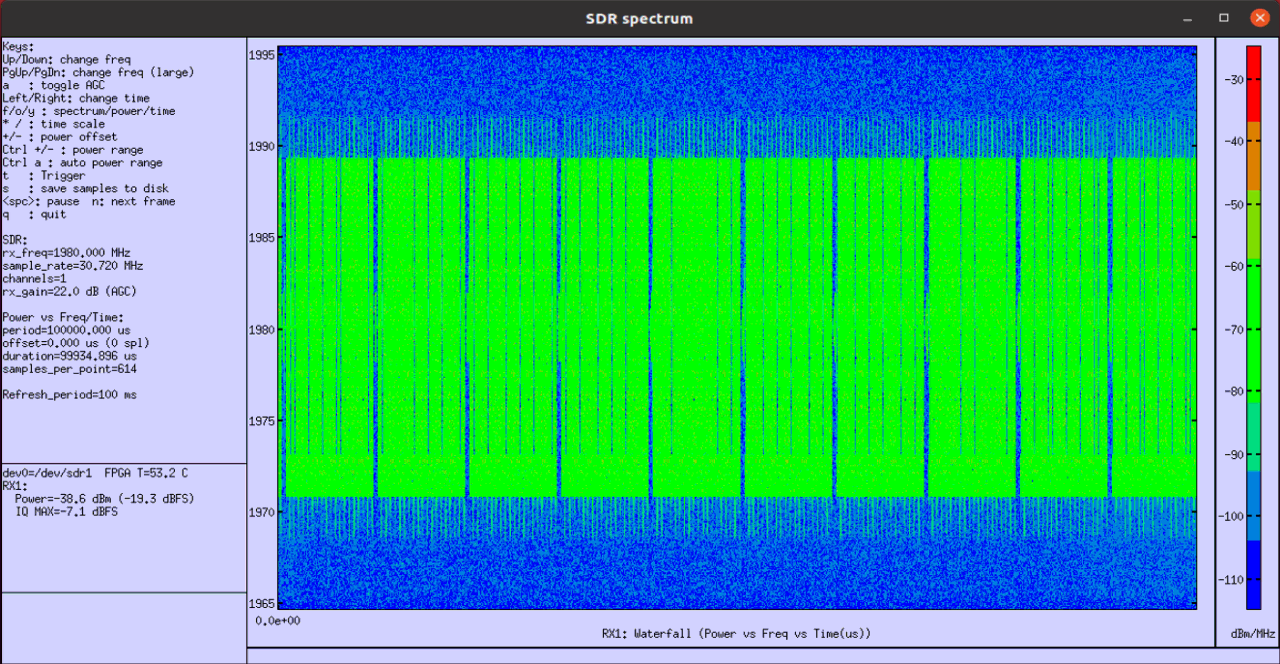
Next thing you may want to check is spectrogram of the signal. Vertical axis(y-axis) represents frequency and Horizontal axis(x-axis) indicates time(OFDM symbol index). The green area indicates the spectrum where high power is measured. You see occasional gaps within the green are indicating the OFDM symbols where SSB is tranmitted and PDSCH is not transmitted.
Test 2 : FDD TM UE-SIM SSB1100
This test shows the test configuration and the result with Test Case UEsim with SSB enabled (ssb_bitmap : 1100) in FDD mode.
Configuration
I have used gnb-tm-pdsch_TDD_0_TM_UE-SIM_SSB-1100.cfg that is copined and modified from gnb-tm-pdsch.cfg .

Run
Check cell configuration and check if they are configured at high level as intended

In this tutorial, I will use spectrum analyzer to check the quality of the spectrum. To do it, you need to know of the TX frequency (physical frequency, not ARFCN). You can get the information with rf_info command.
Now you can get the high level test result with t (trace) command. DL mcs and txok would be the first high level result you may want to check because these value would vary depending on configuration.

Analysis
First thing you may want to check would be to check the PDSCH transmission at the PHY log level. This would be good hints on what you expect to see in "power vs time" view in the spectrum analyzer result.
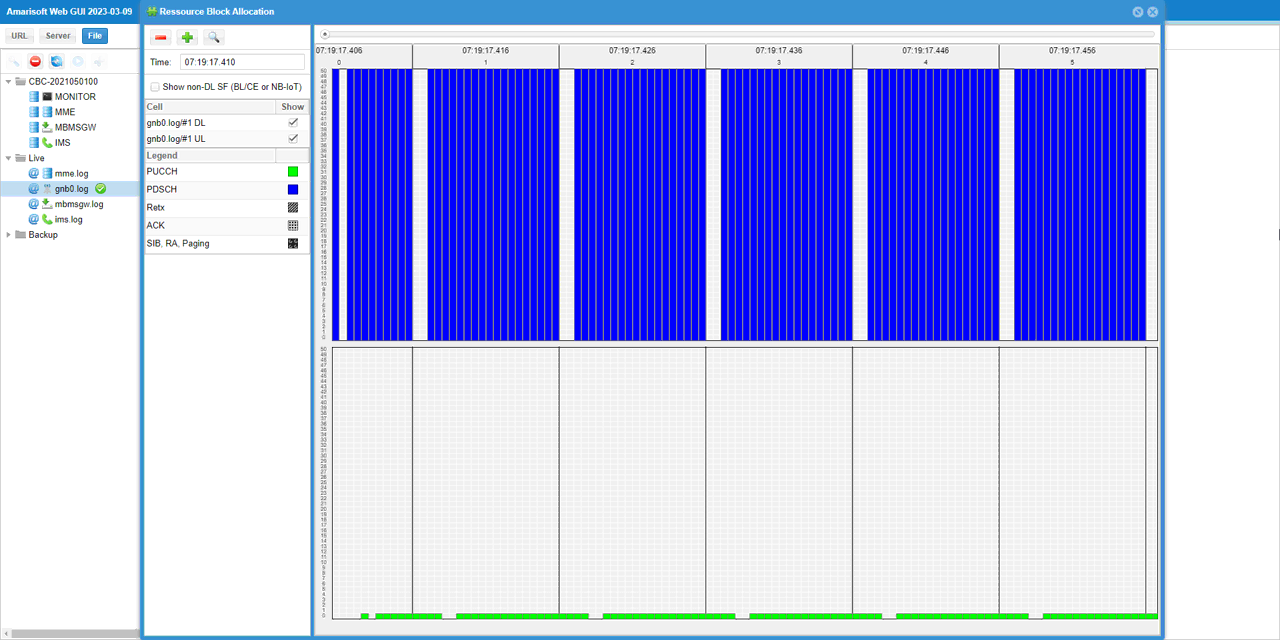
Now you can run spectrum analyzer to check on signal quality. I used Amarisoft sdr card and sdr_spectrum as the spectrum analyzer. The command line command to get this result was :
./sdr_spectrum -args "dev0=/dev/sdr1" -rx_freq 1980.00e6 -period 100
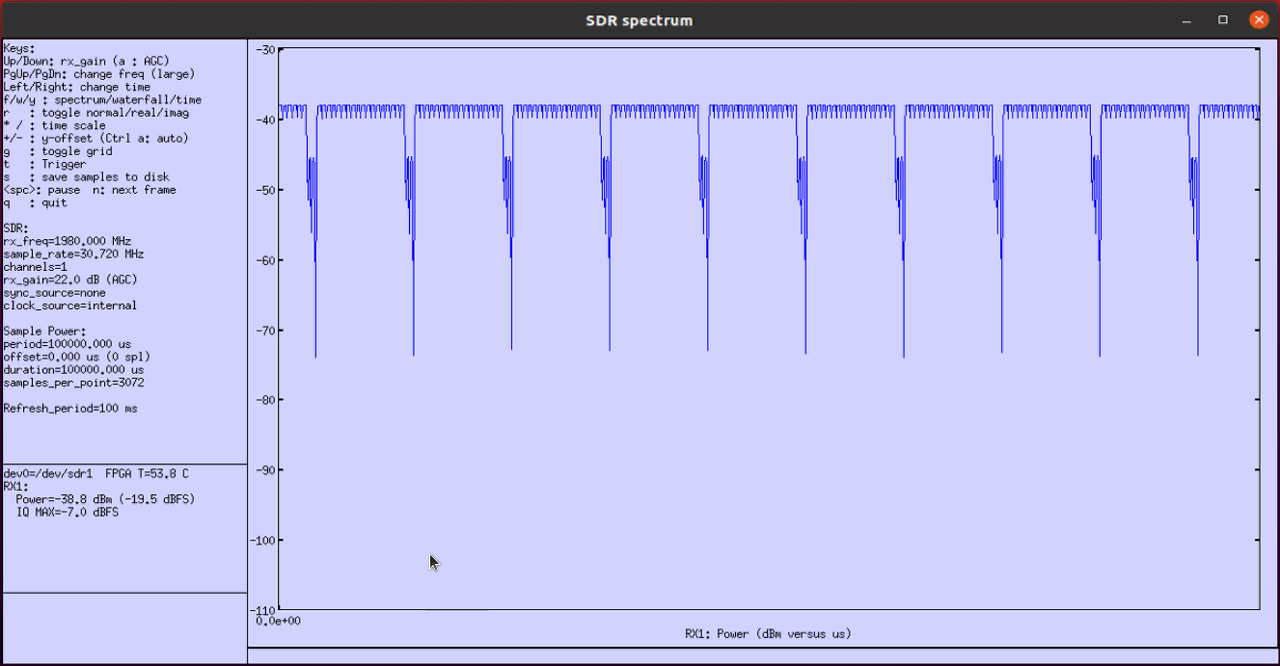
The first thing you may want to check is frequency spectrum which is the default view of sdr_spectrum. The spectrum view would vary (especialy in out of band region) depending on rx gain setting on reciever chain. The easiest way to set the optimal rx gain is to press 'a' key to let sdr_spectrum to adjust the value automatically.

Next thing to check is time domain profile (i.e, 'power vs time' or 'Zero Span' in spectrum analyzer terminology). The dips shown here is the region where SSB is transmitted and PDSCH is not transmitted.
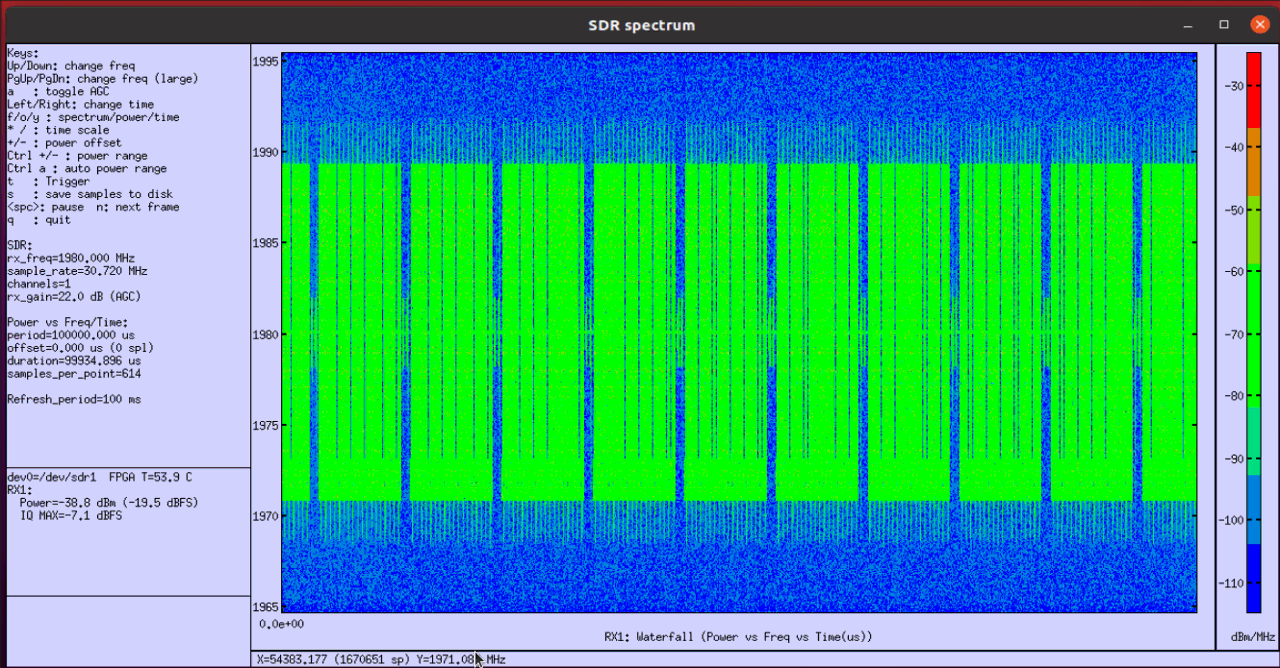
Next thing you may want to check is spectrogram of the signal. Vertical axis(y-axis) represents frequency and Horizontal axis(x-axis) indicates time(OFDM symbol index). The green area indicates the spectrum where high power is measured. You see occasional gaps within the green are indicating the OFDM symbols where SSB is tranmitted and PDSCH is not transmitted.
Test 3 : FDD TM UE-SIM SSB1110
This test shows the test configuration and the result with Test Case UEsim with SSB enabled (ssb_bitmap : 1110) in FDD mode.
Configuration
I have used gnb-tm-pdsch_TDD_0_TM_UE-SIM_SSB-1110.cfg that is copined and modified from gnb-tm-pdsch.cfg .

Run
Check cell configuration and check if they are configured at high level as intended

In this tutorial, I will use spectrum analyzer to check the quality of the spectrum. To do it, you need to know of the TX frequency (physical frequency, not ARFCN). You can get the information with rf_info command.
Now you can get the high level test result with t (trace) command. DL mcs and txok would be the first high level result you may want to check because these value would vary depending on configuration.

Analysis
First thing you may want to check would be to check the PDSCH transmission at the PHY log level. This would be good hints on what you expect to see in "power vs time" view in the spectrum analyzer result.
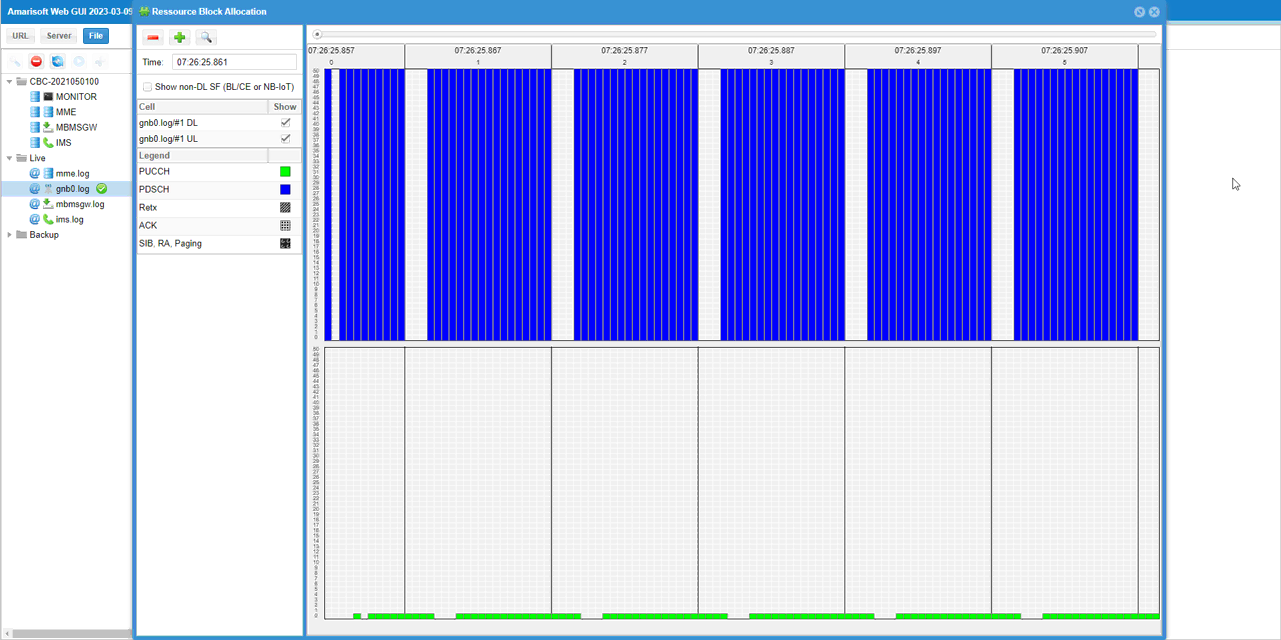
Now you can run spectrum analyzer to check on signal quality. I used Amarisoft sdr card and sdr_spectrum as the spectrum analyzer. The command line command to get this result was :
./sdr_spectrum -args "dev0=/dev/sdr1" -rx_freq 1980.00e6 -period 100
The first thing you may want to check is frequency spectrum which is the default view of sdr_spectrum. The spectrum view would vary (especialy in out of band region) depending on rx gain setting on reciever chain. The easiest way to set the optimal rx gain is to press 'a' key to let sdr_spectrum to adjust the value automatically.
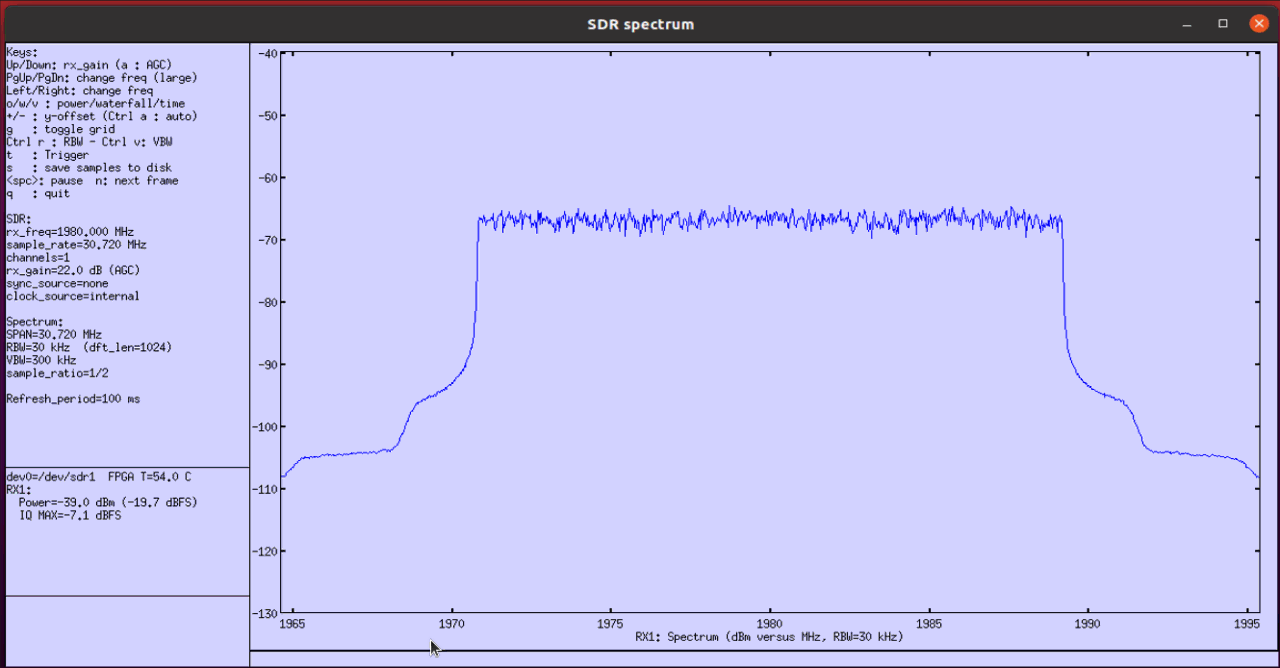
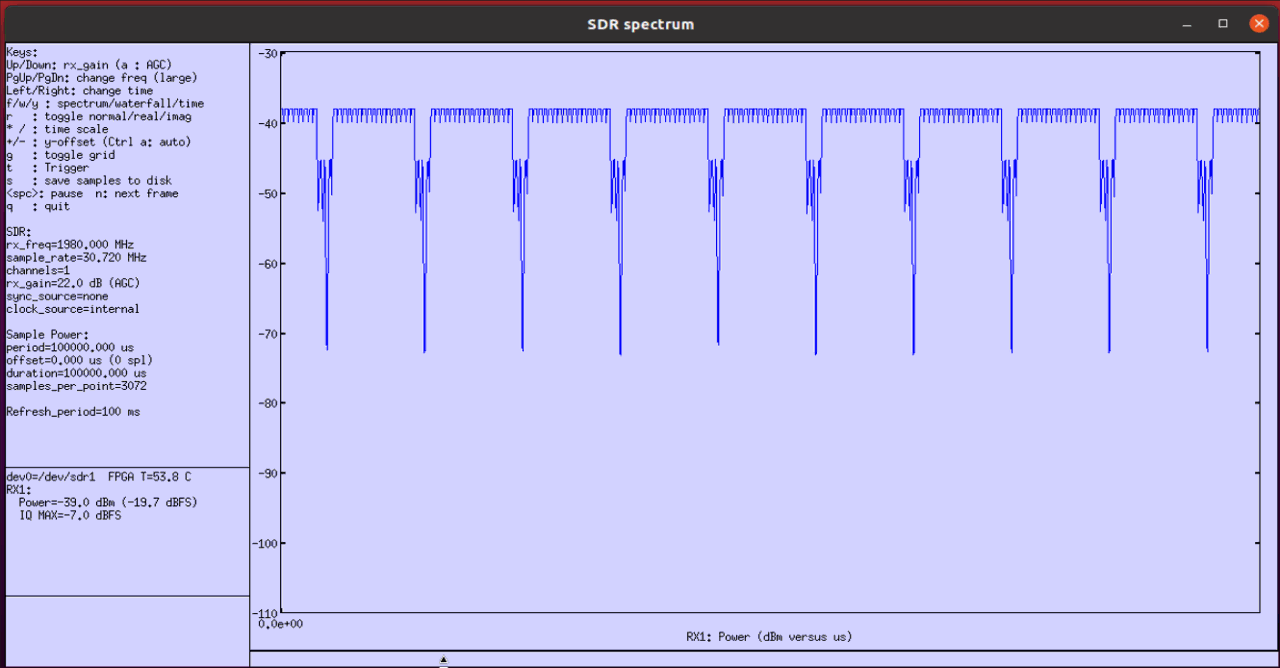
Next thing to check is time domain profile (i.e, 'power vs time' or 'Zero Span' in spectrum analyzer terminology). The dips shown here is the region where SSB is transmitted and PDSCH is not transmitted..
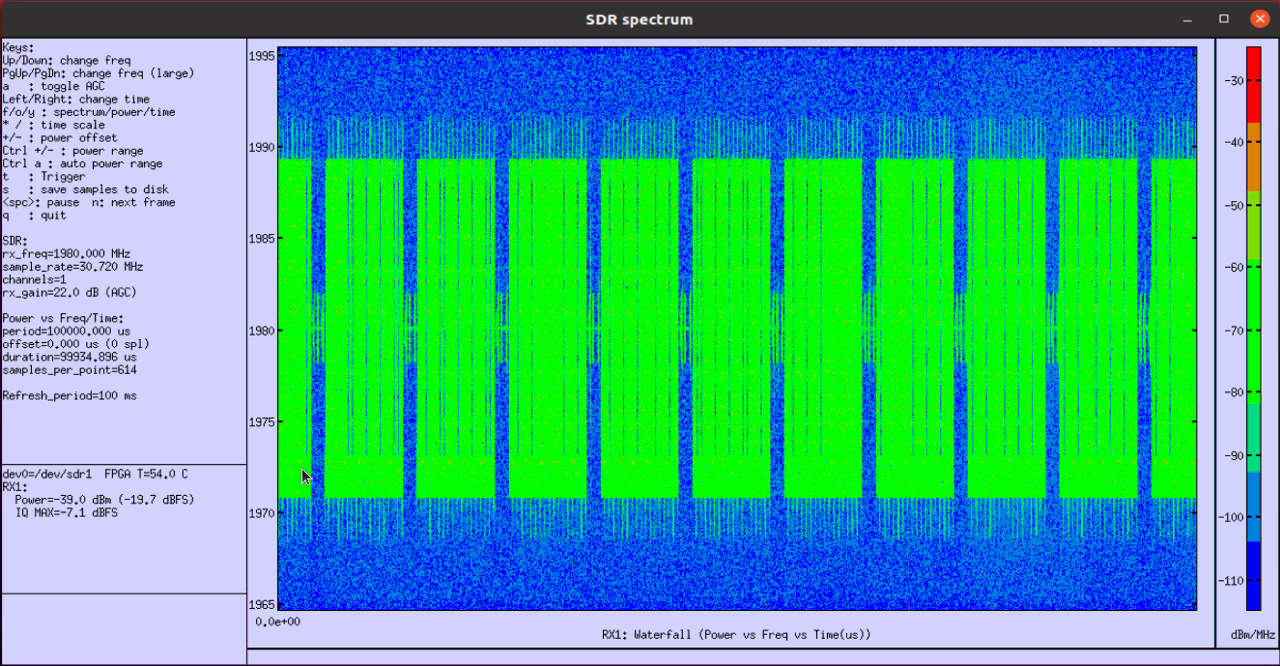
Next thing you may want to check is spectrogram of the signal. Vertical axis(y-axis) represents frequency and Horizontal axis(x-axis) indicates time(OFDM symbol index). The green area indicates the spectrum where high power is measured. You see occasional gaps within the green are indicating the OFDM symbols where SSB is tranmitted and PDSCH is not transmitted.
Test 4 : FDD TM UE-SIM SSB1111
This test shows the test configuration and the result with Test Case UEsim with SSB enabled (ssb_bitmap : 1111) in FDD mode.
Configuration
I have used gnb-tm-pdsch_TDD_0_TM_UE-SIM_SSB-1111.cfg that is copined and modified from gnb-tm-pdsch.cfg .

Run
Check cell configuration and check if they are configured at high level as intended

In this tutorial, I will use spectrum analyzer to check the quality of the spectrum. To do it, you need to know of the TX frequency (physical frequency, not ARFCN). You can get the information with rf_info command.
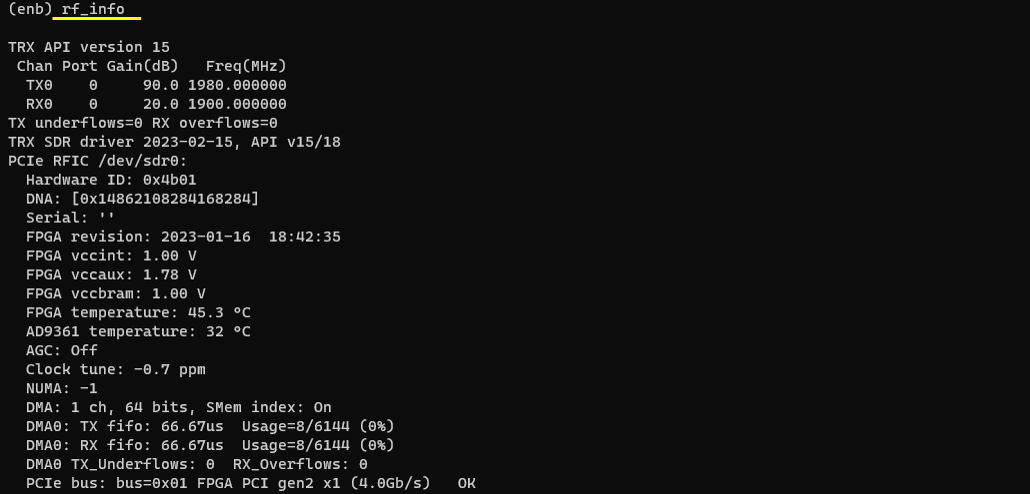
Now you can get the high level test result with t (trace) command. DL mcs and txok would be the first high level result you may want to check because these value would vary depending on configuration.

Analysis
First thing you may want to check would be to check the PDSCH transmission at the PHY log level. This would be good hints on what you expect to see in "power vs time" view in the spectrum analyzer result.
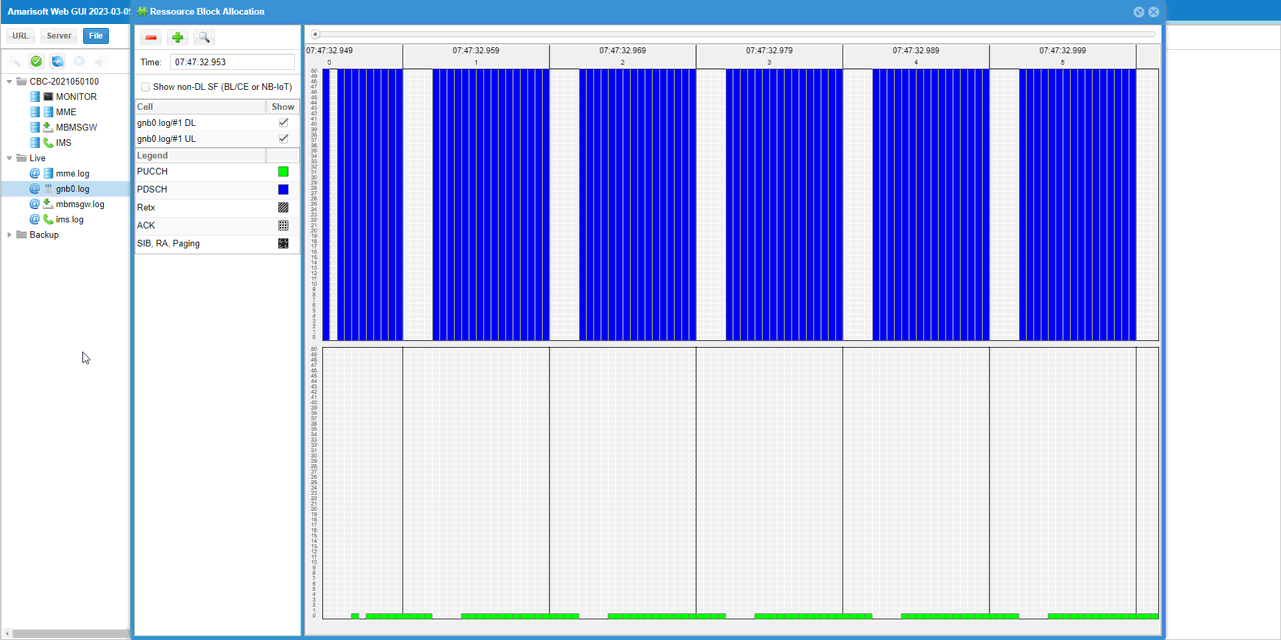
Now you can run spectrum analyzer to check on signal quality. I used Amarisoft sdr card and sdr_spectrum as the spectrum analyzer. The command line command to get this result was :
./sdr_spectrum -args "dev0=/dev/sdr1" -rx_freq 1980.00e6 -period 100
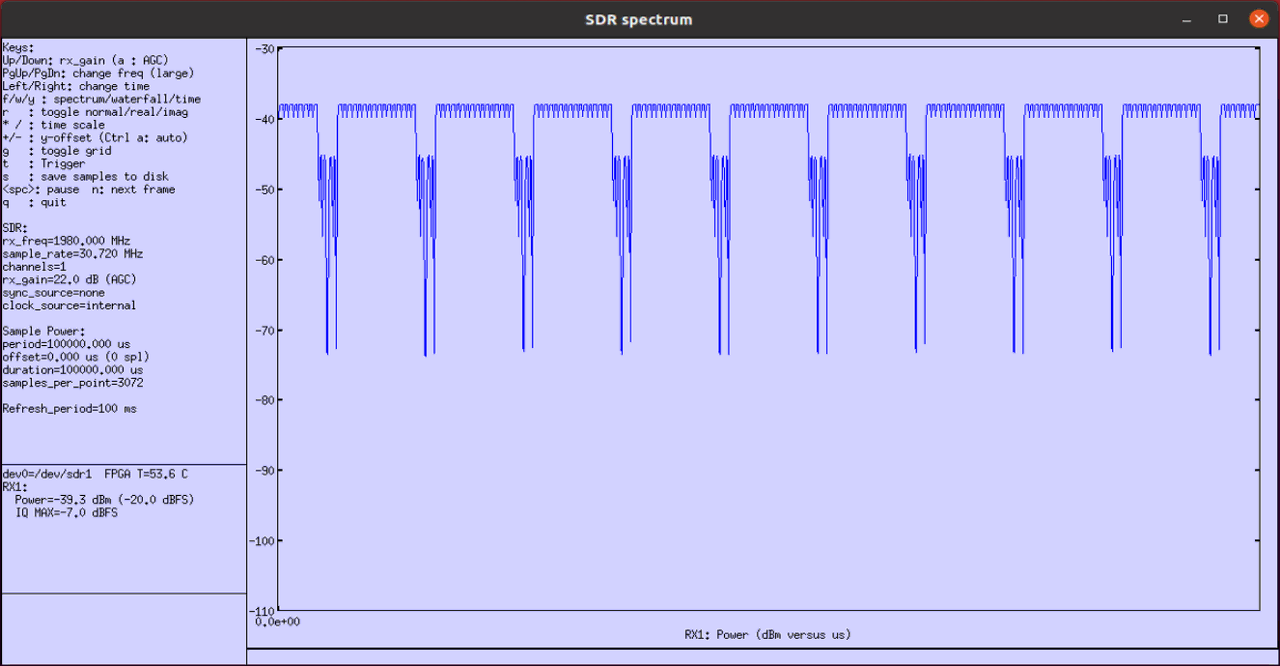
The first thing you may want to check is frequency spectrum which is the default view of sdr_spectrum. The spectrum view would vary (especialy in out of band region) depending on rx gain setting on reciever chain. The easiest way to set the optimal rx gain is to press 'a' key to let sdr_spectrum to adjust the value automatically.

Next thing to check is time domain profile (i.e, 'power vs time' or 'Zero Span' in spectrum analyzer terminology). The dips shown here is the region where SSB is transmitted and PDSCH is not transmitted.
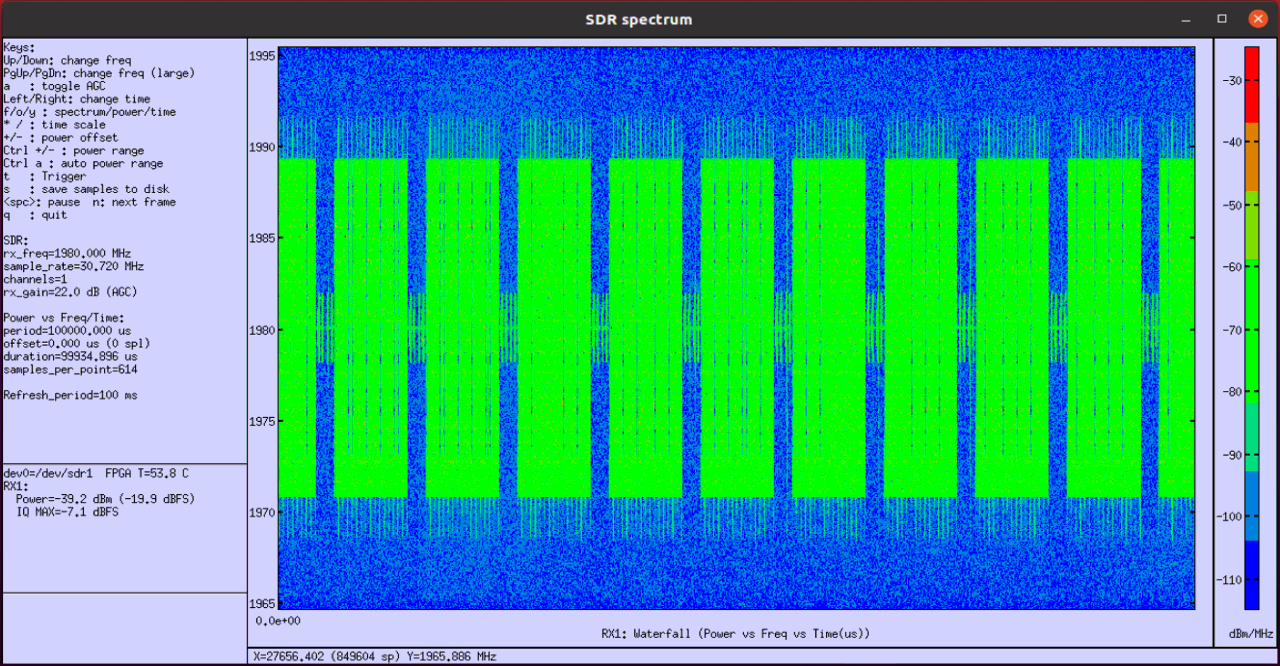
Next thing you may want to check is spectrogram of the signal. Vertical axis(y-axis) represents frequency and Horizontal axis(x-axis) indicates time(OFDM symbol index). The green area indicates the spectrum where high power is measured. You see occasional gaps within the green are indicating the OFDM symbols where SSB is tranmitted and PDSCH is not transmitted.
Test 5 : FDD TM UE-SIM SSB0000
This test shows the test configuration and the result with Test Case UEsim with SSB disabled (ssb_bitmap : 0000) in FDD mode.
Configuration
I have used gnb-tm-pdsch_TDD_0_TM_UE-SIM_SSB-1111.cfg that is copined and modified from gnb-tm-pdsch.cfg .

Run
Check cell configuration and check if they are configured at high level as intended

In this tutorial, I will use spectrum analyzer to check the quality of the spectrum. To do it, you need to know of the TX frequency (physical frequency, not ARFCN). You can get the information with rf_info command.
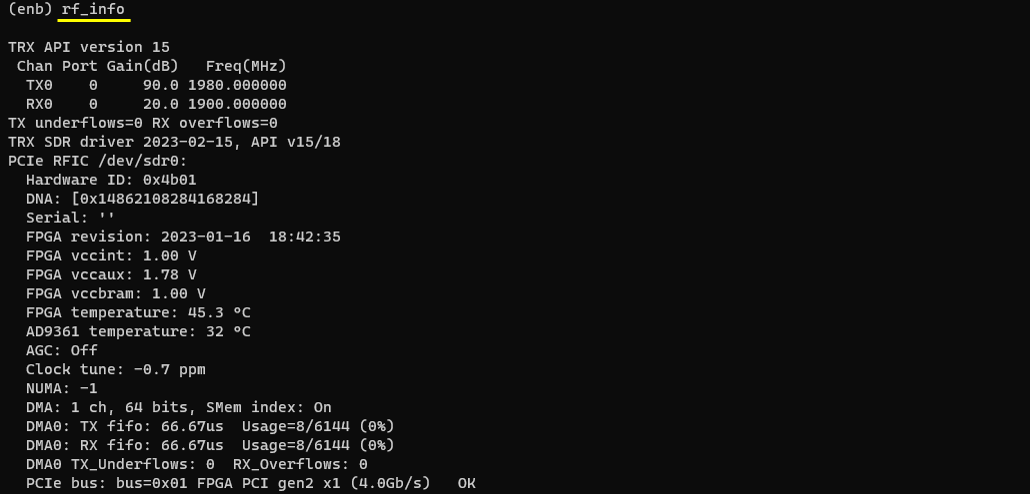
Now you can get the high level test result with t (trace) command. DL mcs and txok would be the first high level result you may want to check because these value would vary depending on configuration.

Analysis
First thing you may want to check would be to check the PDSCH transmission at the PHY log level. This would be good hints on what you expect to see in "power vs time" view in the spectrum analyzer result.
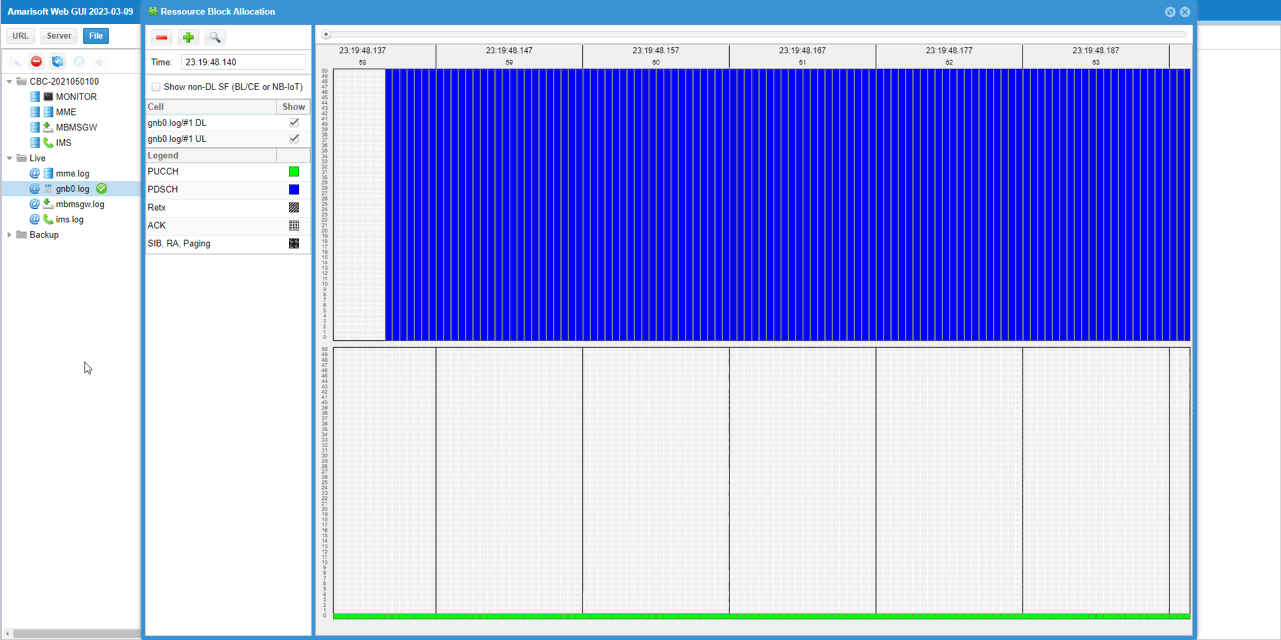
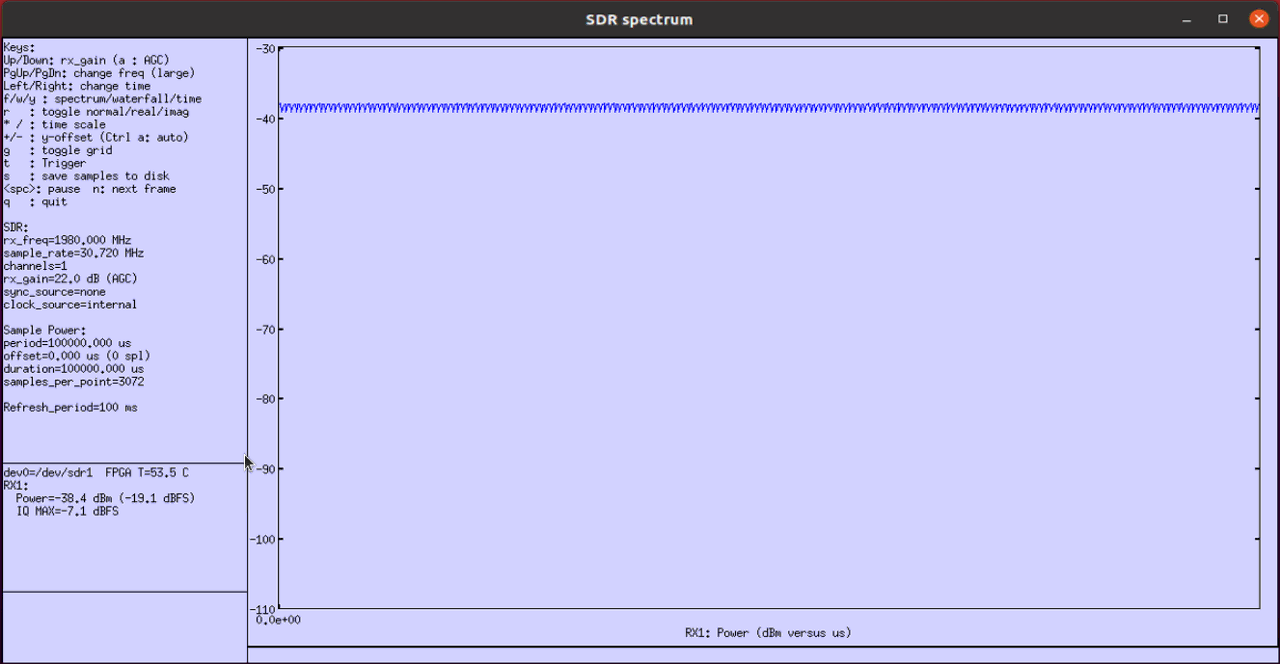
Now you can run spectrum analyzer to check on signal quality. I used Amarisoft sdr card and sdr_spectrum as the spectrum analyzer. The command line command to get this result was :
./sdr_spectrum -args "dev0=/dev/sdr1" -rx_freq 1980.00e6 -period 100
The first thing you may want to check is frequency spectrum which is the default view of sdr_spectrum. The spectrum view would vary (especialy in out of band region) depending on rx gain setting on reciever chain. The easiest way to set the optimal rx gain is to press 'a' key to let sdr_spectrum to adjust the value automatically.

Next thing to check is time domain profile (i.e, 'power vs time' or 'Zero Span' in spectrum analyzer terminology). You don't see any dips here since there is no SSB being transmitted.
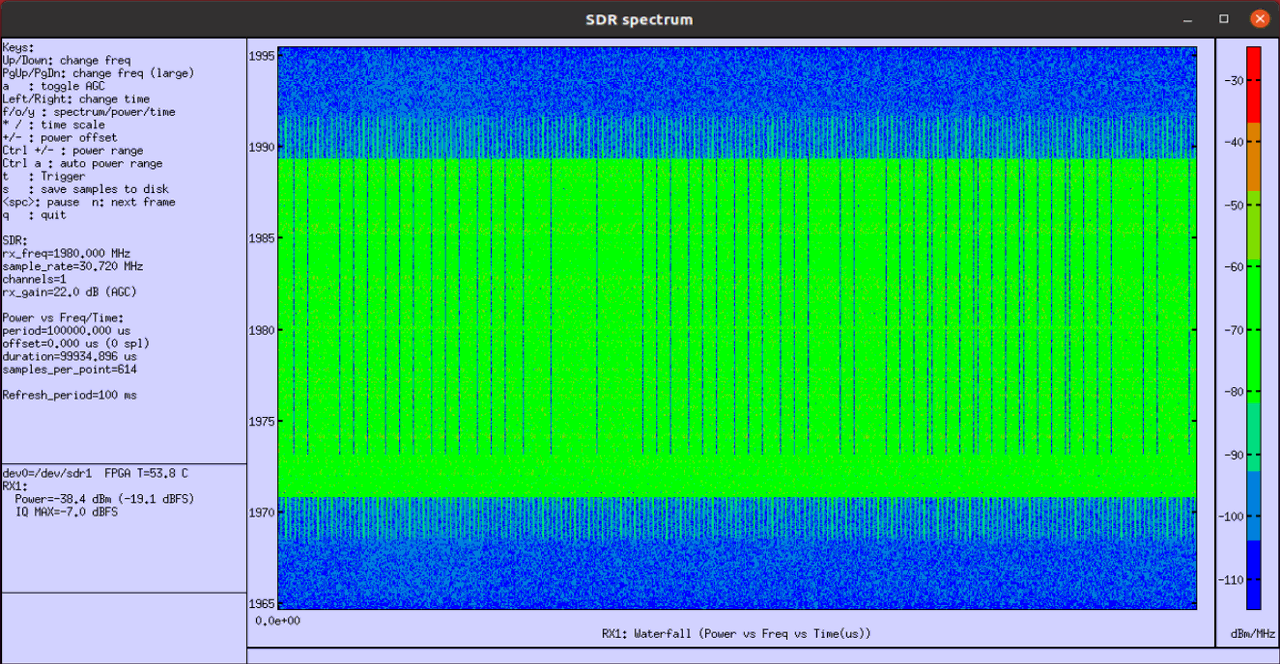
Next thing you may want to check is spectrogram of the signal. Vertical axis(y-axis) represents frequency and Horizontal axis(x-axis) indicates time(OFDM symbol index). The green area indicates the spectrum where high power is measured.
Test 6 : FDD TM1-1 SSB0000
This test shows the test configuration and the result with Test Case TM1-1 with SSB disabled (ssb_bitmap : 0000) in FDD mode.
Configuration
I have used gnb-tm-pdsch_TDD_0_TM_1-1_SSB-0000.cfg that is copined and modified from gnb-tm-pdsch.cfg .

Run
Check cell configuration and check if they are configured at high level as intended

In this tutorial, I will use spectrum analyzer to check the quality of the spectrum. To do it, you need to know of the TX frequency (physical frequency, not ARFCN). You can get the information with rf_info command.
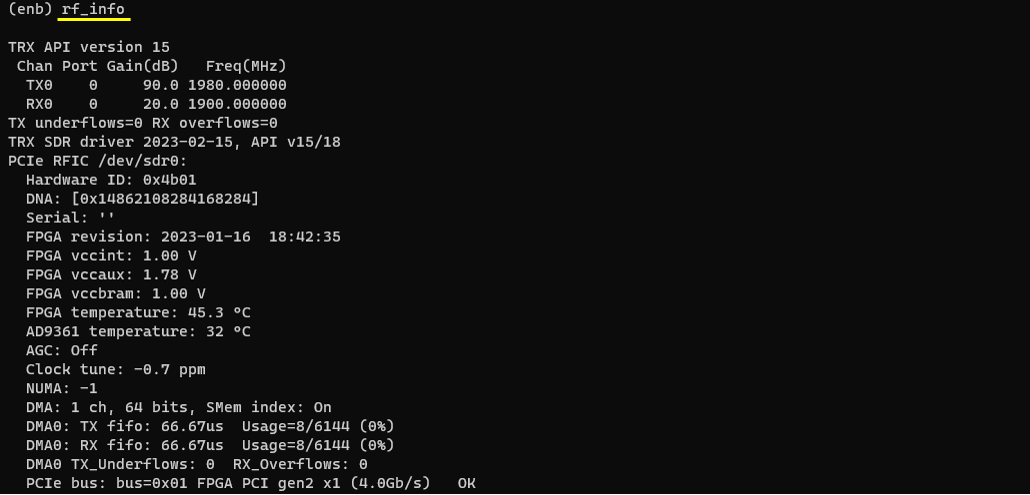
Now you can get the high level test result with t (trace) command. DL mcs and txok would be the first high level result you may want to check because these value would vary depending on configuration.

Analysis
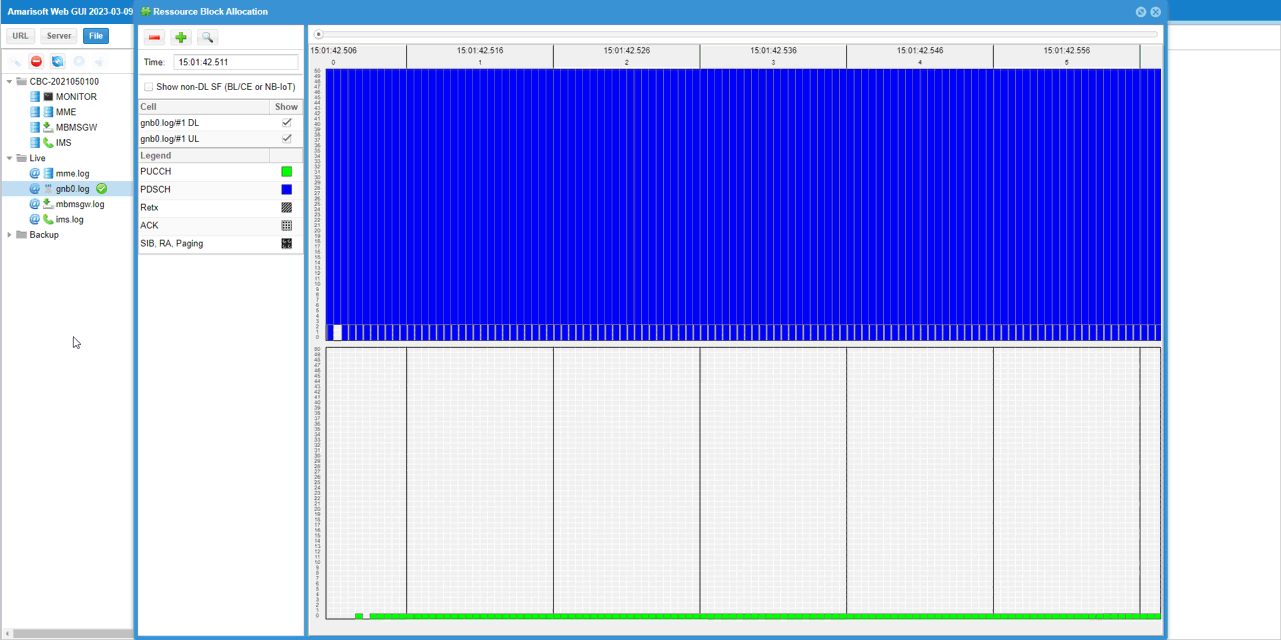
First thing you may want to check would be to check the PDSCH transmission at the PHY log level. This would be good hints on what you expect to see in "power vs time" view in the spectrum analyzer result.
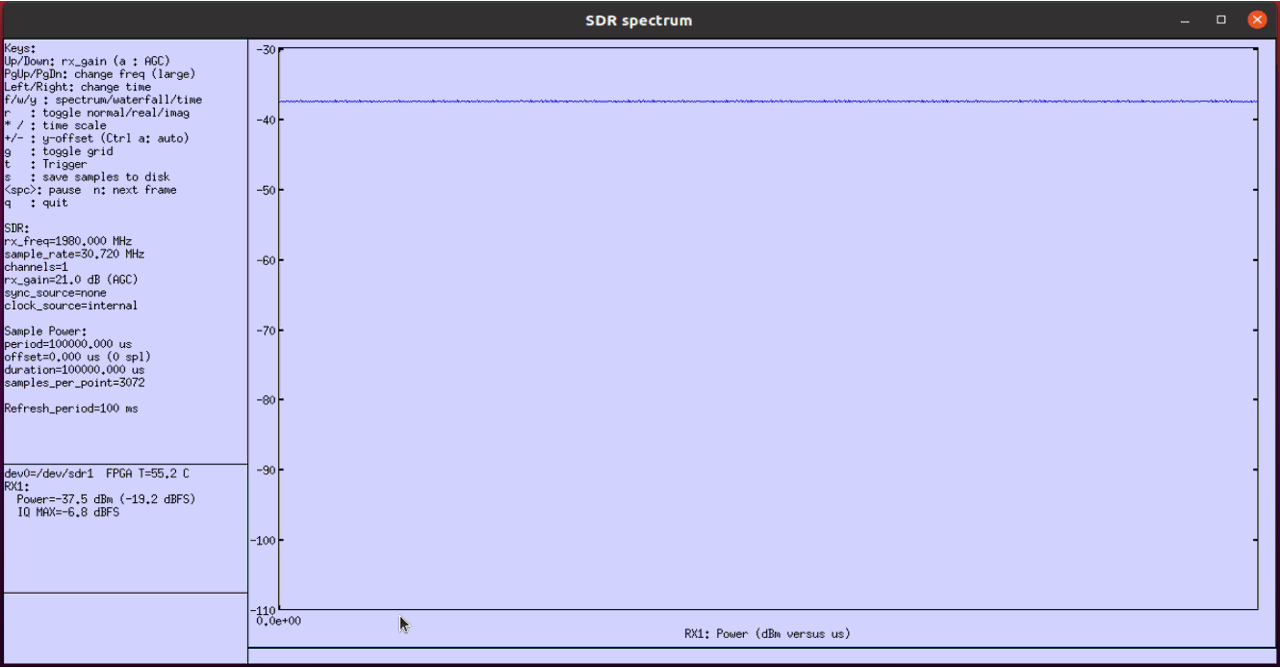
Now you can run spectrum analyzer to check on signal quality. I used Amarisoft sdr card and sdr_spectrum as the spectrum analyzer. The command line command to get this result was :
./sdr_spectrum -args "dev0=/dev/sdr1" -rx_freq 1980.00e6 -period 100
The first thing you may want to check is frequency spectrum which is the default view of sdr_spectrum. The spectrum view would vary (especialy in out of band region) depending on rx gain setting on reciever chain. The easiest way to set the optimal rx gain is to press 'a' key to let sdr_spectrum to adjust the value automatically.

Next thing to check is time domain profile (i.e, 'power vs time' or 'Zero Span' in spectrum analyzer terminology). You don't see any dips here since there is no SSB being transmitted.
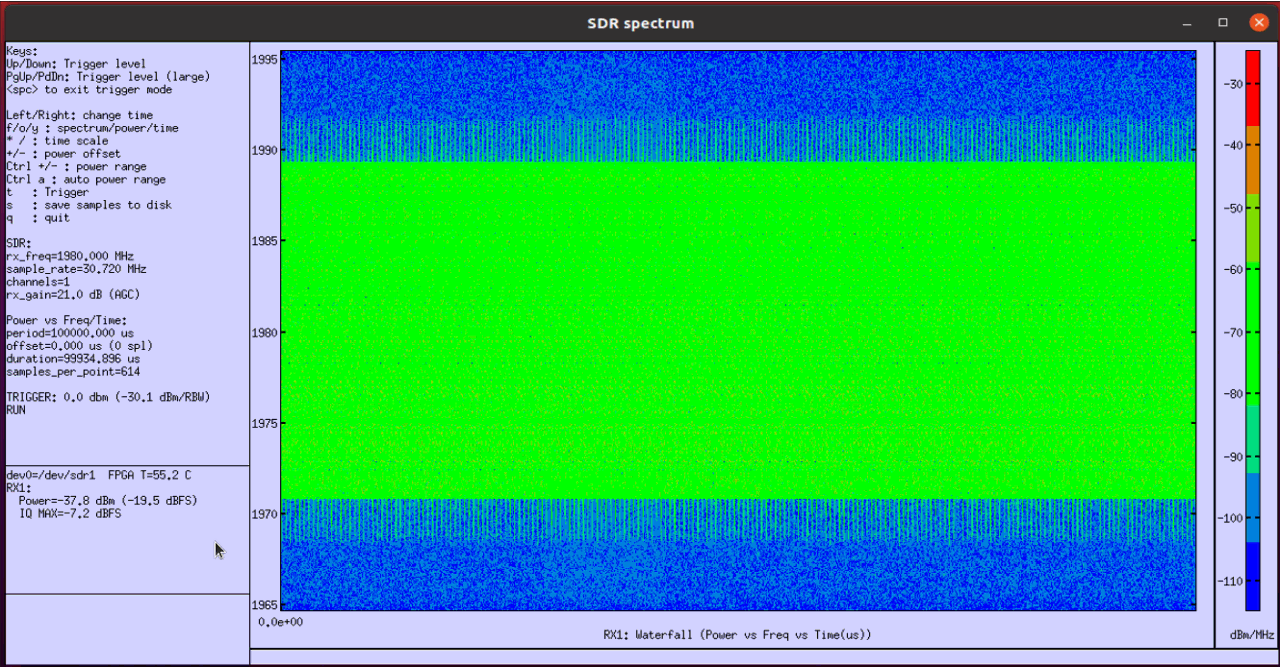
Next thing you may want to check is spectrogram of the signal. Vertical axis(y-axis) represents frequency and Horizontal axis(x-axis) indicates time(OFDM symbol index). The green area indicates the spectrum where high power is measured.
Test 7 : FDD TM1-2 SSB0000
This test shows the test configuration and the result with Test Case TM1-2 with SSB disabled (ssb_bitmap : 0000) in FDD mode.
Configuration
I have used gnb-tm-pdsch_TDD_0_TM_1-2_SSB-0000.cfgthat is copined and modified from gnb-tm-pdsch.cfg .

Run
Check cell configuration and check if they are configured at high level as intended

In this tutorial, I will use spectrum analyzer to check the quality of the spectrum. To do it, you need to know of the TX frequency (physical frequency, not ARFCN). You can get the information with rf_info command.
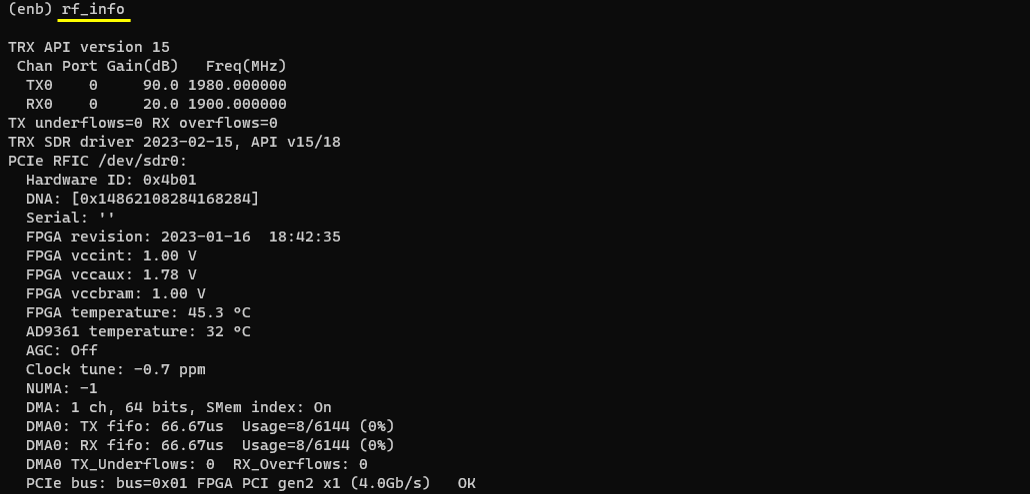
Now you can get the high level test result with t (trace) command. DL mcs and txok would be the first high level result you may want to check because these value would vary depending on configuration.

Analysis
First thing you may want to check would be to check the PDSCH transmission at the PHY log level. This would be good hints on what you expect to see in "power vs time" view in the spectrum analyzer result.
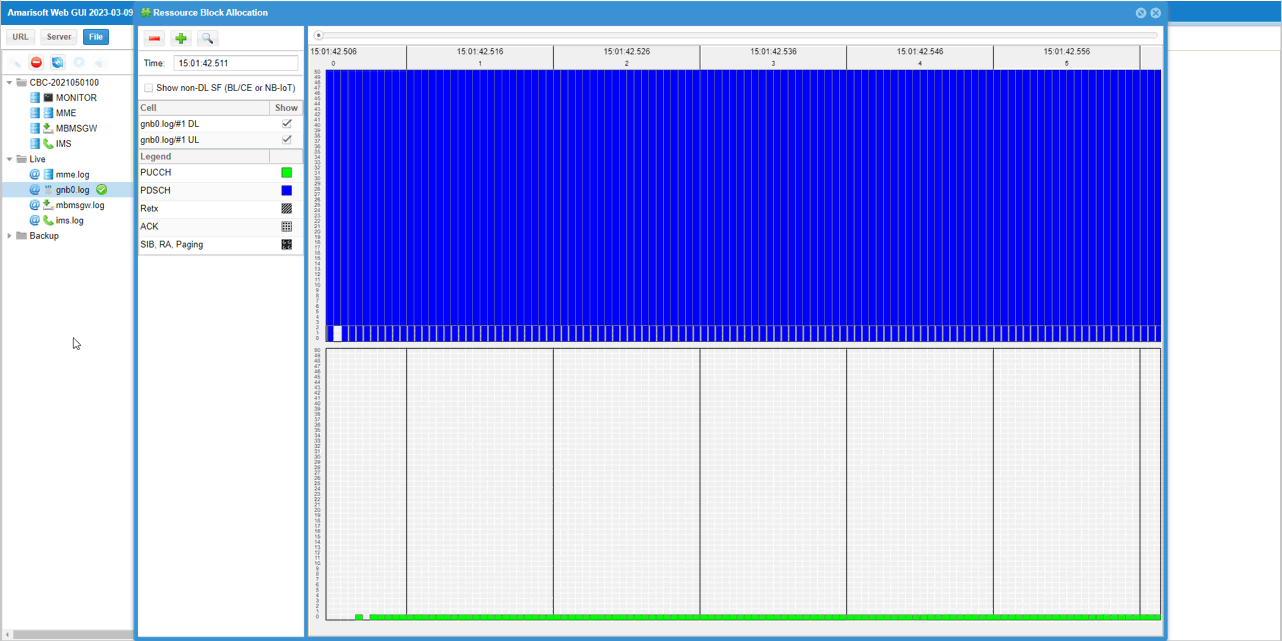
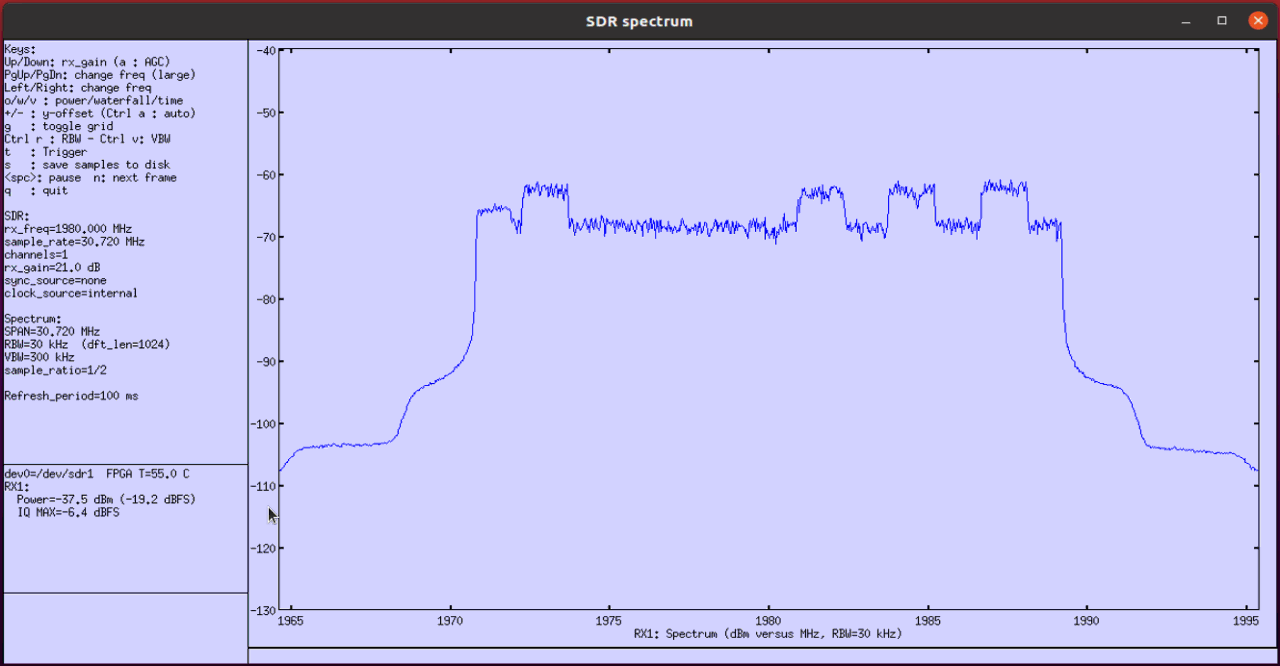
Now you can run spectrum analyzer to check on signal quality. I used Amarisoft sdr card and sdr_spectrum as the spectrum analyzer. The command line command to get this result was :
./sdr_spectrum -args "dev0=/dev/sdr1" -rx_freq 1980.00e6 -period 100
The first thing you may want to check is frequency spectrum which is the default view of sdr_spectrum. The spectrum view would vary (especialy in out of band region) depending on rx gain setting on reciever chain. The easiest way to set the optimal rx gain is to press 'a' key to let sdr_spectrum to adjust the value automatically.
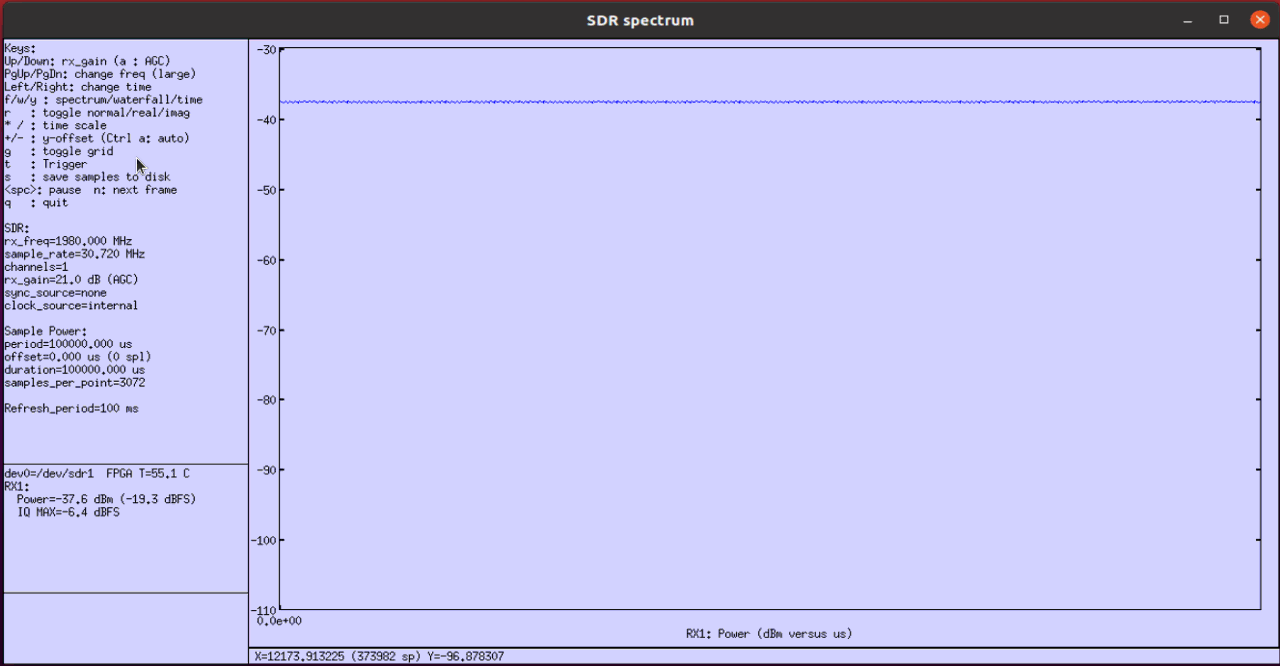
Next thing to check is time domain profile (i.e, 'power vs time' or 'Zero Span' in spectrum analyzer terminology). You don't see any dips here since there is no SSB being transmitted.
Next thing you may want to check is spectrogram of the signal. Vertical axis(y-axis) represents frequency and Horizontal axis(x-axis) indicates time(OFDM symbol index). The green area indicates the spectrum where high power is measured.
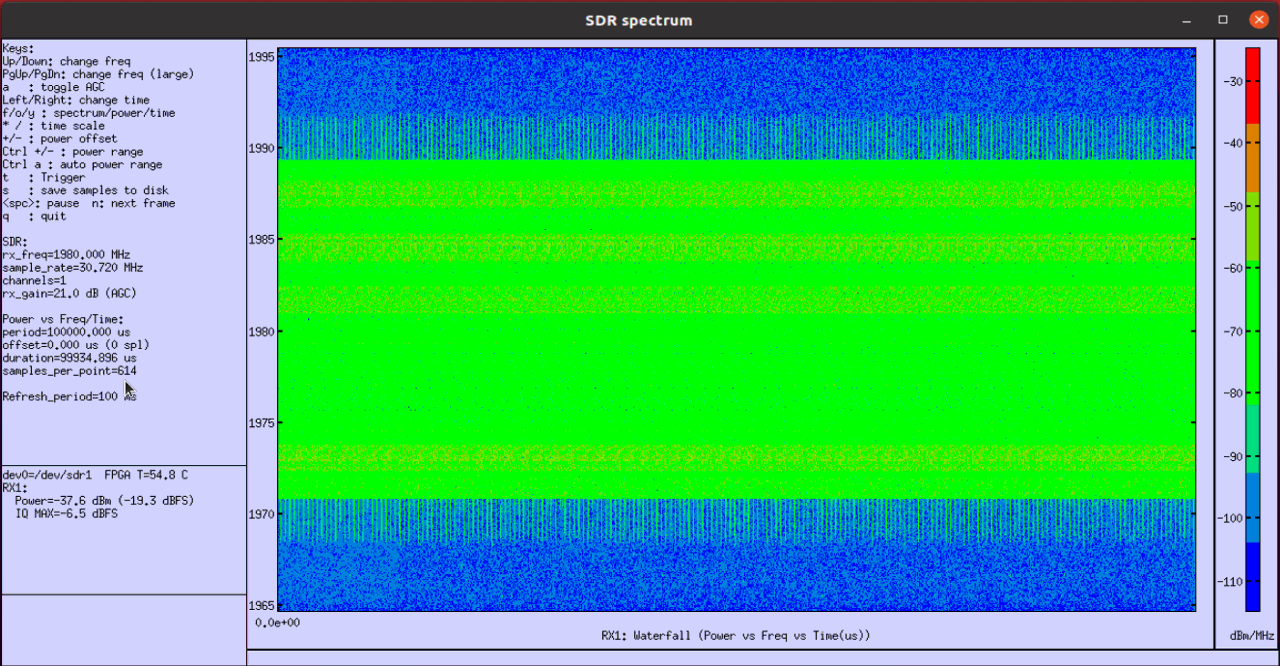
Test 8 : FDD TM2 SSB0000
This test shows the test configuration and the result with Test Case TM2 with SSB disabled (ssb_bitmap : 0000) in FDD mode.
Configuration
I have used gnb-tm-pdsch_TDD_0_TM_2_SSB-0000.cfgthat is copined and modified from gnb-tm-pdsch.cfg .

Run
Check cell configuration and check if they are configured at high level as intended

In this tutorial, I will use spectrum analyzer to check the quality of the spectrum. To do it, you need to know of the TX frequency (physical frequency, not ARFCN). You can get the information with rf_info command.
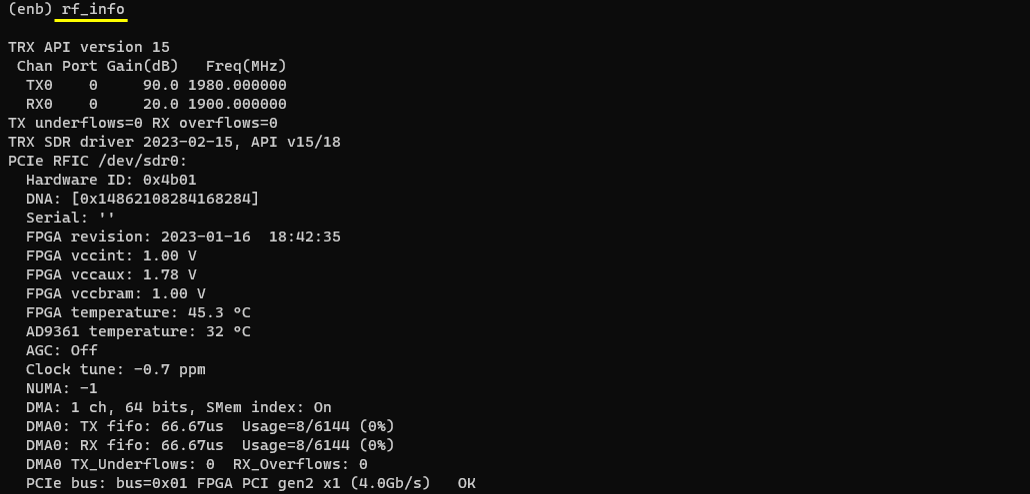
Now you can get the high level test result with t (trace) command. DL mcs and txok would be the first high level result you may want to check because these value would vary depending on configuration.

Analysis
First thing you may want to check would be to check the PDSCH transmission at the PHY log level. This would be good hints on what you expect to see in "power vs time" view in the spectrum analyzer result.

Now you can run spectrum analyzer to check on signal quality. I used Amarisoft sdr card and sdr_spectrum as the spectrum analyzer. The command line command to get this result was :
./sdr_spectrum -args "dev0=/dev/sdr1" -rx_freq 1980.00e6 -period 100
The first thing you may want to check is frequency spectrum which is the default view of sdr_spectrum. The spectrum view would vary (especialy in out of band region) depending on rx gain setting on reciever chain. The easiest way to set the optimal rx gain is to press 'a' key to let sdr_spectrum to adjust the value automatically.
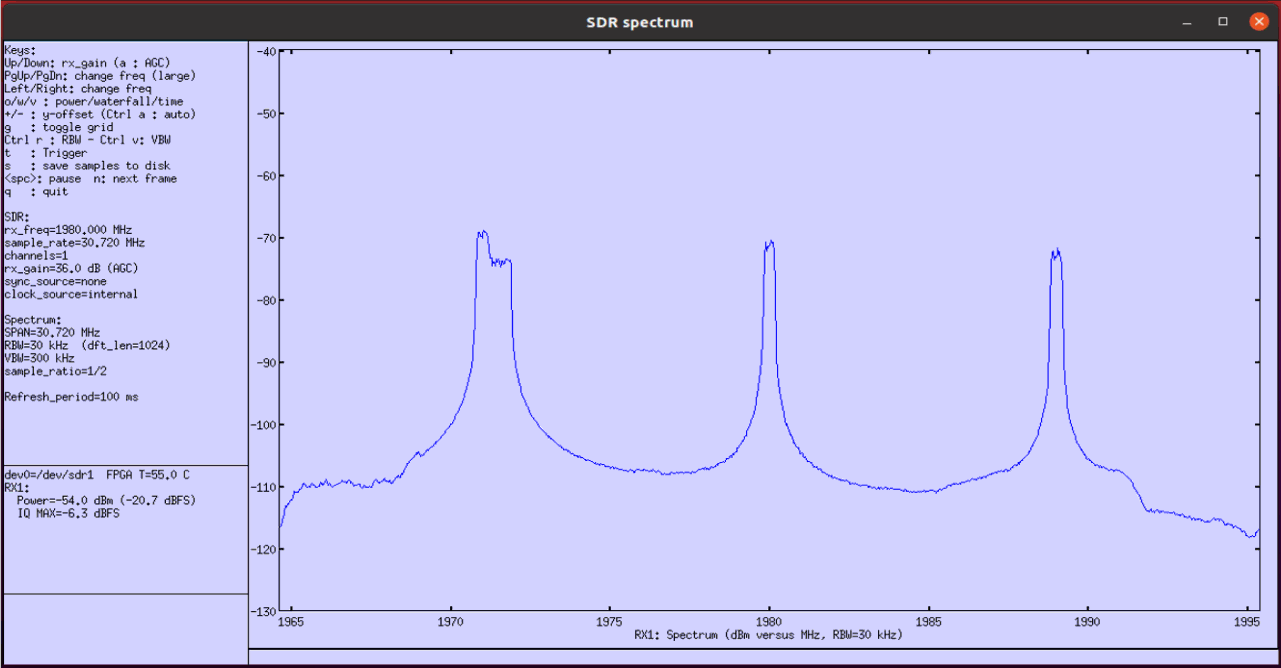
Next thing to check is time domain profile (i.e, 'power vs time' or 'Zero Span' in spectrum analyzer terminology).
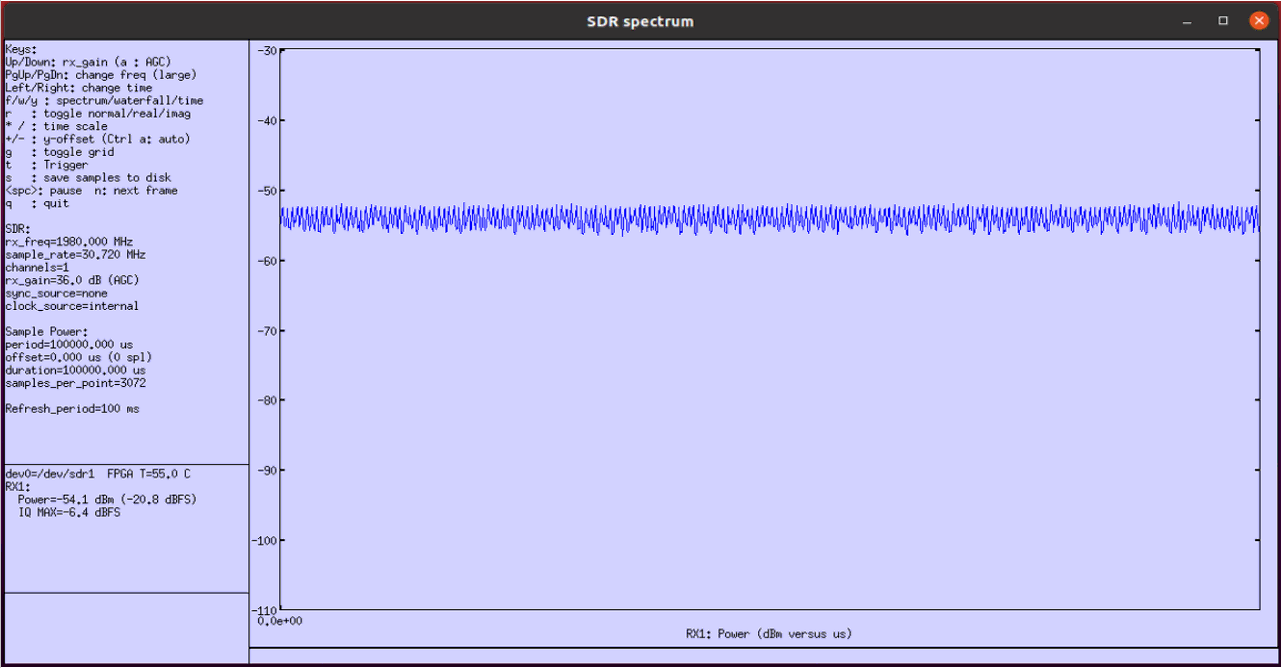
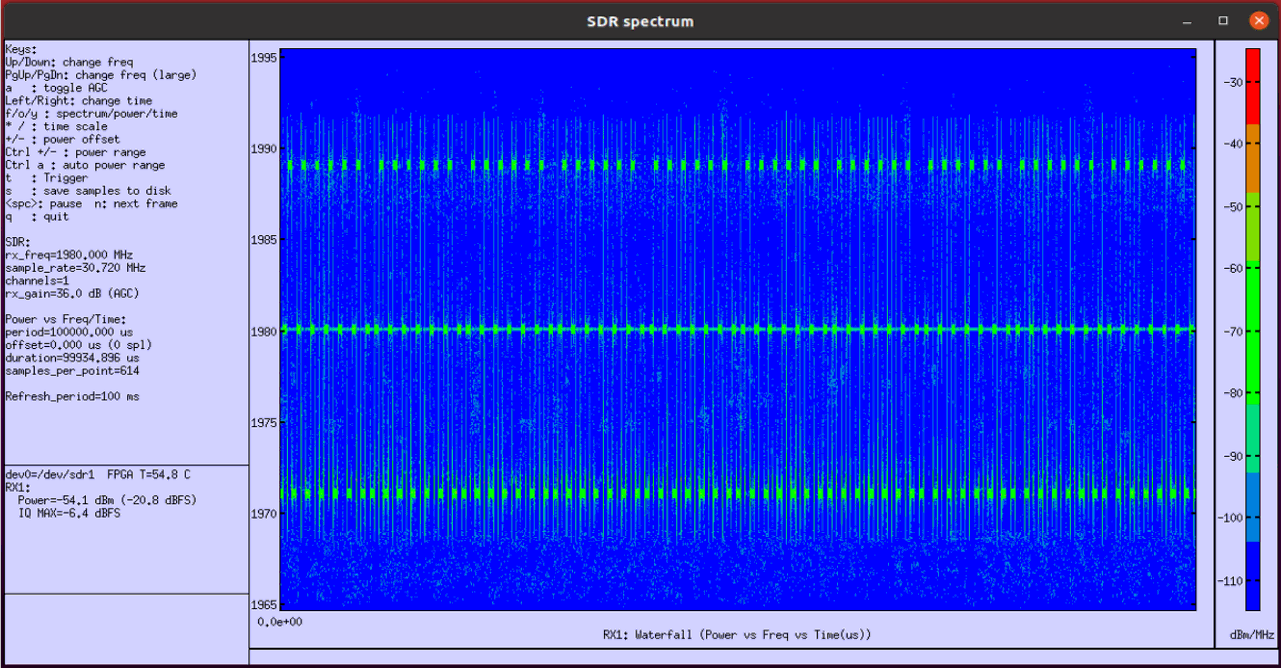
Next thing you may want to check is spectrogram of the signal. Vertical axis(y-axis) represents frequency and Horizontal axis(x-axis) indicates time(OFDM symbol index). The green area indicates the spectrum where high power is measured.
Test 9 : FDD TM1-2a SSB0000
This test shows the test configuration and the result with Test Case TM1-2a with SSB disabled (ssb_bitmap : 0000) in FDD mode.
Configuration
I have used gnb-tm-pdsch_TDD_0_TM2a_SSB-0000.cfgthat is copined and modified from gnb-tm-pdsch.cfg .

Run
Check cell configuration and check if they are configured at high level as intended

In this tutorial, I will use spectrum analyzer to check the quality of the spectrum. To do it, you need to know of the TX frequency (physical frequency, not ARFCN). You can get the information with rf_info command.
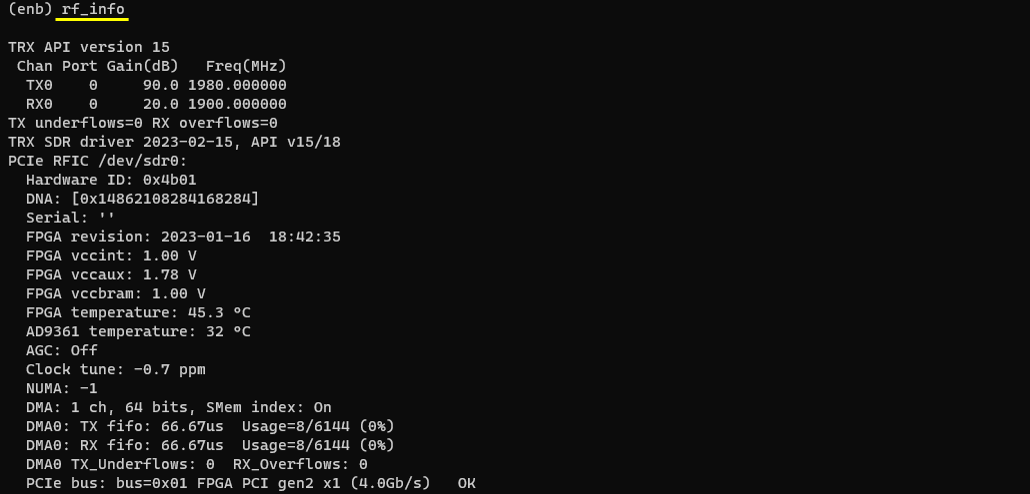
Now you can get the high level test result with t (trace) command. DL mcs and txok would be the first high level result you may want to check because these value would vary depending on configuration.

Analysis
First thing you may want to check would be to check the PDSCH transmission at the PHY log level. This would be good hints on what you expect to see in "power vs time" view in the spectrum analyzer result.

Now you can run spectrum analyzer to check on signal quality. I used Amarisoft sdr card and sdr_spectrum as the spectrum analyzer. The command line command to get this result was :
./sdr_spectrum -args "dev0=/dev/sdr1" -rx_freq 1980.00e6 -period 100
The first thing you may want to check is frequency spectrum which is the default view of sdr_spectrum. The spectrum view would vary (especialy in out of band region) depending on rx gain setting on reciever chain. The easiest way to set the optimal rx gain is to press 'a' key to let sdr_spectrum to adjust the value automatically.
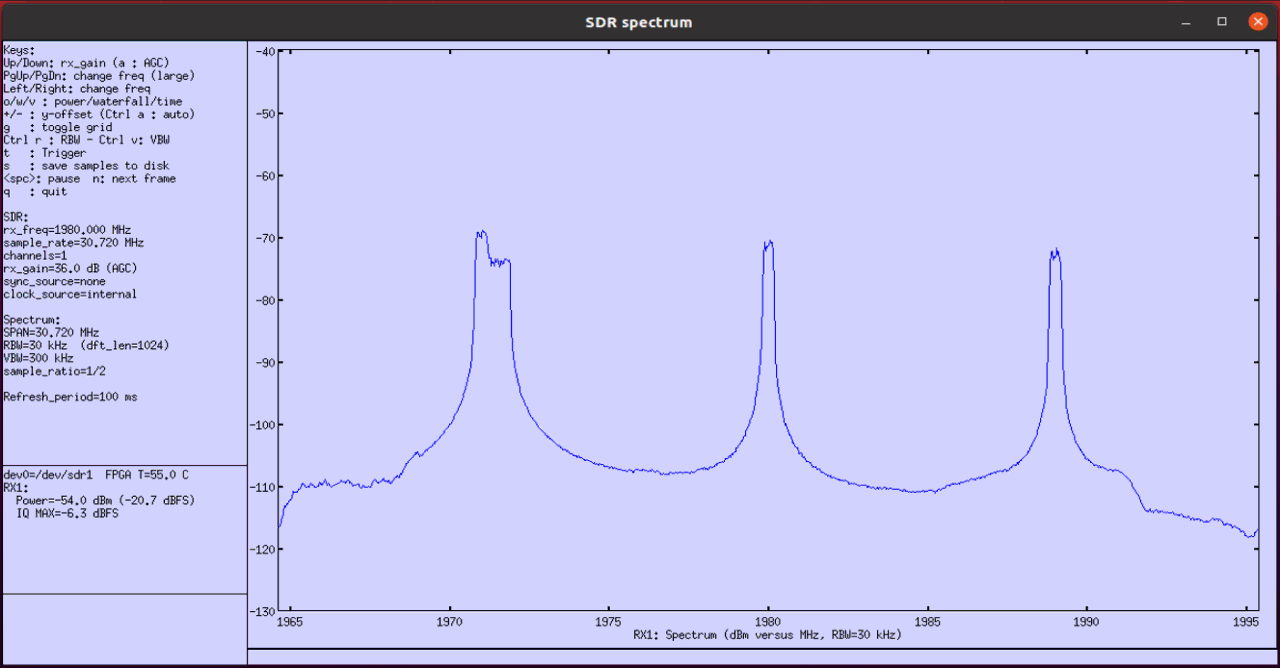
Next thing to check is time domain profile (i.e, 'power vs time' or 'Zero Span' in spectrum analyzer terminology).
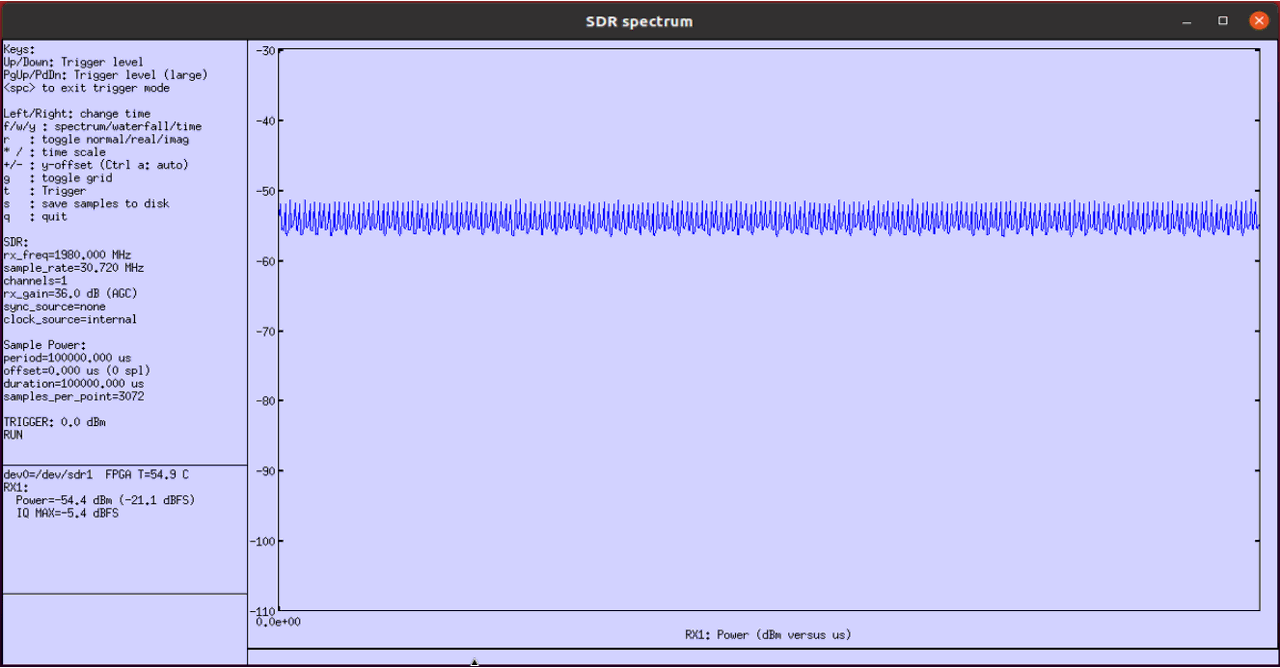
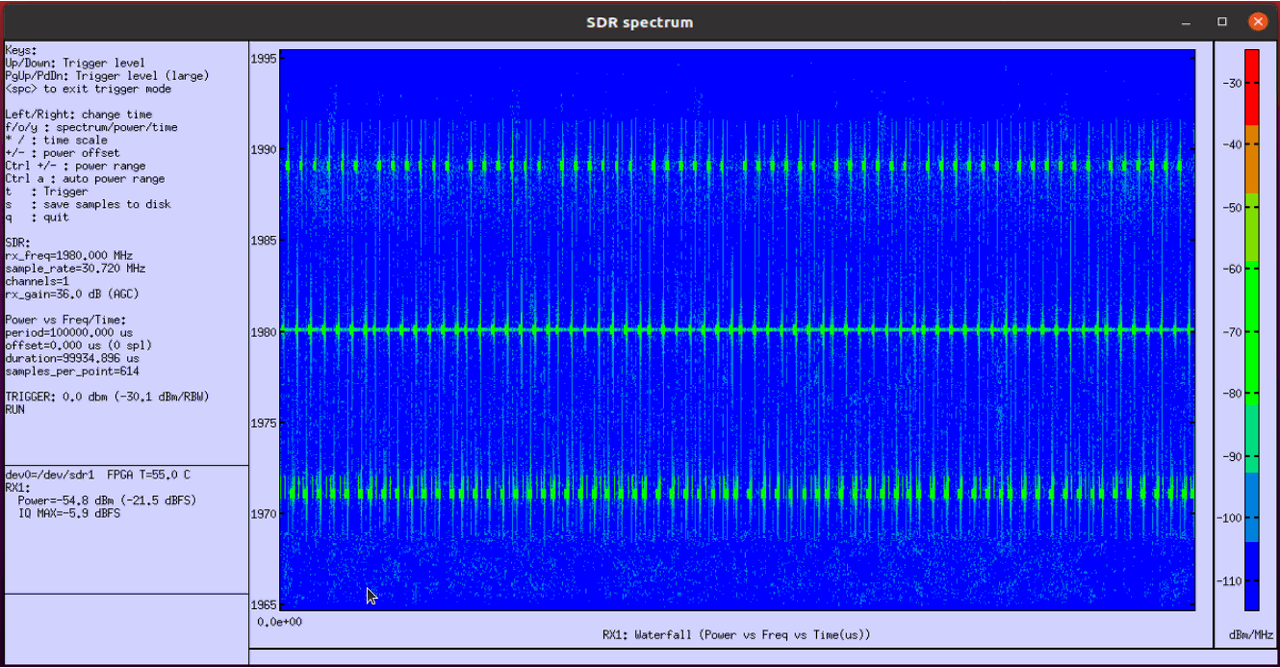
Next thing you may want to check is spectrogram of the signal. Vertical axis(y-axis) represents frequency and Horizontal axis(x-axis) indicates time(OFDM symbol index). The green area indicates the spectrum where high power is measured.
Test 10 : FDD TM3-1 SSB0000
This test shows the test configuration and the result with Test Case TM3-1 with SSB disabled (ssb_bitmap : 0000) in FDD mode.
Configuration
I have used gnb-tm-pdsch_TDD_0_TM3-1_SSB-0000.cfgthat is copined and modified from gnb-tm-pdsch.cfg .

Run
Check cell configuration and check if they are configured at high level as intended

In this tutorial, I will use spectrum analyzer to check the quality of the spectrum. To do it, you need to know of the TX frequency (physical frequency, not ARFCN). You can get the information with rf_info command.
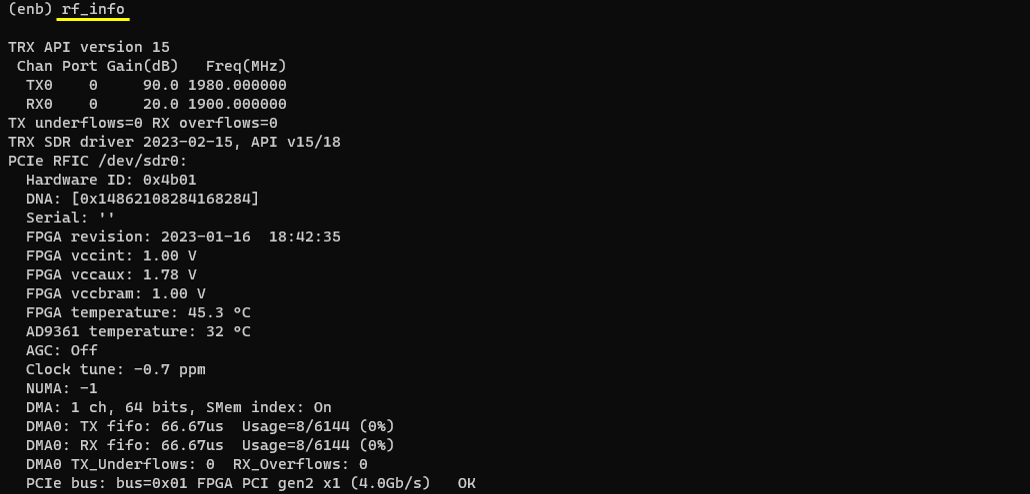
Now you can get the high level test result with t (trace) command. DL mcs and txok would be the first high level result you may want to check because these value would vary depending on configuration.

Analysis
First thing you may want to check would be to check the PDSCH transmission at the PHY log level. This would be good hints on what you expect to see in "power vs time" view in the spectrum analyzer result.

Now you can run spectrum analyzer to check on signal quality. I used Amarisoft sdr card and sdr_spectrum as the spectrum analyzer. The command line command to get this result was :
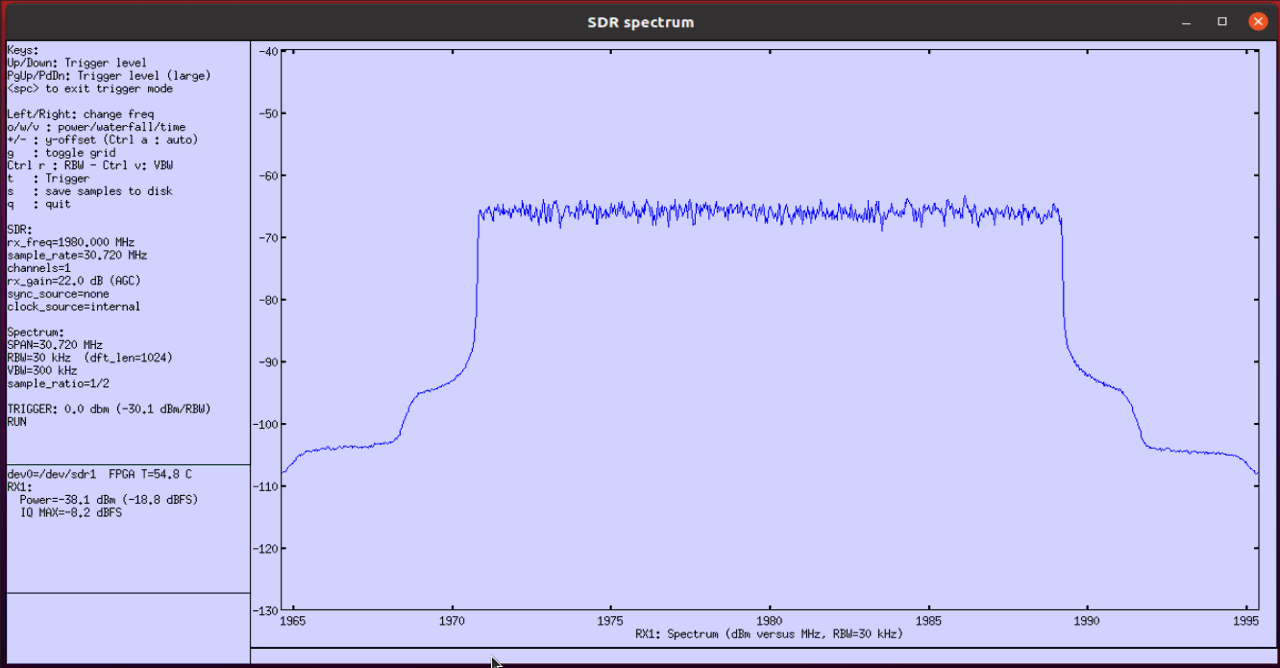
./sdr_spectrum -args "dev0=/dev/sdr1" -rx_freq 1980.00e6 -period 100
The first thing you may want to check is frequency spectrum which is the default view of sdr_spectrum. The spectrum view would vary (especialy in out of band region) depending on rx gain setting on reciever chain. The easiest way to set the optimal rx gain is to press 'a' key to let sdr_spectrum to adjust the value automatically.
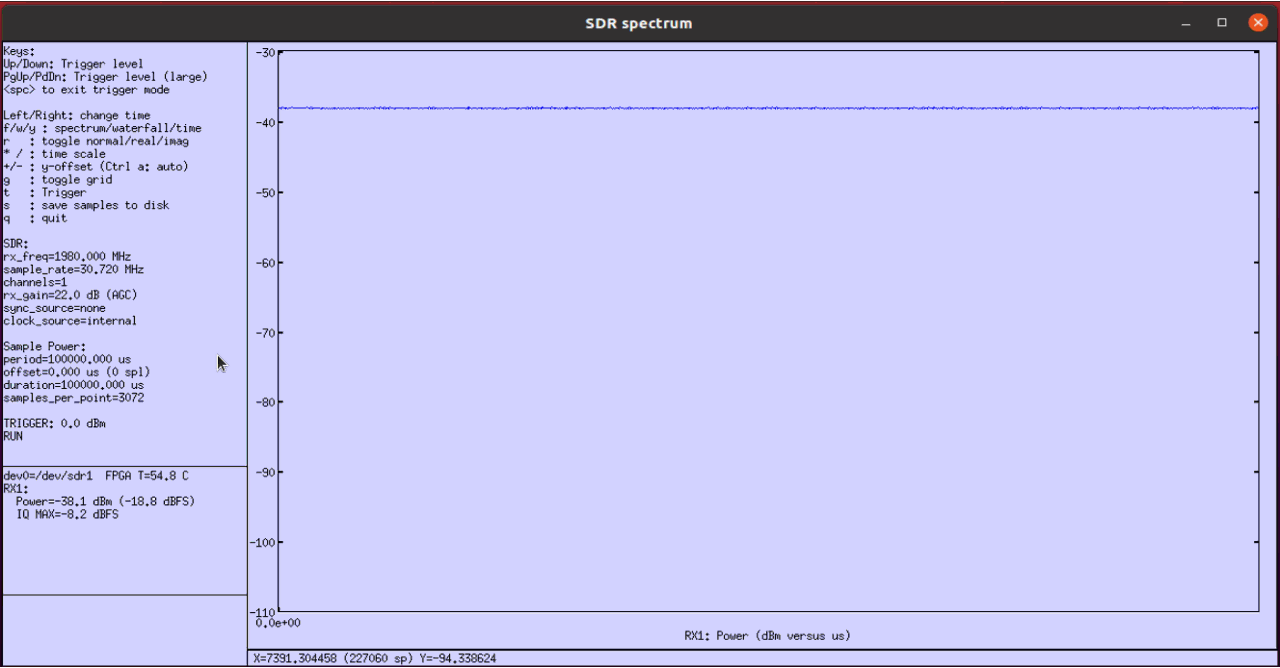
Next thing to check is time domain profile (i.e, 'power vs time' or 'Zero Span' in spectrum analyzer terminology). You don't see any dips here since there is no SSB being transmitted.
Next thing you may want to check is spectrogram of the signal. Vertical axis(y-axis) represents frequency and Horizontal axis(x-axis) indicates time(OFDM symbol index). The green area indicates the spectrum where high power is measured.
Test 11 : FDD TM3-1a SSB0000
This test shows the test configuration and the result with Test Case TM3-1a with SSB disabled (ssb_bitmap : 0000) in FDD mode.
Configuration
I have used gnb-tm-pdsch_TDD_0_TM3-1a_SSB-0000.cfg that is copined and modified from gnb-tm-pdsch.cfg .

Run
Check cell configuration and check if they are configured at high level as intended

In this tutorial, I will use spectrum analyzer to check the quality of the spectrum. To do it, you need to know of the TX frequency (physical frequency, not ARFCN). You can get the information with rf_info command.
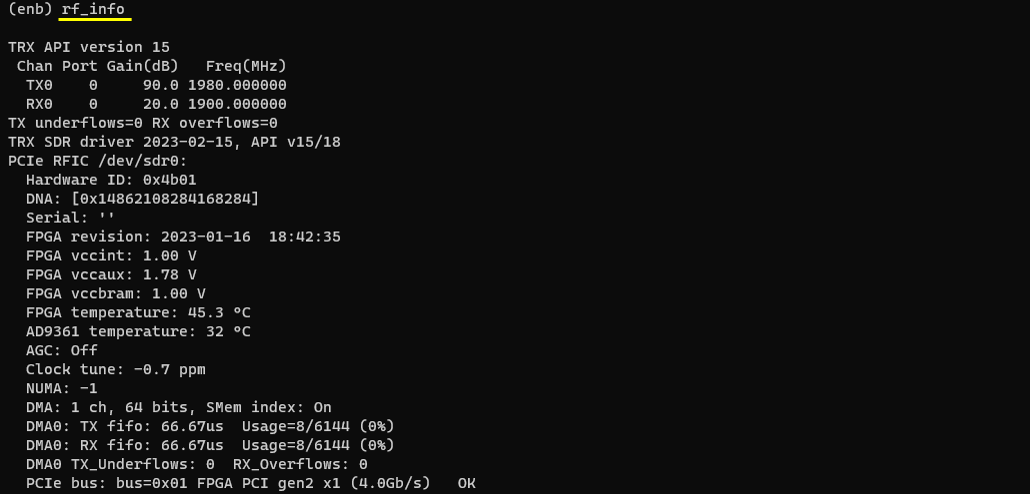
Now you can get the high level test result with t (trace) command. DL mcs and txok would be the first high level result you may want to check because these value would vary depending on configuration.

Analysis
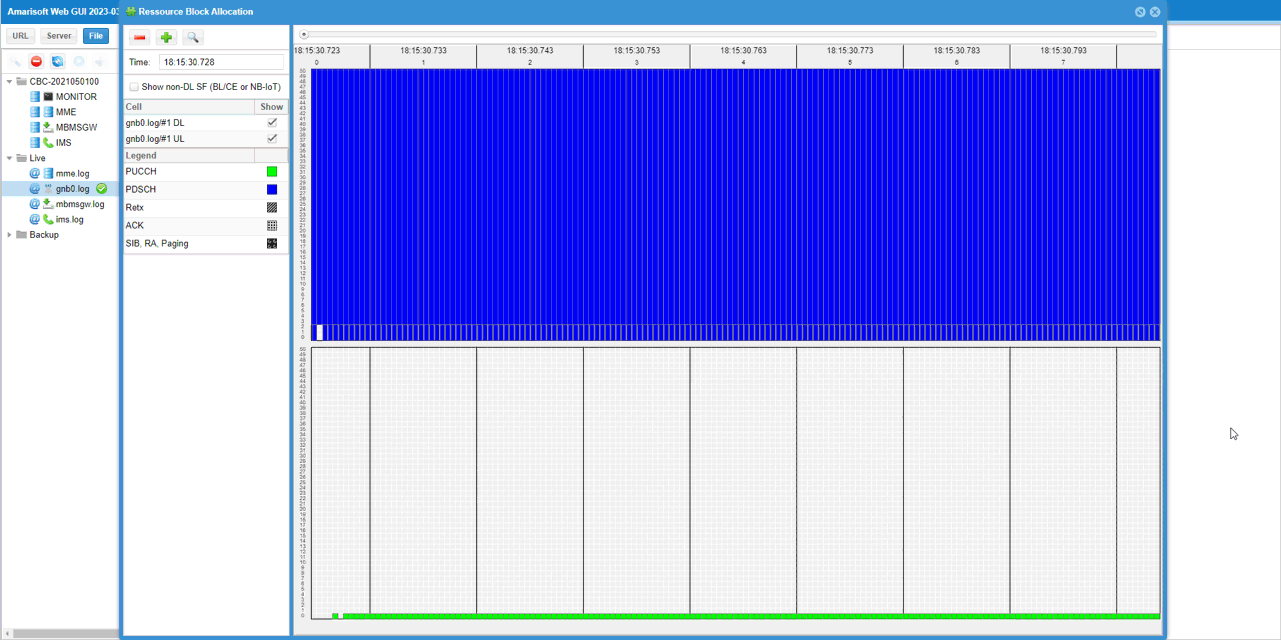
First thing you may want to check would be to check the PDSCH transmission at the PHY log level. This would be good hints on what you expect to see in "power vs time" view in the spectrum analyzer result.
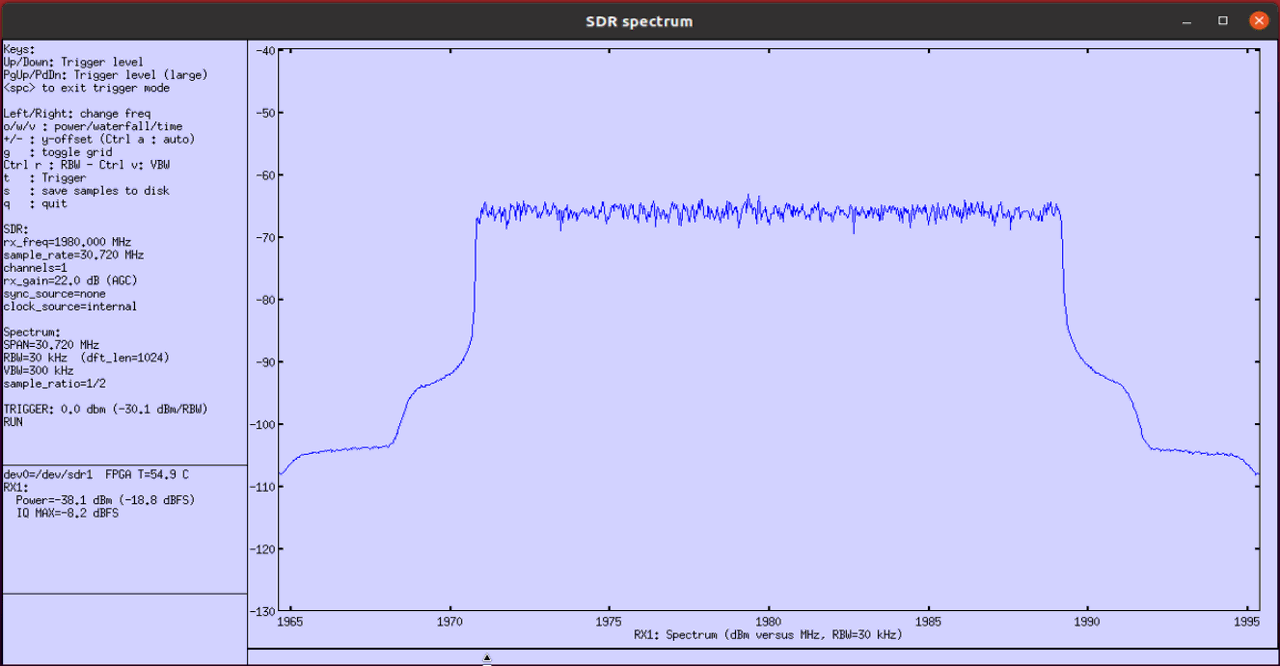
Now you can run spectrum analyzer to check on signal quality. I used Amarisoft sdr card and sdr_spectrum as the spectrum analyzer. The command line command to get this result was :
./sdr_spectrum -args "dev0=/dev/sdr1" -rx_freq 1980.00e6 -period 100
The first thing you may want to check is frequency spectrum which is the default view of sdr_spectrum. The spectrum view would vary (especialy in out of band region) depending on rx gain setting on reciever chain. The easiest way to set the optimal rx gain is to press 'a' key to let sdr_spectrum to adjust the value automatically.
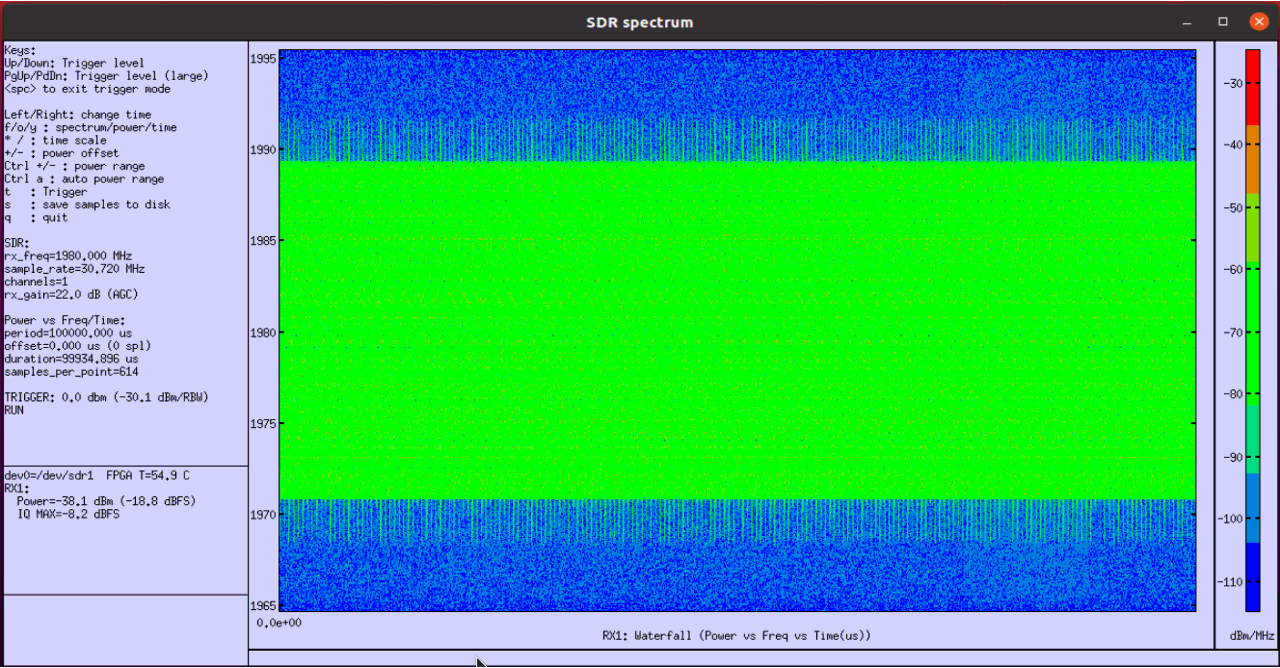
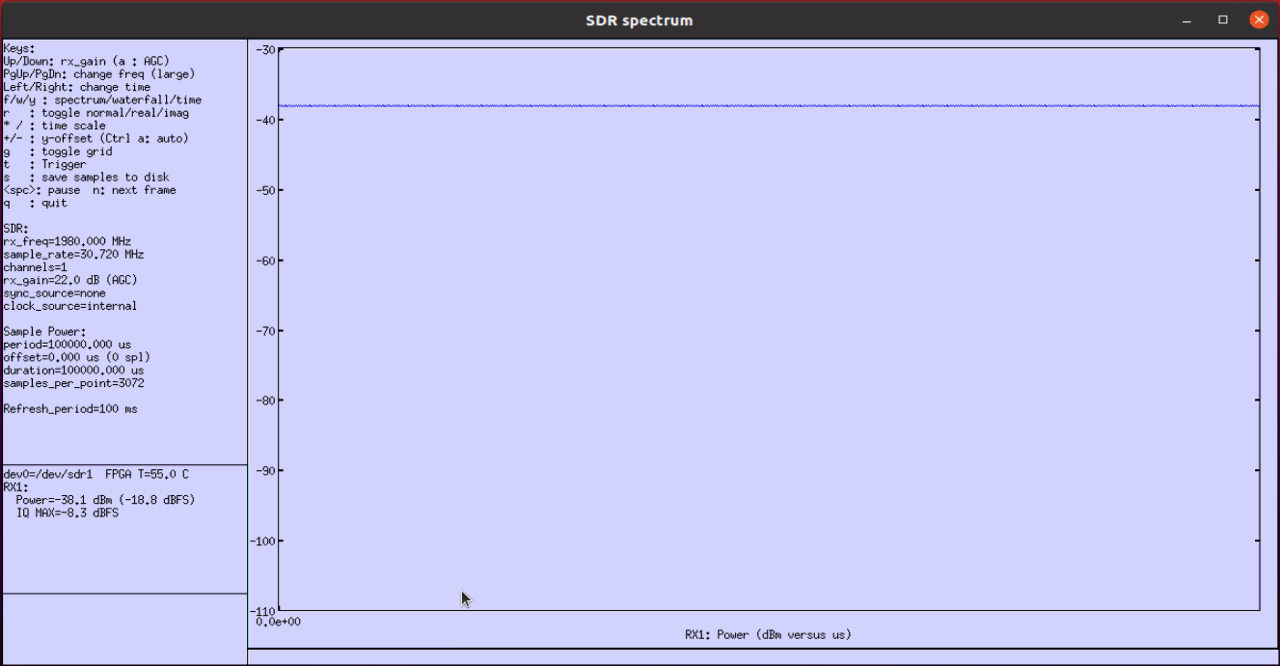
Next thing to check is time domain profile (i.e, 'power vs time' or 'Zero Span' in spectrum analyzer terminology). You don't see any dips here since there is no SSB being transmitted.
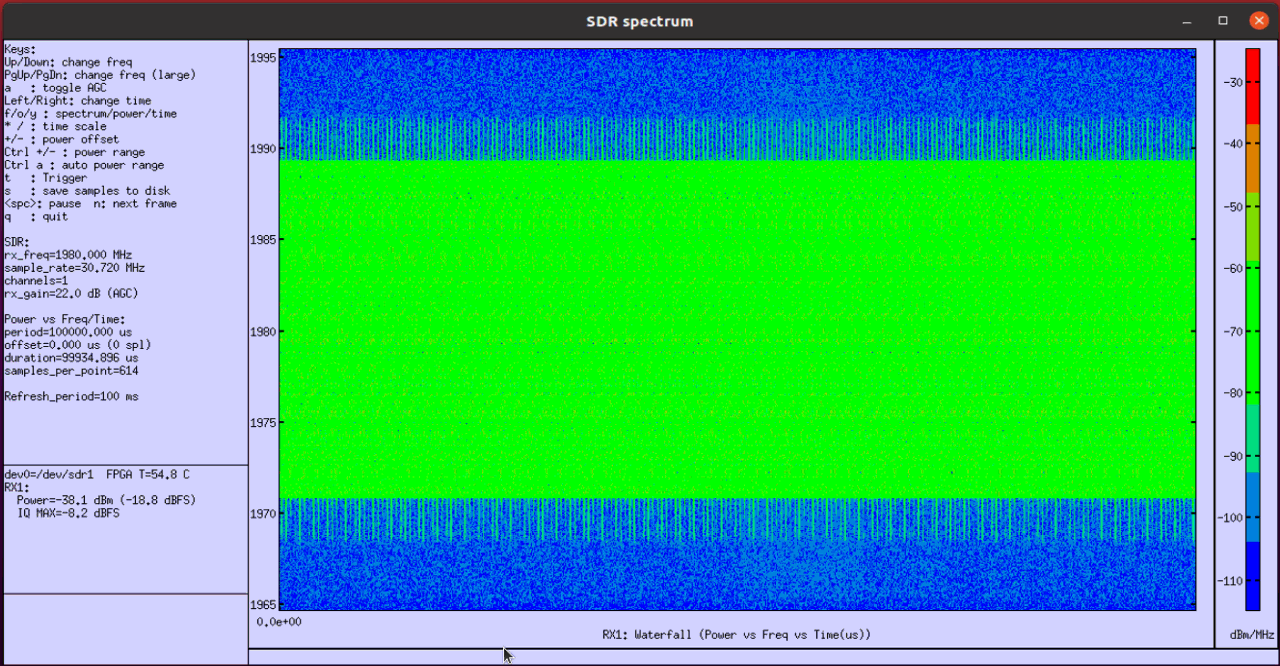
Next thing you may want to check is spectrogram of the signal. Vertical axis(y-axis) represents frequency and Horizontal axis(x-axis) indicates time(OFDM symbol index). The green area indicates the spectrum where high power is measured.
Test 12 : FDD TM3-2 SSB0000
This test shows the test configuration and the result with Test Case TM3-2 with SSB disabled (ssb_bitmap : 0000) in FDD mode.
Configuration
I have used gnb-tm-pdsch_TDD_0_TM3-2_SSB-0000.cfg that is copined and modified from gnb-tm-pdsch.cfg .

Run
Check cell configuration and check if they are configured at high level as intended

In this tutorial, I will use spectrum analyzer to check the quality of the spectrum. To do it, you need to know of the TX frequency (physical frequency, not ARFCN). You can get the information with rf_info command.
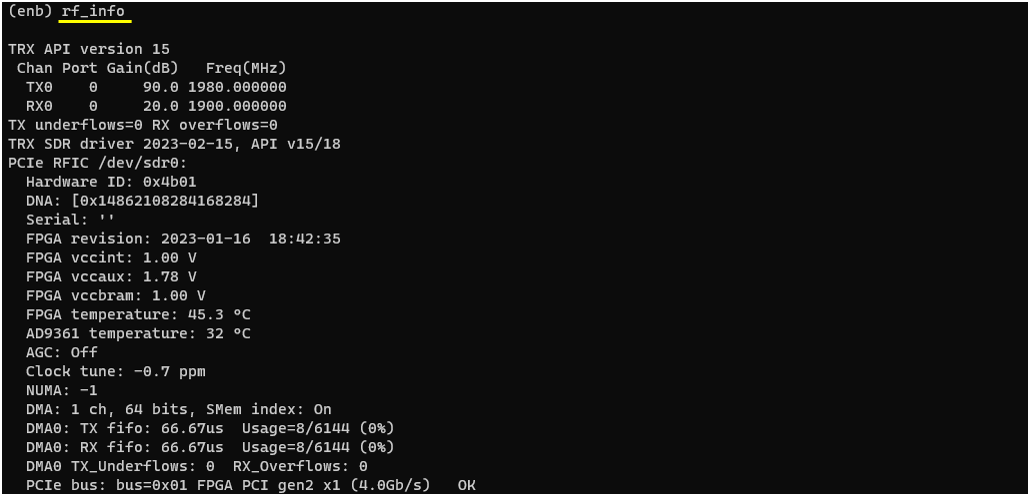
Now you can get the high level test result with t (trace) command. DL mcs and txok would be the first high level result you may want to check because these value would vary depending on configuration.

Analysis
First thing you may want to check would be to check the PDSCH transmission at the PHY log level. This would be good hints on what you expect to see in "power vs time" view in the spectrum analyzer result.
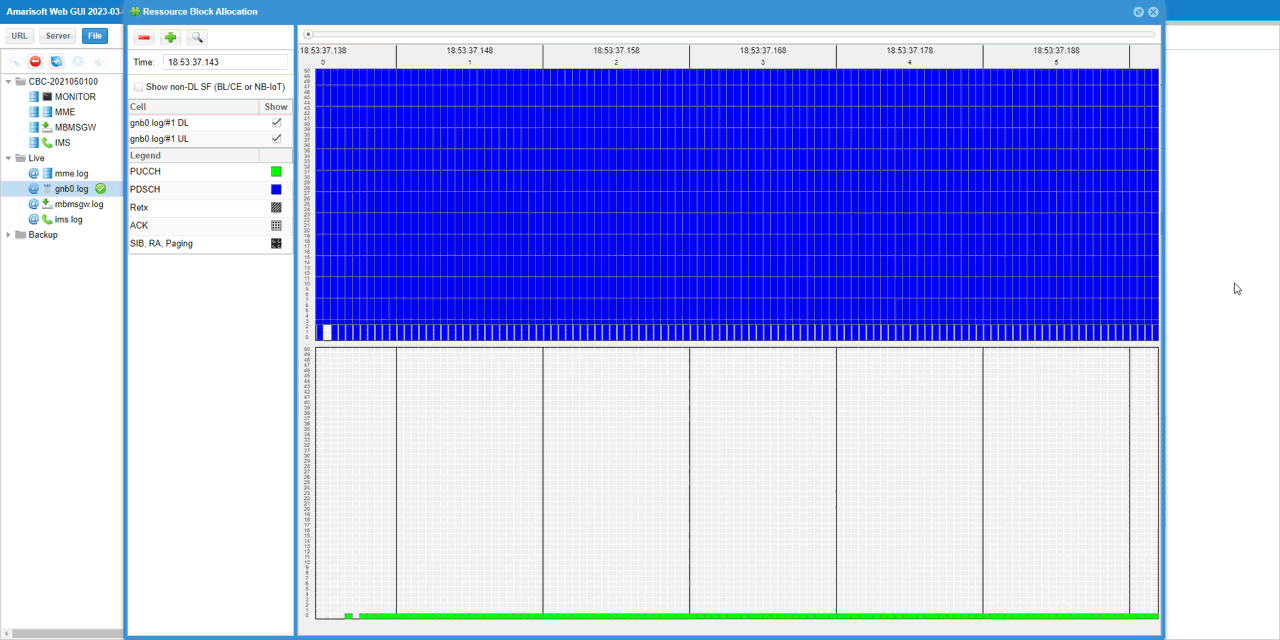
Now you can run spectrum analyzer to check on signal quality. I used Amarisoft sdr card and sdr_spectrum as the spectrum analyzer. The command line command to get this result was :
./sdr_spectrum -args "dev0=/dev/sdr1" -rx_freq 1980.00e6 -period 100
The first thing you may want to check is frequency spectrum which is the default view of sdr_spectrum. The spectrum view would vary (especialy in out of band region) depending on rx gain setting on reciever chain. The easiest way to set the optimal rx gain is to press 'a' key to let sdr_spectrum to adjust the value automatically.
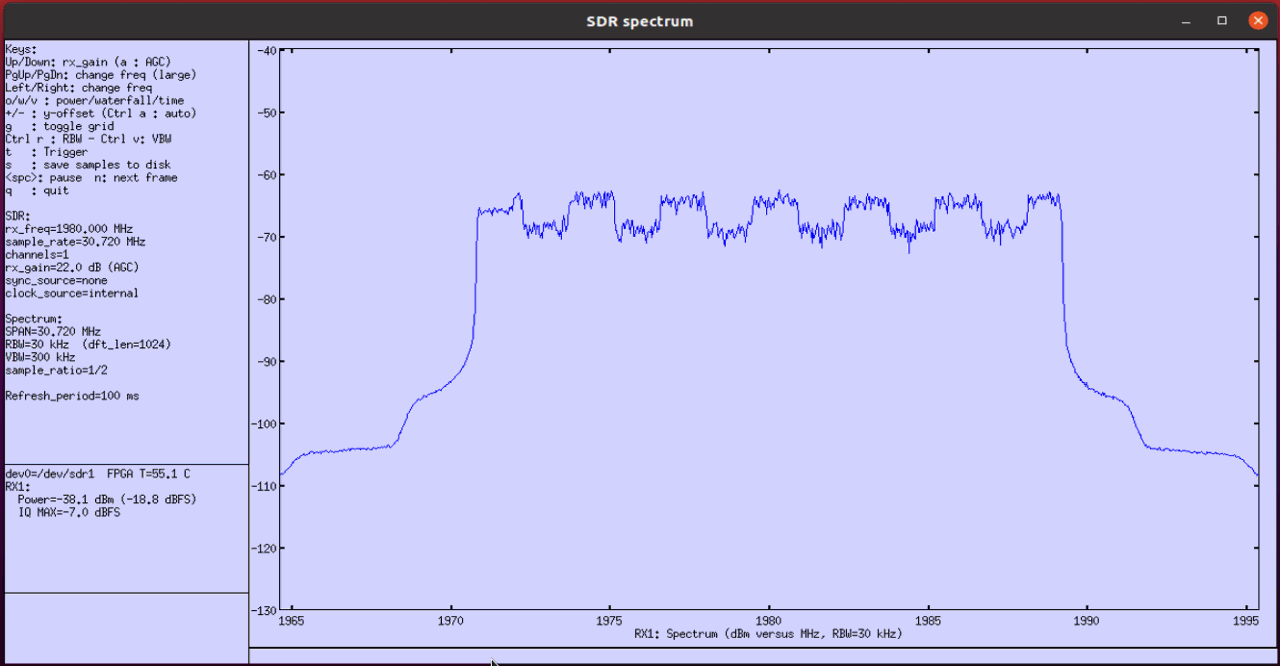
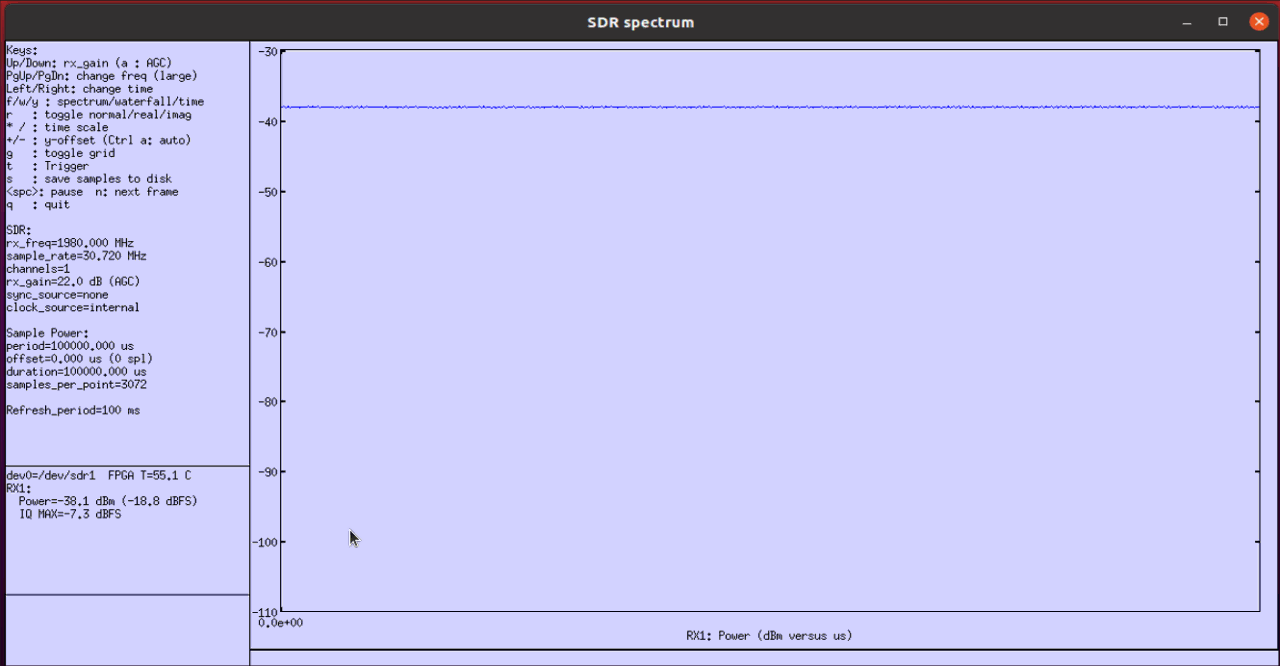
Next thing to check is time domain profile (i.e, 'power vs time' or 'Zero Span' in spectrum analyzer terminology). You don't see any dips here since there is no SSB being transmitted.
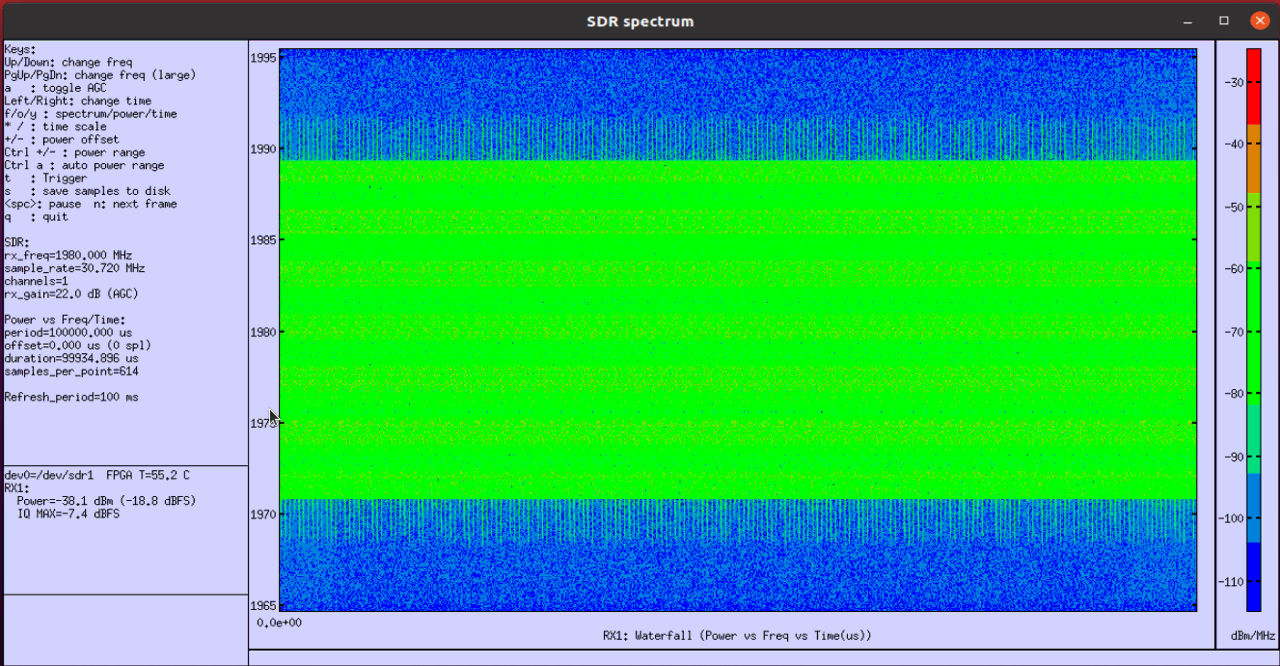
Next thing you may want to check is spectrogram of the signal. Vertical axis(y-axis) represents frequency and Horizontal axis(x-axis) indicates time(OFDM symbol index). The green area indicates the spectrum where high power is measured.
Test 13 : FDD TM3-3 SSB0000
This test shows the test configuration and the result with Test Case TM3-3 with SSB disabled (ssb_bitmap : 0000) in FDD mode.
Configuration
I have used gnb-tm-pdsch_TDD_0_TM3-3_SSB-0000.cfg that is copined and modified from gnb-tm-pdsch.cfg .

Run
Check cell configuration and check if they are configured at high level as intended

In this tutorial, I will use spectrum analyzer to check the quality of the spectrum. To do it, you need to know of the TX frequency (physical frequency, not ARFCN). You can get the information with rf_info command.
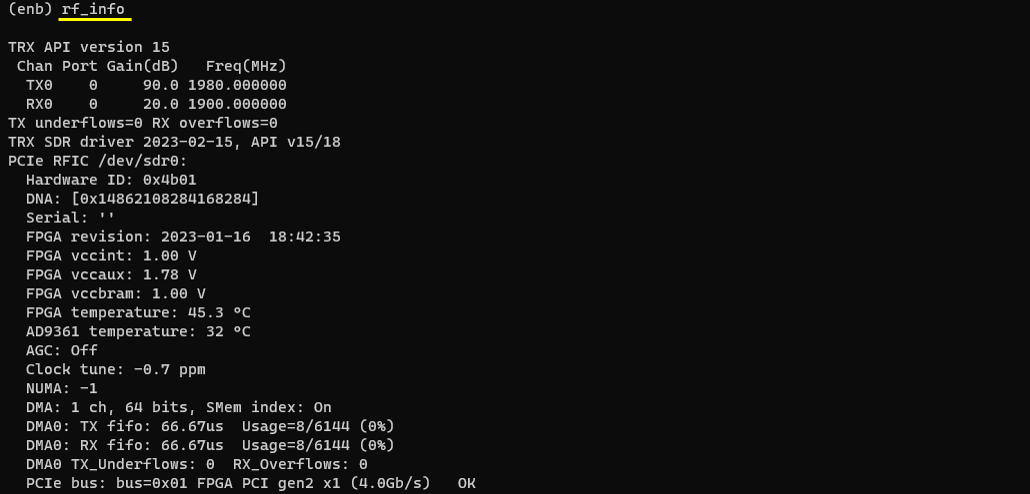
Now you can get the high level test result with t (trace) command. DL mcs and txok would be the first high level result you may want to check because these value would vary depending on configuration.

Analysis
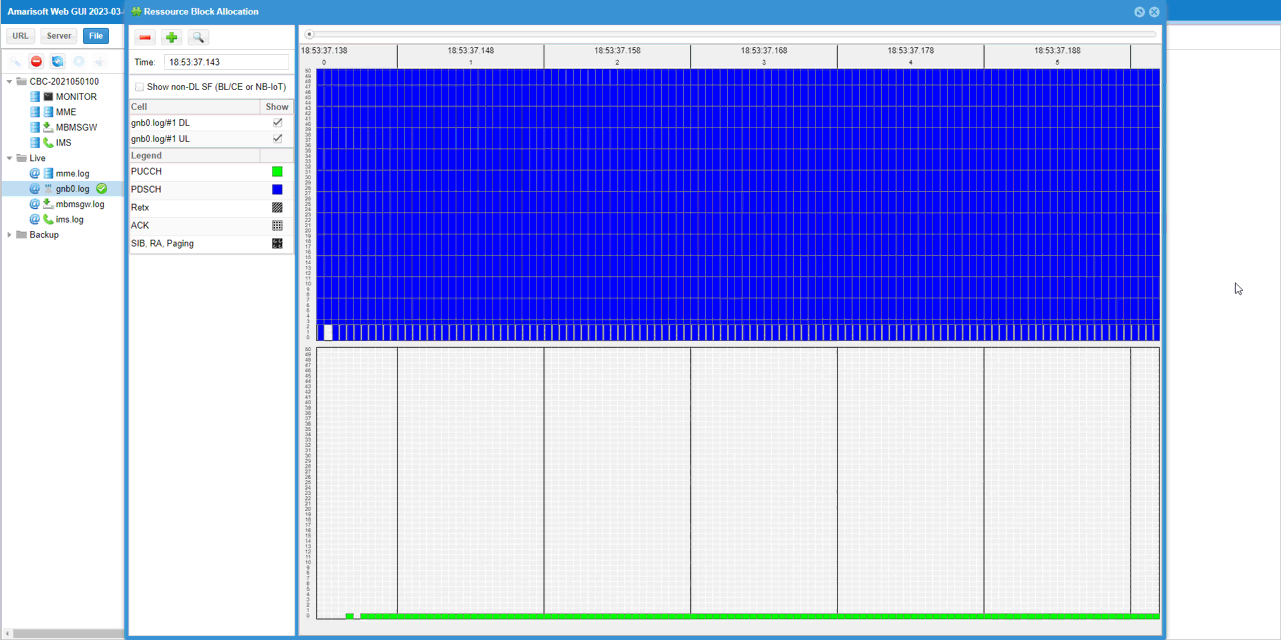
First thing you may want to check would be to check the PDSCH transmission at the PHY log level. This would be good hints on what you expect to see in "power vs time" view in the spectrum analyzer result.
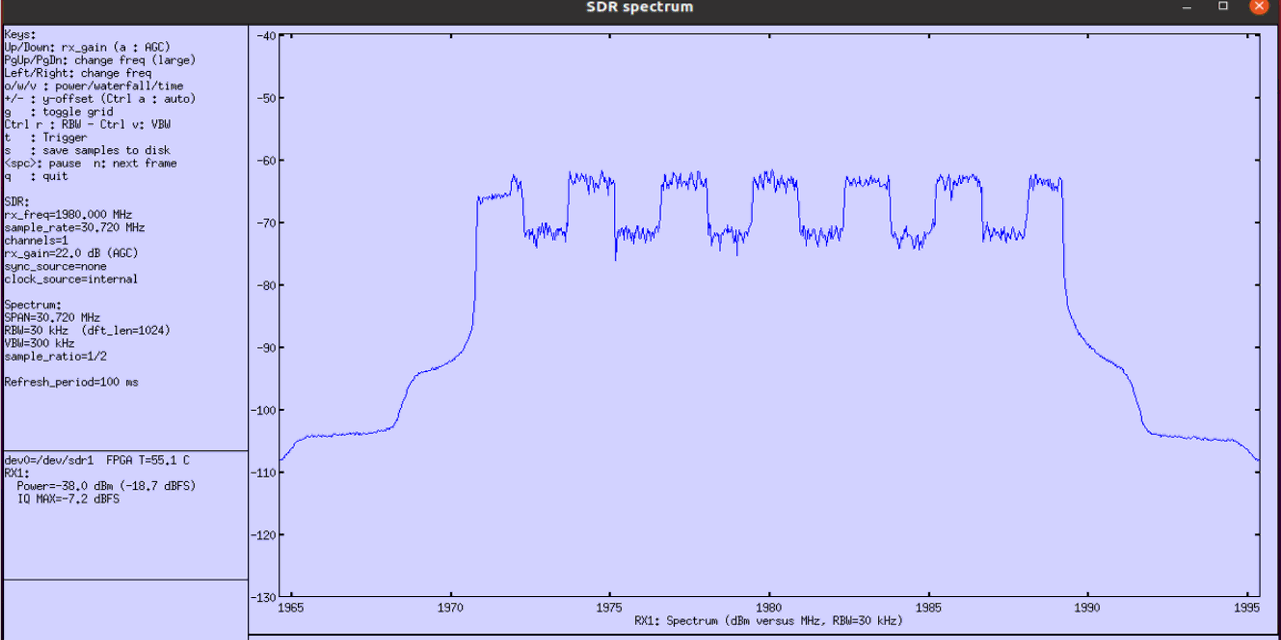
Now you can run spectrum analyzer to check on signal quality. I used Amarisoft sdr card and sdr_spectrum as the spectrum analyzer. The command line command to get this result was :
./sdr_spectrum -args "dev0=/dev/sdr1" -rx_freq 1980.00e6 -period 100
The first thing you may want to check is frequency spectrum which is the default view of sdr_spectrum. The spectrum view would vary (especialy in out of band region) depending on rx gain setting on reciever chain. The easiest way to set the optimal rx gain is to press 'a' key to let sdr_spectrum to adjust the value automatically.
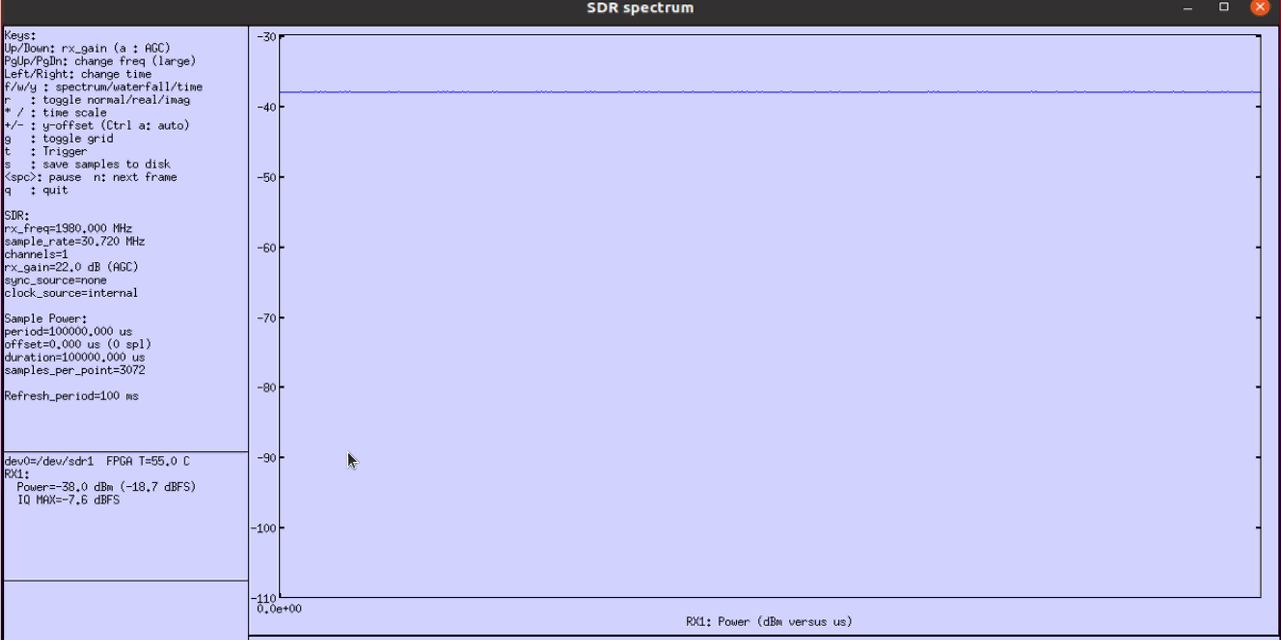
Next thing to check is time domain profile (i.e, 'power vs time' or 'Zero Span' in spectrum analyzer terminology). You don't see any dips here since there is no SSB being transmitted.
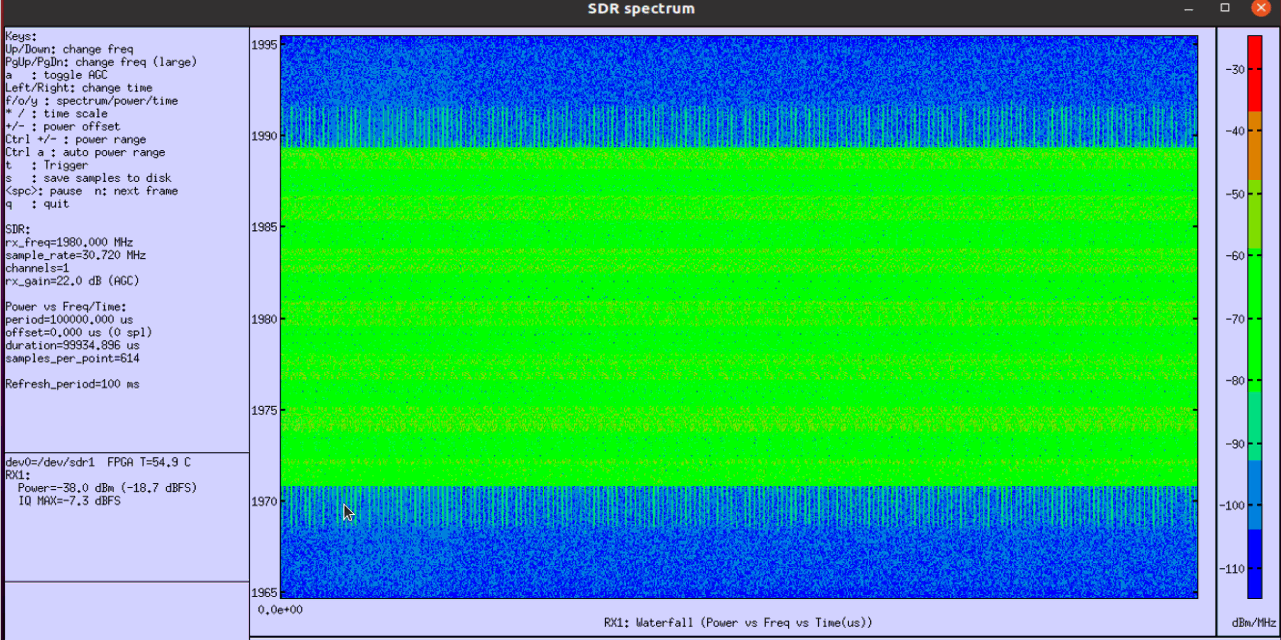
Next thing you may want to check is spectrogram of the signal. Vertical axis(y-axis) represents frequency and Horizontal axis(x-axis) indicates time(OFDM symbol index). The green area indicates the spectrum where high power is measured.
Test 14 : TDD TM UESIM SSB10000000
This test shows the test configuration and the result with Test Case UESIM with SSB ensabled (ssb_bitmap : 0000) in TDD mode.
Configuration
I have used gnb-tm-pdsch_TDD_1_TM UESIM_SSB-1000.cfg that is copined and modified from gnb-tm-pdsch.cfg .

Run
Check cell configuration and check if they are configured at high level as intended

In this tutorial, I will use spectrum analyzer to check the quality of the spectrum. To do it, you need to know of the TX frequency (physical frequency, not ARFCN). You can get the information with rf_info command.
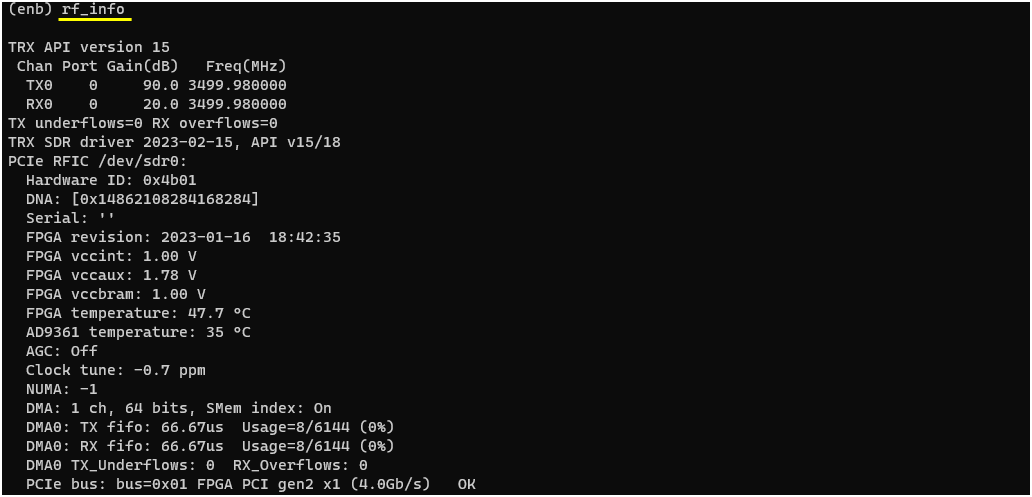
Now you can get the high level test result with t (trace) command. DL mcs and txok would be the first high level result you may want to check because these value would vary depending on configuration.

Analysis
First thing you may want to check would be to check the PDSCH transmission at the PHY log level. This would be good hints on what you expect to see in "power vs time" view in the spectrum analyzer result.
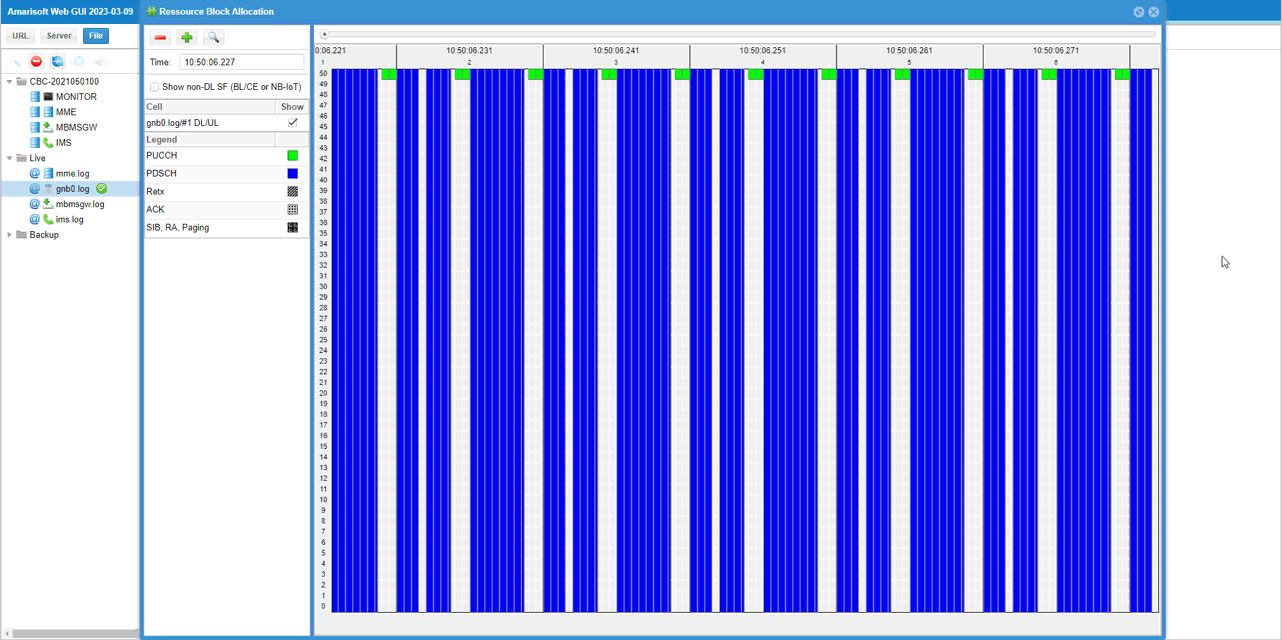
Now you can run spectrum analyzer to check on signal quality. I used Amarisoft sdr card and sdr_spectrum as the spectrum analyzer. The command line command to get this result was :
./sdr_spectrum -args "dev0=/dev/sdr1" -rx_freq 1980.00e6 -period 100
The first thing you may want to check is frequency spectrum which is the default view of sdr_spectrum. The spectrum view would vary (especialy in out of band region) depending on rx gain setting on reciever chain. The easiest way to set the optimal rx gain is to press 'a' key to let sdr_spectrum to adjust the value automatically.
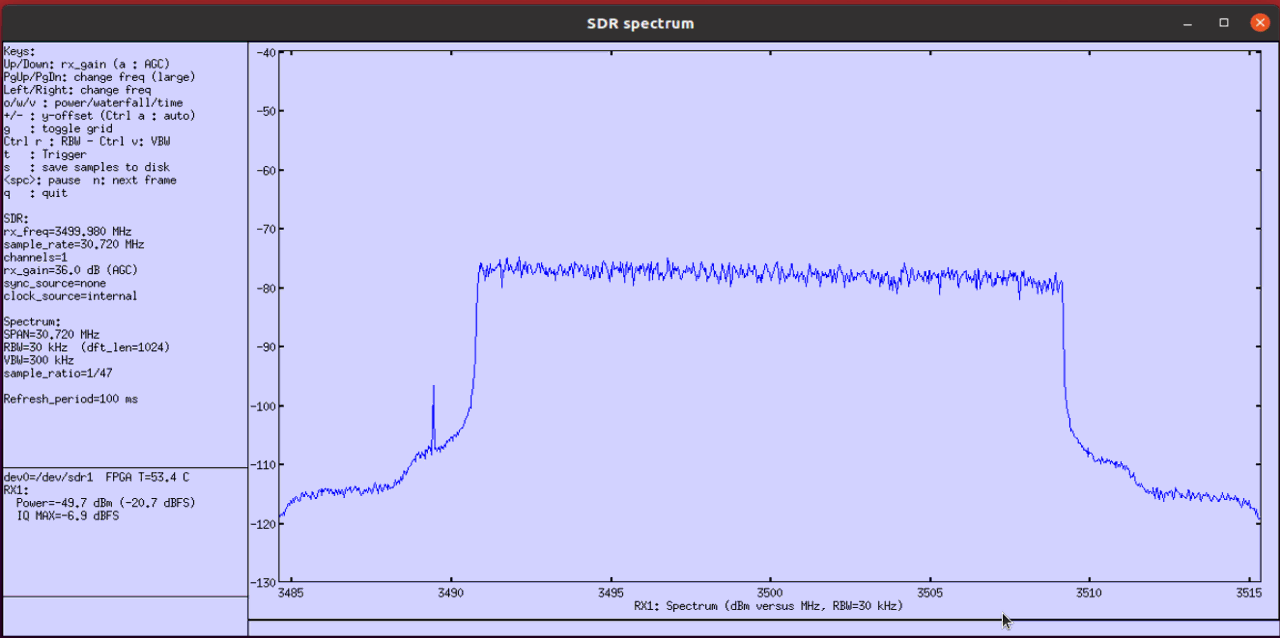
Next thing to check is time domain profile (i.e, 'power vs time' or 'Zero Span' in spectrum analyzer terminology). You see huge dips along the profile. These dips is the part where DL slot/symbols are not assigned in TDD UL/DL configuration.
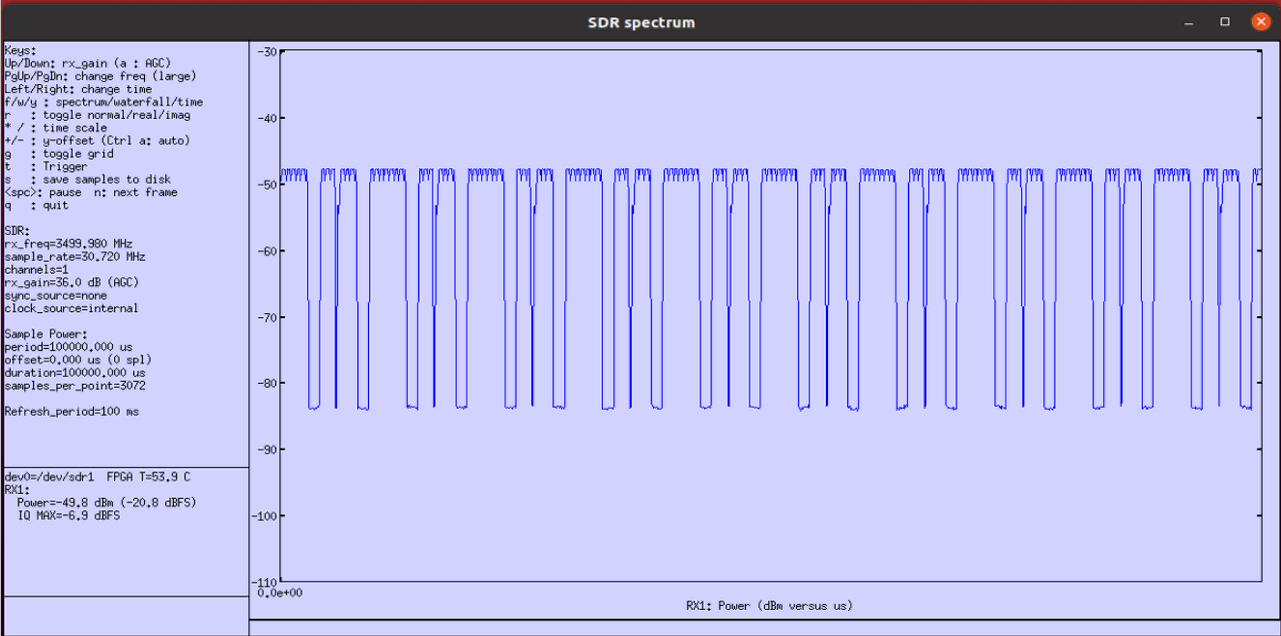
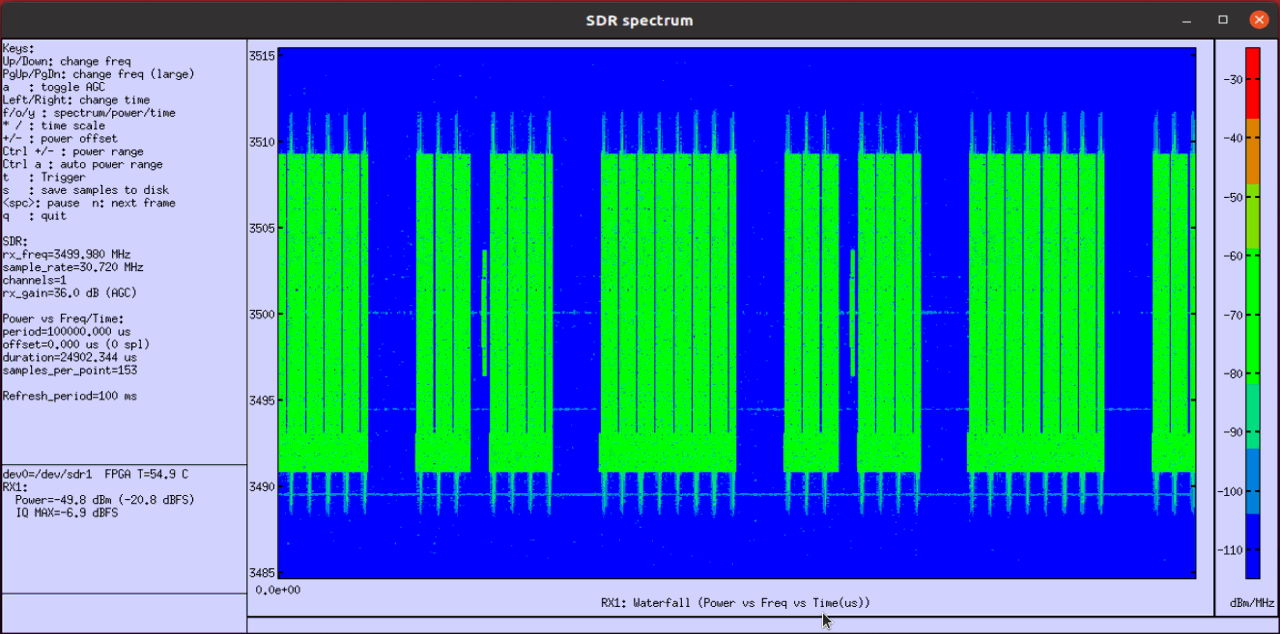
Next thing you may want to check is spectrogram of the signal. Vertical axis(y-axis) represents frequency and Horizontal axis(x-axis) indicates time(OFDM symbol index). The green area indicates the spectrum where high power is measured.
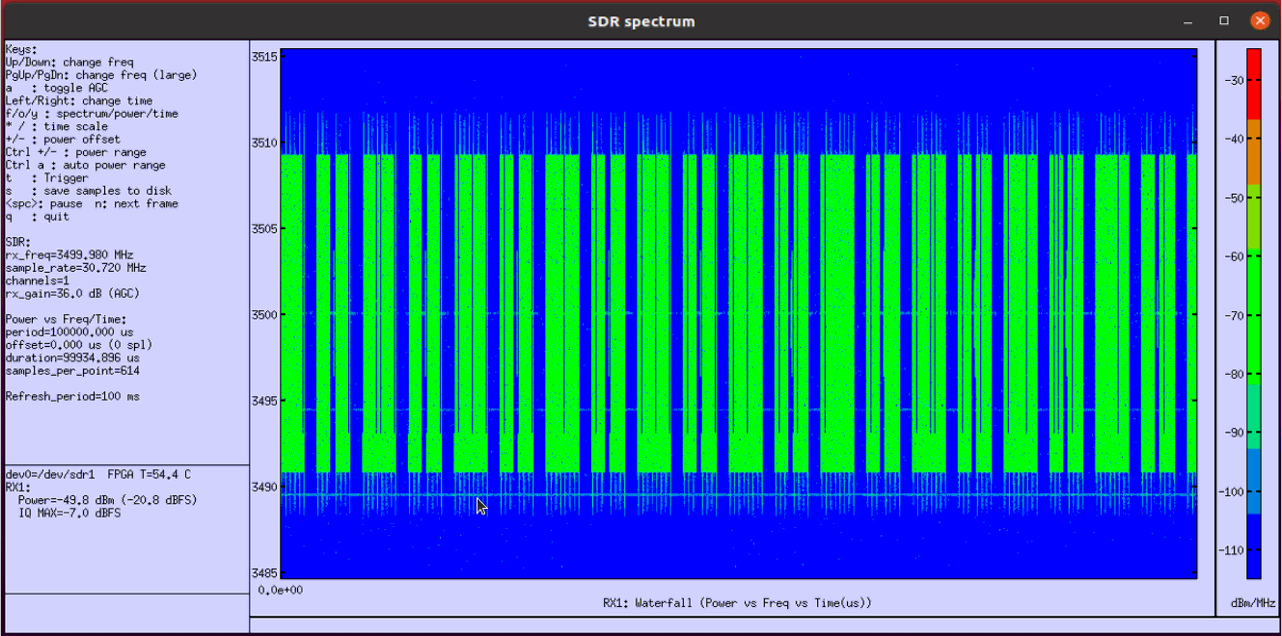
The gaps you see in the screenshot above can be due to non-allocated slots/symbols for PDSCH or SSB transmission. If you magnify the plot in horizontal direction, you can confirm where the gaps come from.
