
NR SA PUSCH Aggregation
The purpose of this tutorial is to show you how to configure and test PUSCH Aggregation Factor / Repetition. Main user case of this mechanism is to provide chance of more reliable PUSCH reception. Conceptually you may consider this to be similar to PUSCH in LTE IoT application. Overall mechanism of PUSCH Aggrection Factor can be illustrated as below.
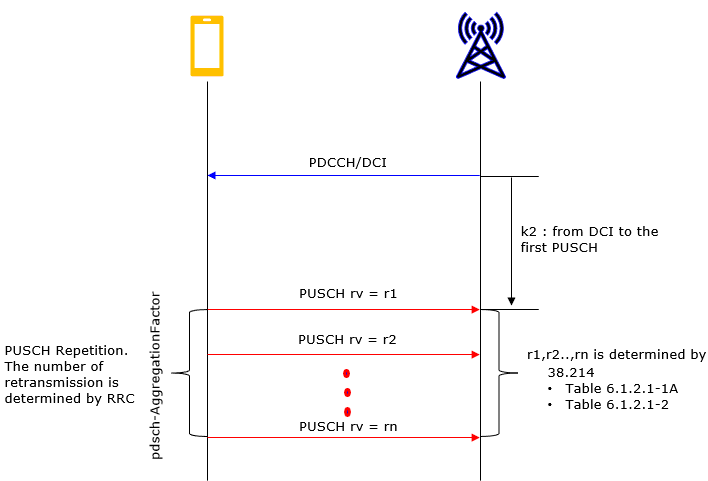
Image Source : Sharetechnote
Table of Contents
Introduction
The Physical Uplink Shared Channel (PUSCH) Aggregation Factor and Repetition mechanism is a fundamental feature in 5G New Radio (NR) designed to enhance the reliability and robustness of uplink data transmission, particularly under challenging radio conditions. In 5G NR architecture, the PUSCH serves as the primary uplink channel for user equipment (UE) to transmit user data and control information to the gNB (5G base station). Aggregation and repetition techniques, which have conceptual parallels to mechanisms used in LTE IoT deployments, involve transmitting multiple copies or aggregations of the same PUSCH transport block to increase the likelihood of successful reception at the gNB. This is especially crucial for mission-critical applications, IoT scenarios, and environments with high interference or poor signal quality. Architecturally, PUSCH Aggregation Factor and Repetition are configured through RRC signaling and managed by both the UE and network scheduler, which coordinate the number of repetitions and the aggregation scheme based on radio link conditions and QoS requirements. This mechanism plays a pivotal role in the broader NR ecosystem by facilitating improved link adaptation, supporting ultra-reliable low-latency communication (URLLC), and optimizing uplink throughput and coverage. The feature has evolved through multiple 3GPP releases, with ongoing updates enhancing its configuration flexibility and operational efficiency, underscoring its significance in both commercial and specialized 5G deployments.
-
Context of PUSCH Aggregation Factor and Repetition:
- Technical Background: Introduced as part of 5G NR standards, the PUSCH Aggregation Factor enables the UE to transmit repeated or aggregated uplink data blocks, thereby improving reliability in uplink transmissions.
- Architectural Placement: The mechanism operates at the physical layer, coordinated via higher-layer signaling and integrated within the NR MAC and scheduler functions.
- Key Concepts: Aggregation, repetition, uplink scheduling, link adaptation, and QoS-driven resource allocation.
-
Relevance and Importance of This Tutorial:
- Understanding and configuring PUSCH Aggregation Factor and Repetition is critical for optimizing uplink performance and ensuring robust data transmission in diverse deployment scenarios.
- The feature is particularly relevant for applications requiring high reliability, such as industrial automation, public safety, and massive IoT.
- Mastery of this mechanism allows engineers and network operators to maximize coverage, enhance resilience to interference, and support advanced 5G use cases.
-
Tutorial Learning Outcomes:
- Gain detailed insight into the configuration and operation of PUSCH Aggregation Factor and Repetition in 5G NR.
- Learn how to test, verify, and troubleshoot the feature across different network releases and configurations.
- Understand best practices for deploying and tuning the mechanism to meet specific performance and reliability objectives.
-
Prerequisite Knowledge and Skills:
- Familiarity with 5G NR architecture, protocol stack, and radio interface concepts.
- Experience with network configuration, RRC parameterization, and test/measurement tools for 5G environments.
- Basic understanding of uplink scheduling, HARQ, and link adaptation mechanisms in cellular systems.
Summary of the Tutorial
This tutorial covers the procedure to test the PUSCH Aggregation Factor operation in NR SA TDD mode, including setup, configuration, test execution, and log analysis.
-
Test Setup
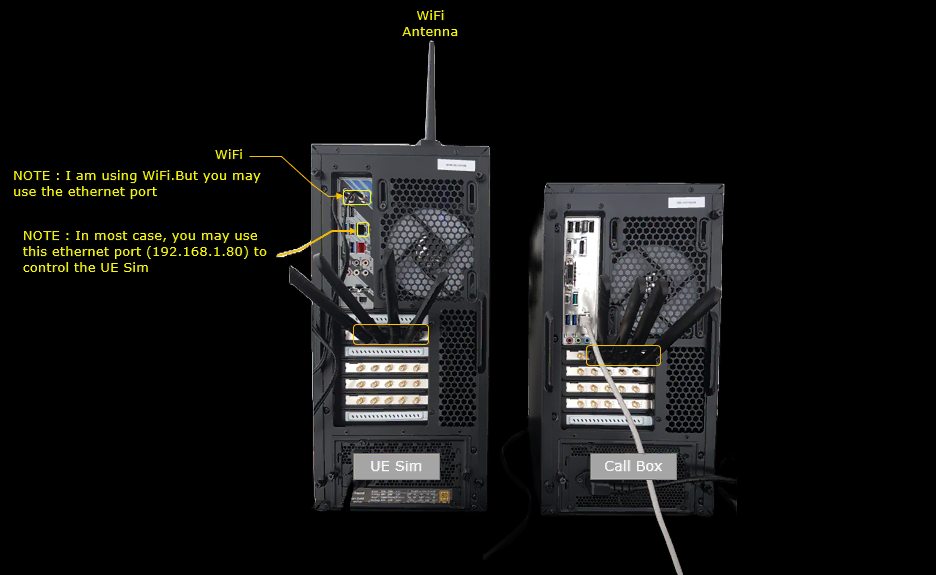
- The test utilizes a callbox and UE simulator as depicted in the provided setup diagram.
-
Key Configuration Parameters
-
pusch
- aggregation_factor
-
pusch
-
Test 1: PUSCH Aggregation -TDD
- This test verifies the operation of the PUSCH Aggregation Factor in NR SA TDD configuration.
-
Configuration Steps:
- Copy and modify the gnb-sa.cfg to gnb-sa-pusch-agg.cfg for the gNB, and use ims.default.cfg and mme-ims.cfg for IMS and MME settings respectively (default on Callbox).
- Add phy.rep=1 (optional, for detailed logging of repeated transmissions).
- Set duplex mode (NR_TDD) to 1 (TDD).
- Configure NR_TDD_CONFIG to 5 to use a custom uplink-dominant TDD pattern, giving more UL slots for PUSCH repetition.
- Use band n78 and subcarrier spacing 30 kHz (flexible as per 3GPP specification).
- Enable force_full_bsr and set pusch_mcs to maintain stable UL slots and observe PUSCH repetition regardless of higher layer data.
- In the pdsch configuration, set the aggregation_factor parameter to enable PDSCH aggregation.
- Configure a TDD pattern with a 5 ms cycle (10 slots @ 30kHz). Assign 3 slots and 10 OFDM symbols for downlink, 6 slots and 2 OFDM symbols for uplink.
- On the UE side, use ue-nr-sa.cfg as is, ensuring TDD mode, band, subcarrier spacing, channel and SSB frequencies match the callbox configuration.
- Set UE access release to 15 and UE category to "nr".
-
Test Execution Steps:
- Start LTE service (gNB) and execute 'cell phy' and 'cell' commands to apply configuration.
- Power on the UE using the power_on command on the UE simulator.
- Ensure the UE completes attach procedure and monitor throughput using the 't' command.
-
Log Analysis:
- Before logging, enable the 'Repetition' option in the eNB log property window for enhanced verification.
- After initial attach, inspect the UE capability information to confirm support for PUSCH aggregation (pusch-RepetitionMultiSlots).
- Verify that the gNB enables PUSCH Aggregation by configuring the corresponding parameter when the UE supports it.
- In the PHY logs, identify PDCCH/DCI 1_1 scheduling of PUSCH and observe consecutive PUSCH transmissions with n_rep and varying repetition and redundancy version indices, confirming aggregation behavior.
- Use the WebGUI to visually confirm consecutive aggregated PUSCH transmissions, with initial and repeated transmissions distinguished by color coding.
Note: For custom TDD pattern definition, refer to the referenced tutorial link if unfamiliar with the process.
This test demonstrates how to configure and verify PUSCH Aggregation in NR SA TDD, guiding through parameter selection, setup, execution, and result validation using both logs and graphical tools.
Test Setup
Test setup for this tutorial is as shown below.
Key Configuration Parameters
Followings are important configuration parameters for this tutorial. You may click on the items for the descriptions from Amarisoft documents.
- pusch
- tdd_ul_dl_config : used in this tutorial to define a uplink dominant TDD pattern that gives enough UL slots for the repetition
- force_full_bsr : enabled only for this test to keep the UL slots occupied without traffic from the higher layer
- pusch_mcs : fixed only for this test so that the repeated PUSCH is transmitted with a stable MCS
Test 1 : PUSCH Aggregation -TDD
This test is to test PUSCH Aggregation Factor operation in NR SA TDD
Configuration
I used the gnb-sa-pusch-agg.cfg on gNB which is copied and modified from gnb-sa.cfg
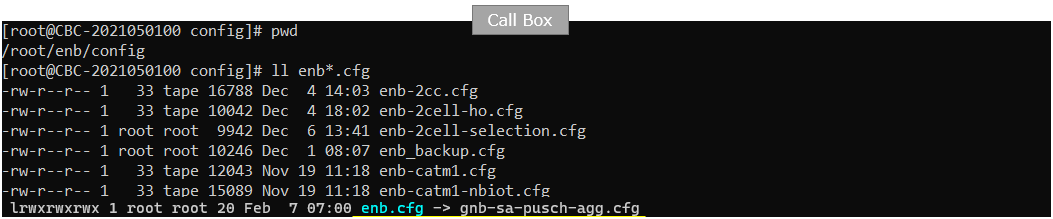
On the Callbox, enb.cfg is a symbolic link and it points to gnb-sa-pusch-agg.cfg here.
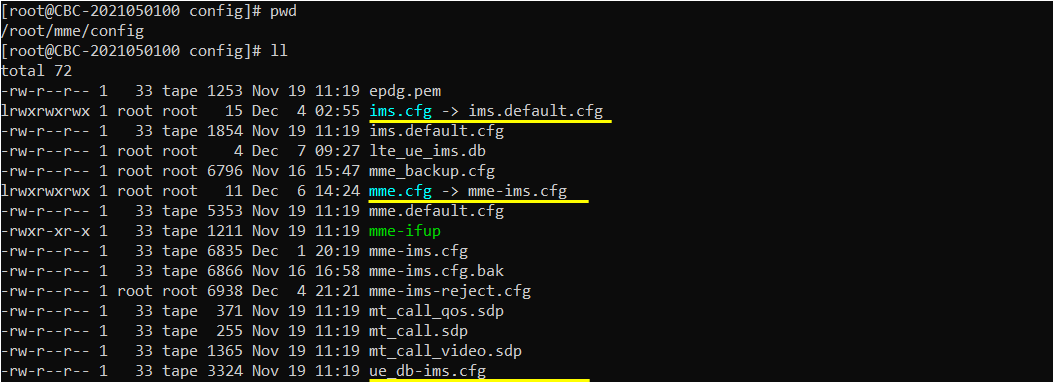
I used ims.default.cfg as ims configuration and mme-ims.cfg as mme configuration. These two are default configuration on Callbox.
Both of these are also selected through symbolic links in /root/mme/config, where ims.cfg points to ims.default.cfg and mme.cfg points to mme-ims.cfg. Since nothing on the corenetwork side has to change for PUSCH aggregation, you can leave both links at their default targets.
In gnb-sa-pusch-agg.cfg , the configuration is done as follows.
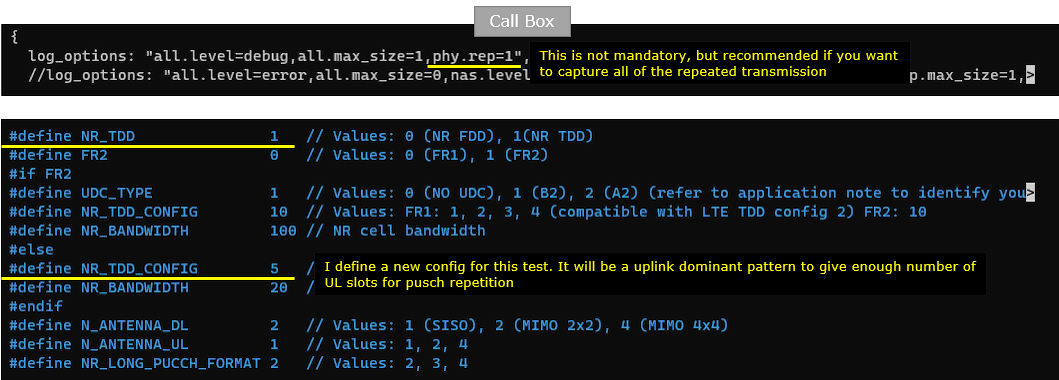
I added a log option phy.rep=1 for clear verification in the log. This is not mandatory, but recommended if you want to capture all of the repeated transmission.
In this test, I used TDD. You can select any specific tdd pattern with the parameter NR_TDD_CONFIG. To apply TDD configuration, you first need to configure the duplex mode (NR_TDD) to 1 (TDD). And then I set NR_TDD_CONFIG to 5 which is not the default configuration and is configured by me for this test. I defined a new TDD pattern to create a uplink dominant pattern to give enough number of UL slots for pusch repetition.
The full log_options line is "all.level=debug,all.max_size=1,phy.rep=1". Without phy.rep=1 the PHY log prints only the first transmission of an aggregated PUSCH, so the repetitions that this whole test is about would not appear.
NR_TDD is set to 1 and FR2 is set to 0, so the FR1 branch is taken and NR_TDD_CONFIG 5 with NR_BANDWIDTH 20 are the values that apply. The FR2 branch above, which uses NR_TDD_CONFIG 10 and NR_BANDWIDTH 100, is not used here.
N_ANTENNA_DL is 2 and N_ANTENNA_UL is 1, so the downlink is MIMO 2x2 while the uplink is single antenna. This matters for reading the result later, because the repetition being observed is an uplink mechanism and the uplink has a single layer.
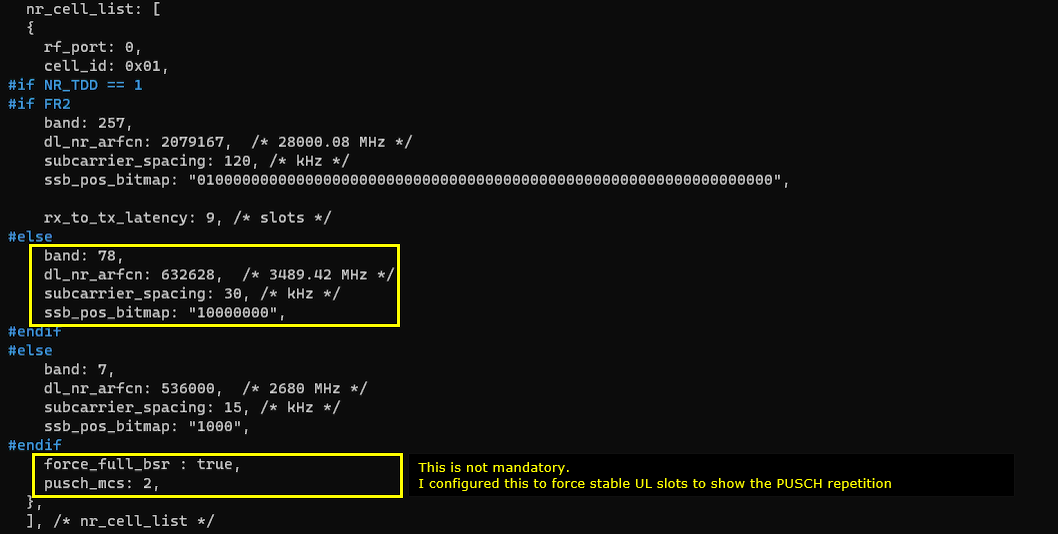
In this test, band n78, subcarrier spacing(subcarrier_spacing) 30 is used, but this is not the mandatory condition. You can specify any band and subcarrier spacing that 3GPP allows. In addition, just for this test I enabled force_full_bsr and set pusch_mcs so as to force stable UL slots to show the PUSCH repetition without the data from higher layer.
The cell is defined in nr_cell_list with rf_port 0 and cell_id 0x01. Since NR_TDD is 1 and FR2 is 0, the band 78 branch applies, with dl_nr_arfcn 632628 corresponding to 3489.42 MHz, subcarrier_spacing 30 kHz and ssb_pos_bitmap "10000000". The band 257 branch above and the band 7 branch below are the FR2 and FDD alternatives and neither is used here.
force_full_bsr is set to true and pusch_mcs is set to 2. Neither is mandatory. I configured them to force stable UL slots so that the PUSCH repetition can be seen without any data coming from the higher layer. force_full_bsr makes the UE always report a full buffer status so the scheduler keeps granting uplink, and the fixed pusch_mcs keeps the transport block size constant across the repetitions, which makes the PHY log easy to compare from one repetition to the next.
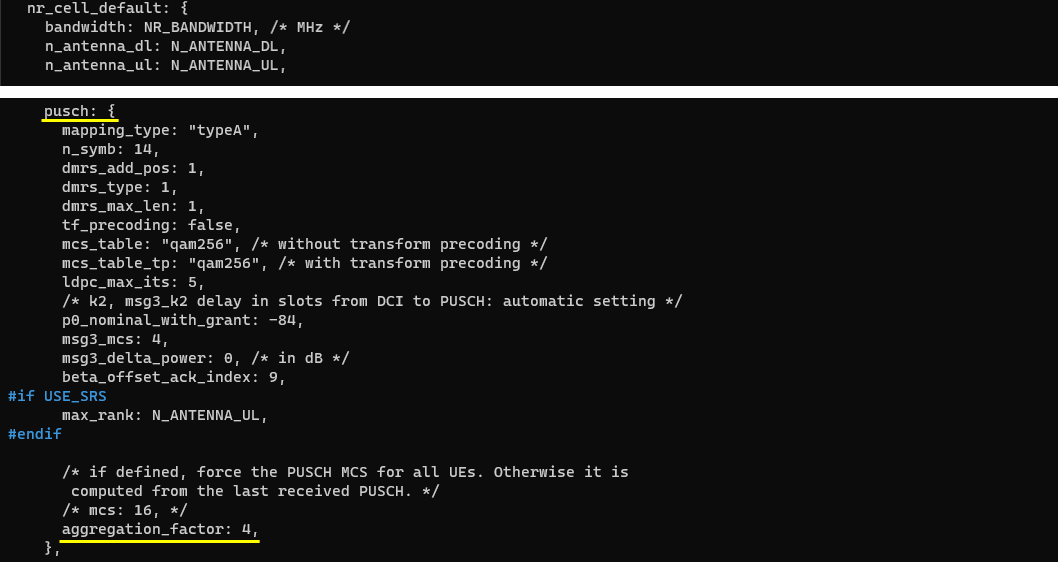
Enabling PDSCH aggregation is simple. Just add a parameter aggregation_factor in pdsch configuration.
The parameter is placed inside the pusch block of nr_cell_default and it is set to aggregation_factor: 4, which means each transport block is transmitted four times. This is the single parameter that turns the feature on, and the value 4 is what you will see reflected later as pusch-AggregationFactor n4 in the RRC message and as n_rep=4 in the PHY log.
The rest of the pusch block is left at its normal values, with mapping_type "typeA", n_symb 14, dmrs_add_pos 1, dmrs_type 1, dmrs_max_len 1, tf_precoding false, mcs_table and mcs_table_tp both "qam256", ldpc_max_its 5, p0_nominal_with_grant -84, msg3_mcs 4, msg3_delta_power 0 and beta_offset_ack_index 9. The comment above the parameter notes that k2 and msg3_k2 are set automatically, which is worth remembering because k2 shows up in the log analysis later.
This is the TDD pattern that I configured for this test. In this configuration, the cycle length is 5ms which is 10 slots in case of Subcarrier spacing 30Khz. Out of the 10 slots, 3 slots and 10 OFDM symbols are allocated for downlink by the parameter dl_slots and dl_symbols respectively. 6 slots and 2 OFDM symbols are allocated for uplink by the parameter ul_slots and ul_symbols respectively.
The pattern is added as a new #elif NR_TDD_CONFIG == 5 branch within tdd_ul_dl_config, so the existing patterns are left untouched and this one is selected only by the NR_TDD_CONFIG 5 set earlier.
It is not mandatory for the pattern to be uplink dominant, but it is more meaningful to configure the number of UL slots to be the same as or greater than the pusch aggregation_factor. With 6 UL slots against an aggregation_factor of 4, all four transmissions of a transport block can be placed within a single 5 ms cycle instead of being split across two cycles, which is what makes the repetition easy to recognise in the log.

I used the ue-nr-sa.cfg as it is.
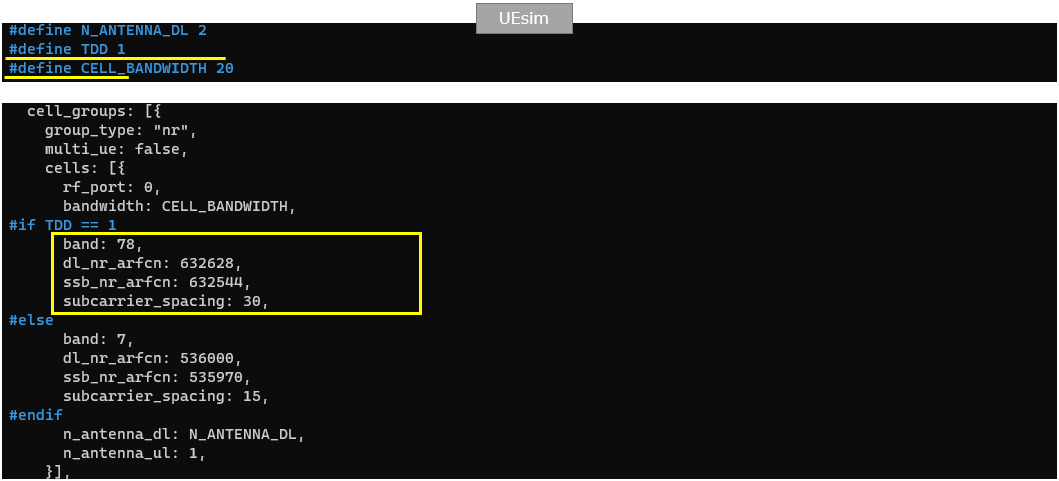
Configure UE as TDD which matches to callbox configuration. Set the band, subcarrier spacing(subcarrier_spacing), channel frequency(dl_nr_arfcn) and SSB frequency(ssb_nr_arfcn) to match with Callbox configuration.
TDD is set to 1 at the top of the file and CELL_BANDWIDTH is set to 20, which matches the NR_BANDWIDTH 20 on the Callbox. N_ANTENNA_DL is 2, the same as the Callbox.
Within cell_groups the group_type is "nr" and the cell uses rf_port 0. Because TDD is 1, the band 78 branch applies with dl_nr_arfcn 632628, ssb_nr_arfcn 632544 and subcarrier_spacing 30. The dl_nr_arfcn and subcarrier_spacing are the same values configured on the Callbox, and ssb_nr_arfcn has to be given here as well because the UE needs to know where to look for the SSB. The band 7 branch below is the FDD alternative and it is not used.
n_antenna_ul is 1, which matches N_ANTENNA_UL 1 on the Callbox. The uplink of this test is therefore single layer, and the repetition observed later is a repetition in time rather than anything spatial.
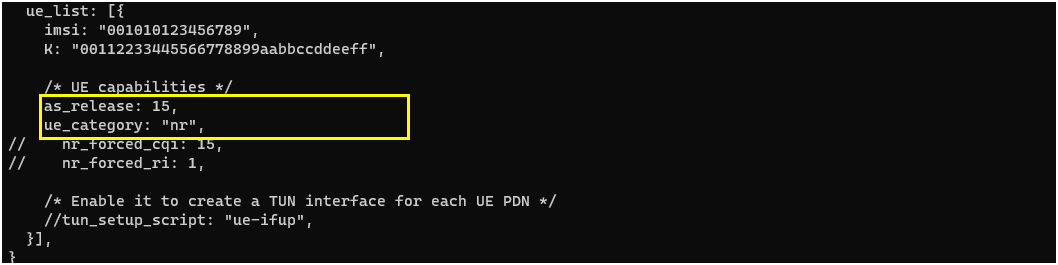
Set UE access release (as_release) to 15 and ue_category to "nr".
as_release 15 is what makes the UE report Release 15 capabilities, and pusch-RepetitionMultiSlots is a Release 15 capability. If you leave the UE at an earlier release, it will not declare support for the repetition and the gNB will never send the aggregation factor, so this is worth checking first if the feature appears to do nothing.
The rest of the ue_list entry is the default identity, with imsi "001010123456789" and the key K. nr_forced_cqi and nr_forced_ri are both commented out, so the UE reports measured values rather than fixed ones, and the tun_setup_script line that would create a TUN interface for each UE PDN is also commented out.
Perform the Test
Start LTE service (gNB) and run 'cell phy' and 'cell' command, then everything is configured as you intended.
The cell phy output lists Cell 0x001 as RAT NR on BAND n78 with BW 20 and P 0. The DL and UL both use ARFCN 632628 with SCS 30 and QAM 256, and the SSB columns show ARFCN 632544 with SCS 30. These are the values set in nr_cell_list, so this confirms the band and frequency arrived as intended.
The ANT and NL columns show 1 and 1 on both directions in this capture. The cell output below adds TAC 0x000064, dl_arfcn 632628, pci 500, prach_seq 1, dl_gain 0.0 and plmn 00101.

Power on UE on UE sim using power_on command.
Before power_on, it is worth setting the log path with log file.rotate=250M,file.path=/var/log/lte/ so that the UEsim side log is captured to a known location while the test runs.

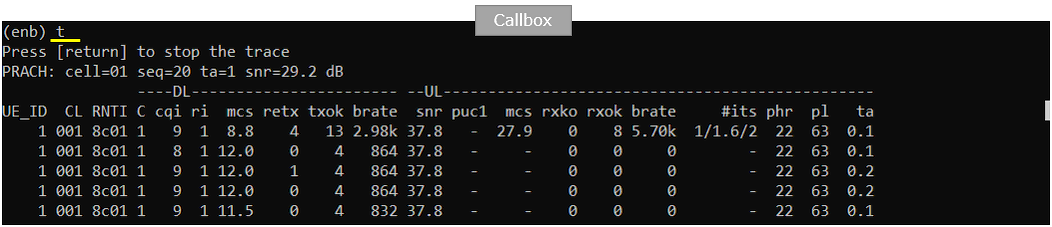
Confirm that the UE completes the attach and check the throughput with 't' command.
The PRACH line shows cell=01 with seq=20, ta=1 and snr=29.2 dB, which confirms the UE reached the cell. In the table the UE is on CL 001 with RNTI 8c01.
The UL columns are the ones to look at for this test. The first row shows snr 37.8, mcs 27.9, rxok 8 and a UL brate of 5.70k, and the following rows keep reporting snr 37.8 while rxok stays at 0. That is the expected shape here, because force_full_bsr keeps the grants coming but there is no real uplink payload, so the throughput figure itself is not the point. What matters is that the uplink is running steadily enough for the repetitions to be examined in the PHY log.
Log Analysis
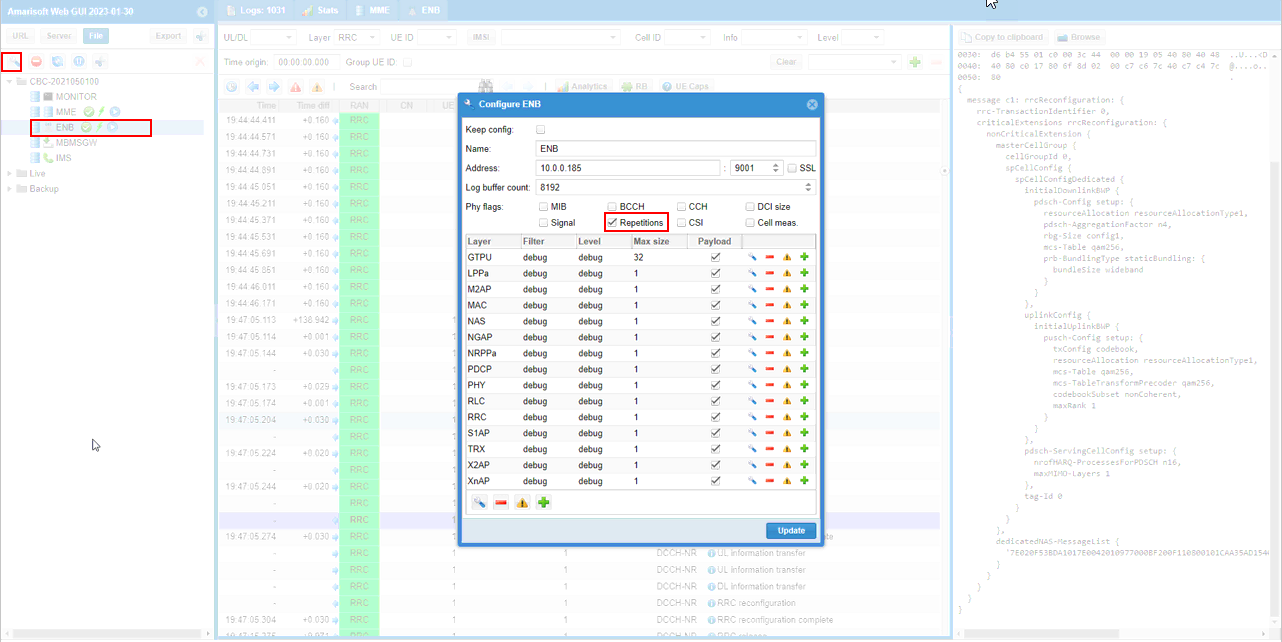
Before you start logging (i.e, before you turn on UE) I would suggest to check 'Repetition' in eNB log property window for more detailed verification.
The Repetitions checkbox sits among the Phy flags of the Configure ENB dialog, next to MIB, BCCH, CCH, DCI size, Signal, CSI and Cell meas. It has to be ticked before the UE attaches, because the flag only affects what is written from that point on and cannot recover the repetitions of a call that has already been logged.
This is the WebGUI equivalent of the phy.rep=1 log option set in the configuration file. Setting either one is enough, and ticking it here is the convenient way when the service is already running.
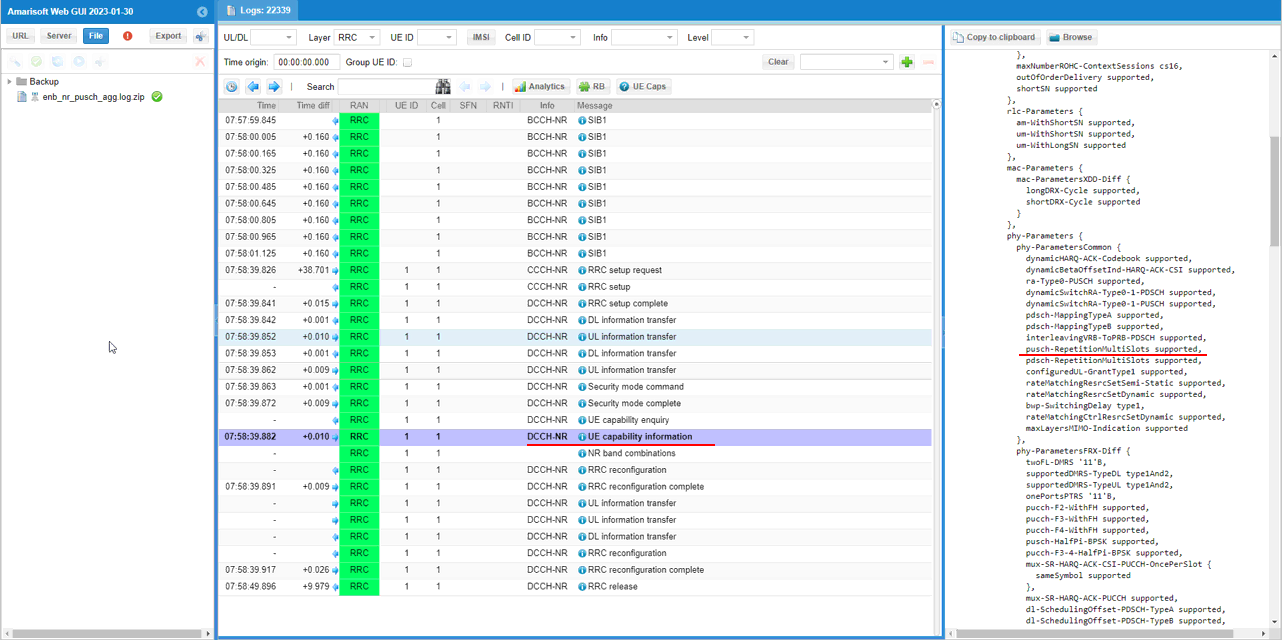
Once the initial attach is done, check UE capability information message and see if UE support PUSCH aggregation (pusch-RepetitionMultiSlots).
The capability is found under phy-Parameters, in the phy-ParametersCommon block, where the entry reads pusch-RepetitionMultiSlots supported. The line immediately below it is pdsch-RepetitionMultiSlots supported, which is the downlink counterpart used by the PDSCH aggregation tutorial, so take care to read the right one of the two.
The UE capability information message appears on DCCH-NR shortly after the security mode complete and the UE capability enquiry. If the UE does not declare this capability, the gNB will not configure the aggregation factor no matter what is set in the configuration file, so this message is the first thing to check when the feature does not appear to take effect.
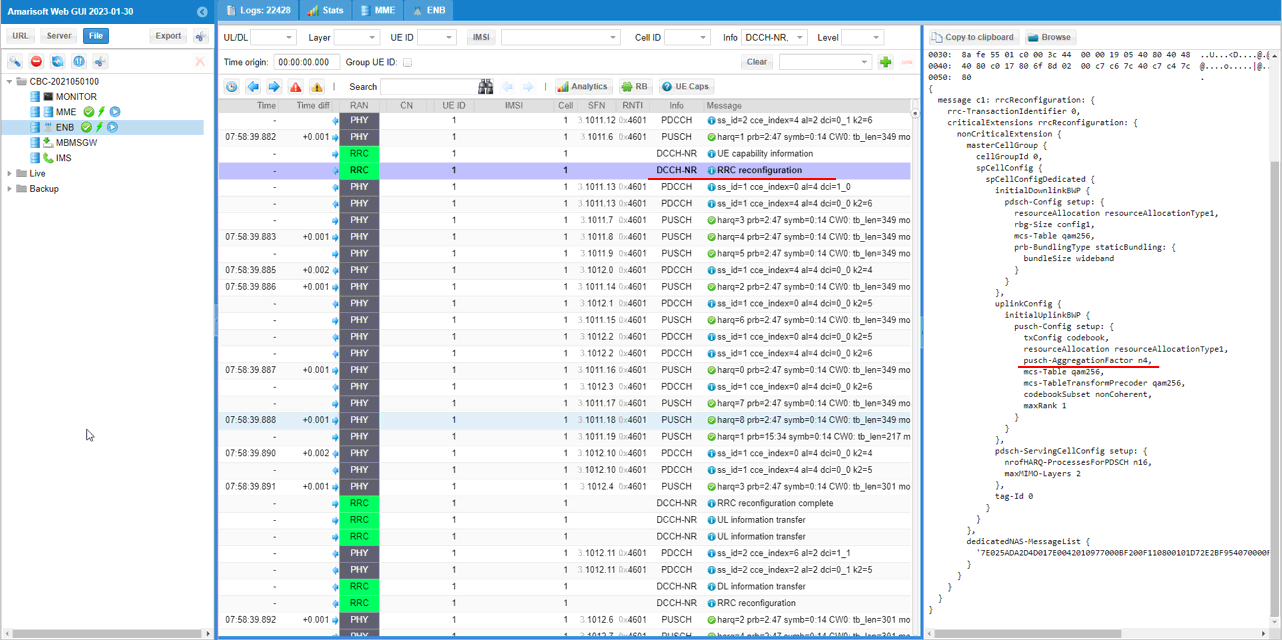
If UE notifies that pdsch-RepetitionMultiSlots is supported, gNB enables the PUSCH Aggregation by setting pdsch-AggregationFactor in pusch-Config IE (Information Element)
In the RRC reconfiguration the value appears as pusch-AggregationFactor n4, inside pusch-Config within the initialUplinkBWP of uplinkConfig. The n4 corresponds directly to the aggregation_factor: 4 set in the configuration file, so comparing these two is the way to confirm that the configured value reached the UE.
The surrounding pusch-Config entries are txConfig codebook, resourceAllocation resourceAllocationType1, mcs-Table qam256, mcs-TableTransformPrecoder qam256, codebookSubset nonCoherent and maxRank 1. The maxRank 1 is consistent with the single uplink antenna configured on both sides.
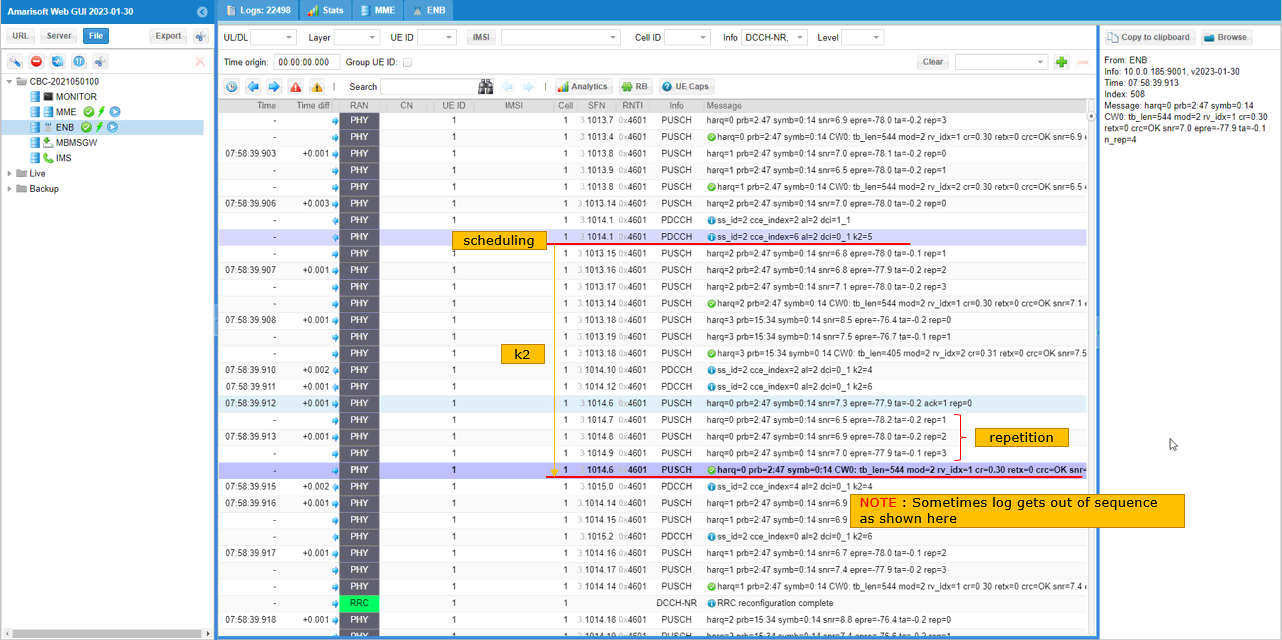
Once PUSCH aggregation is enabled, you can check in PHY log to confirm that it is really working as expected.
First find any PDCCH/DCI 1_1 that schedule a PUSCH and then check a few consecutive PUSCH. You see the first PUSCH log after the PDCCH is printed with n_rep and the following three PUSCH are transmitted with different rep values and rv_idx values without any separate PDCCH/DCI 0_1. The k2 value in this case is calculated from the first transmission of PUSCH.
The scheduling PDCCH is the row reading ss_id=2 cce_index=6 al=2 dci=0_1 k2=5. The k2=5 carried in that DCI is the gap in slots to the first PUSCH, and the four PUSCH that follow are marked rep=0, rep=1, rep=2 and rep=3. There is no further PDCCH between them, which is the whole point of the aggregation, since one grant covers all four transmissions.
Opening the first of those PUSCH shows harq=0 prb=2:47 symb=0:14 CW0: tb_len=544 mod=2 rv_idx=1 cr=0.30 retx=0 crc=OK and n_rep=4. The n_rep=4 is the configured aggregation factor appearing at the PHY level, and the rv_idx changes from one repetition to the next while harq, prb, symb and tb_len stay the same, which is what shows these are repetitions of one transport block rather than four separate ones.
Be aware that the log sometimes gets out of sequence, so the rep values may not always be printed in ascending order. When that happens, read the rep and rv_idx fields of each line rather than relying on the order of the rows.
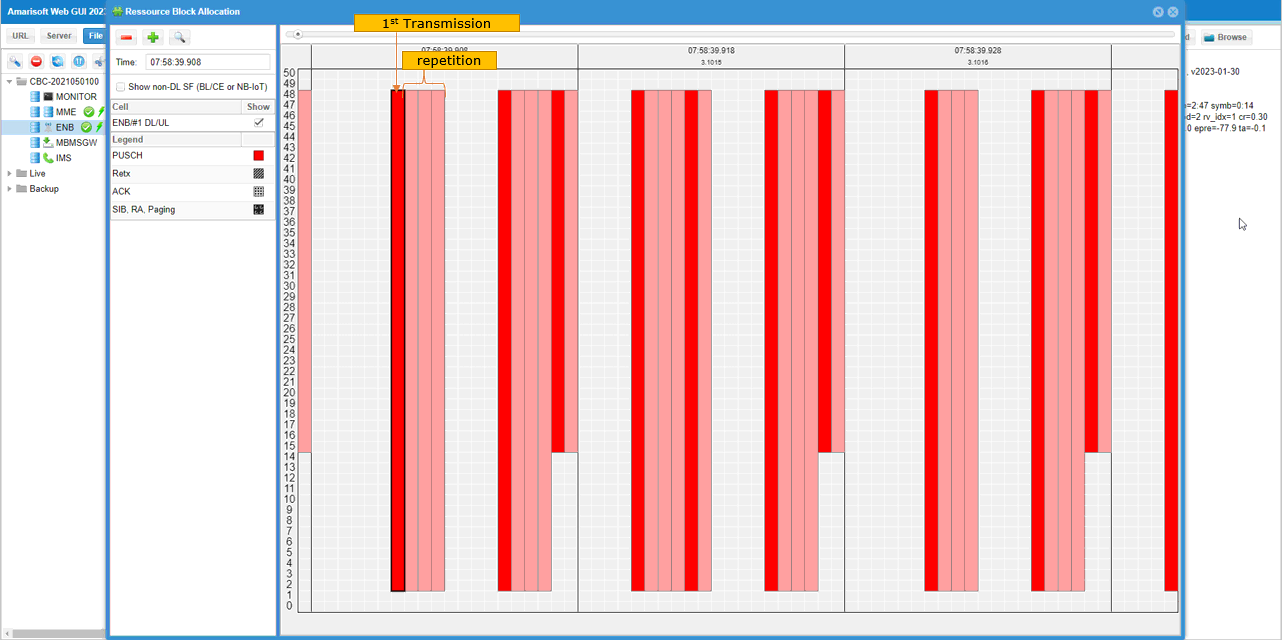
You can confirm the transmission of the aggregated PUSCH in visual way on the WebGUI. As shown here, you see the 4 consecutive PUSCH. First transmission is marked in dark color and the following repetition is marked in ligher colors.
Each group in the Resource Block Allocation view is one dark red bar followed by three lighter bars, and the groups repeat across the capture. The dark bar is the first transmission and the three lighter ones are the repetitions, so a single glance tells you the aggregation factor is 4.
All four bars of a group occupy the same resource blocks, which matches the identical prb=2:47 seen in the PHY log. The groups also sit within one uplink burst rather than being split apart, which is the effect of giving the pattern 6 UL slots against an aggregation_factor of 4.
RRC / NAS Signaling
RrcReconfiguration (SA)
: This is the RrcReconfiguration sent by gNB to configure PUSCH Aggregation Factor. (
{
message c1: rrcReconfiguration: {
rrc-TransactionIdentifier 0,
criticalExtensions rrcReconfiguration: {
nonCriticalExtension {
masterCellGroup {
cellGroupId 0,
spCellConfig {
spCellConfigDedicated {
initialDownlinkBWP {
pdsch-Config setup: {
resourceAllocation resourceAllocationType1,
rbg-Size config1,
mcs-Table qam256,
prb-BundlingType staticBundling: {
bundleSize wideband
}
}
},
uplinkConfig {
initialUplinkBWP {
pusch-Config setup: {
txConfig codebook,
resourceAllocation resourceAllocationType1,
pusch-AggregationFactor n4,
mcs-Table qam256,
mcs-TableTransformPrecoder qam256,
codebookSubset nonCoherent,
maxRank 1
}
}
},
pdsch-ServingCellConfig setup: {
nrofHARQ-ProcessesForPDSCH n16,
maxMIMO-Layers 2
},
tag-Id 0
}
}
},
dedicatedNAS-MessageList {
'7E025ADA2D4D017E0042010977000BF200F110800101D72E2BF954070000F11000006415020101210203005E01BE3408031F19F1031F11F2'H
}
}
}
}
}