Log options in Configuration File
This page is not about testing anything. This is more of information purpose. It is about how to find or set various configuration in configuration file. I personally recommend to use WebGUI whenever allowed, but there would be some cases where you may need or want to collect or configure logging within configuration files. In the configuration file (e.g, enb configuration, mme configuration files), you can configure followings about the logging
- location of log files (i.e the directory where the log file is being collected).
- name of the log files
- what kind of information to be logged (e.g, specific layers to be logged)
Table of Contents
Introduction
Configuration management is a fundamental aspect of modern software systems and network infrastructures, enabling administrators and engineers to define, modify, and control the behavior of applications and services through structured files. In the context of telecommunications and network elements—such as eNodeB (evolved Node B) or MME (Mobility Management Entity)—configuration files play a critical role in orchestrating various operational parameters, including logging. Logging configuration within these files determines the logging location (the directory for log files), the naming conventions for log files, and the granularity and type of information captured (such as specific protocol layers or event categories). While Amarisoft provide a WebGUI (Graphical User Interface) for intuitive configuration management, there are scenarios where direct file-based configuration is necessary or preferred—such as automation, bulk updates, troubleshooting, or in environments where GUI access is limited. Understanding how to locate, interpret, and modify logging settings in configuration files is essential for ensuring effective monitoring, diagnostics, and compliance with operational requirements. This tutorial provides a comprehensive guide to working with logging configurations in typical network element configuration files, offering technical insight into configuration file structures, key parameters, and best practices for both viewing and setting logging options.
-
Context and Scope
- Technology Focus: Configuration file management for network elements, with an emphasis on logging parameters.
- Common File Types: enb configuration files, mme configuration files, and other telecom/network infrastructure configuration files.
- Why Not Just Use WebGUI? While WebGUI is recommended for ease of use and error prevention, certain scenarios—such as automation, restricted environments, or advanced troubleshooting—necessitate direct file manipulation.
-
Relevance and Importance
- Enables precise control over logging output, supporting monitoring, diagnostics, and compliance.
- Facilitates automation and bulk configuration changes that may not be practical or possible through a GUI.
- Essential knowledge for engineers, administrators, and support personnel managing critical network infrastructure.
-
Learning Outcomes
- Understanding the structure and syntax of typical configuration files used in telecom and networking.
- Ability to identify and modify logging configuration parameters, including log file locations, file names, and logging levels or categories.
- Awareness of best practices and potential pitfalls when editing configuration files directly.
-
Prerequisite Knowledge
-
Familiarity with:
- Basic Linux or UNIX command-line usage (for file editing and navigation)
- Text editors (e.g., vi, nano, or Notepad++)
- Understanding of network element roles (e.g., eNodeB, MME) and their functions
- General concepts of system logging and log management
-
Familiarity with:
-
Engagement and Tutorial Alignment
- This guide empowers technical professionals to confidently manage logging configurations at the file level, complementing GUI-based workflows and strengthening overall system administration capabilities.
- The tutorial’s structured approach ensures both foundational understanding and practical application, providing clear, actionable steps for real-world scenarios.
Summary of the Tutorial
This tutorial provides detailed procedures for configuring and managing log file collection for callbox systems, including eNB/gNB and MME components. It describes the steps for adjusting log settings both via configuration files and through command line interface, as well as handling log storage and rotation.
-
Default Log File Location and Backup:
- While the callbox is running, logs are collected in the /tmp directory by default.
- When the callbox stops, captured logs are automatically backed up to /var/log/lte by default.
- Both the log collection and backup directories can be modified in the configuration files.
- Automatic backup on stop can be enabled or disabled in the ots configuration file.
-
Log Configuration for eNB/gNB:
- Configuration files (e.g., enb-xyz.cfg or gnb-xyz.cfg) are located in /root/enb/config.
- The log_options parameter controls logging levels and details using the syntax: layer.field=value.
- Possible layers include phy, mac, rlc, pdcp, rrc, nas, s1ap, x2ap, gtpu, all; fields are level and max_size.
-
Common Log Collection Scenarios:
- Full Stack Log: Set log_options: "all.level=debug,all.max_size=32" to collect all messages and hex dumps up to 32 bytes.
- Full Stack with Additional Information: Add specific fields (e.g., phy.csi=1, bcch=1, mib=1, phy.signal=1) for extra protocol data.
- Limited Log: Restrict layers and size, e.g., log_options: "all.level=error,all.max_size=0,nas.level=debug,nas.max_size=1,... to focus on errors and limited layer data.
- Configuration via WebGUI is possible; otherwise, direct file editing is supported.
-
Log Configuration for MME:
- Configuration files (e.g., mme-xyz.cfg) are also in /root/enb/config.
- The log_options parameter uses similar syntax as eNB/gNB, with layers such as nas, ip, s1ap, gtpu, all.
-
Common Log Collection Scenarios:
- Full Stack Log: Use log_options: "all.level=debug,all.max_size=32" for comprehensive logging.
- Limited Log: Specify only required layers and levels, e.g., log_options: "all.level=error,all.max_size=0,nas.level=debug,nas.max_size=1,....
- Configuration can be managed via WebGUI or direct file editing.
-
Global Log Settings (ots.cfg):
- Located in /root/ots/config, the ots.cfg file contains global parameters affecting all logs.
-
Key parameters include:
- LOG_FILE: Service log file name.
- LOG_FILE_SIZE: Rotation threshold for service log files.
- LOG_SIZE: Rotation threshold for component logs.
- LOG_PATH: Target path for rotated logs.
- LOG_PERSISTENT_SIZE / COUNT: Maximum storage size and count for logs in LOG_PATH.
- LOG_GZIP: Option to compress logs in LOG_PATH.
- LOG_POLL_DELAY: Interval for polling the log directory for cleanup/compression.
- LOG_BACKUP_ON_STOP: Controls auto-backup when a component stops.
-
Log Configuration via Command Line Interface (Screen Mode):
- Logging levels and specific logs can be enabled or disabled dynamically during runtime using CLI commands in screen mode.
- This allows targeted log collection as needed, with the ability to disable logging after capturing required information.
These procedures collectively provide comprehensive control over logging for callbox systems, supporting both full and targeted data collection, flexible configuration, and efficient log management.
Where is Log Files
The logs being collected while the callbox is running are located in /tmp directory by default. You can change the location of the default directory in configuration file if you want.
There is one file per component. enb0.log holds the eNB and gNB log, mme.log the corenetwork log, and ims.log, mbmsgw.log and monitor.log the remaining components. These file names are the ones set by the log_filename parameter of each configuration file, for example log_filename: "/tmp/enb0.log" in the enb configuration shown further below.
Two entries in this directory are worth knowing about. enb0.log.bin is the binary companion of enb0.log and it is the file the WebGUI reads, so it is usually much larger than the text log. lte.log is not a file at all but a symbolic link to /var/log/lte/ots.log, which means the service log is written straight to the backup directory rather than to /tmp.
The sizes here are all small because this capture was taken while the system had been running for a short time only. These files grow continuously while the callbox runs, and they are rotated once they pass the LOG_SIZE threshold set in ots.cfg.

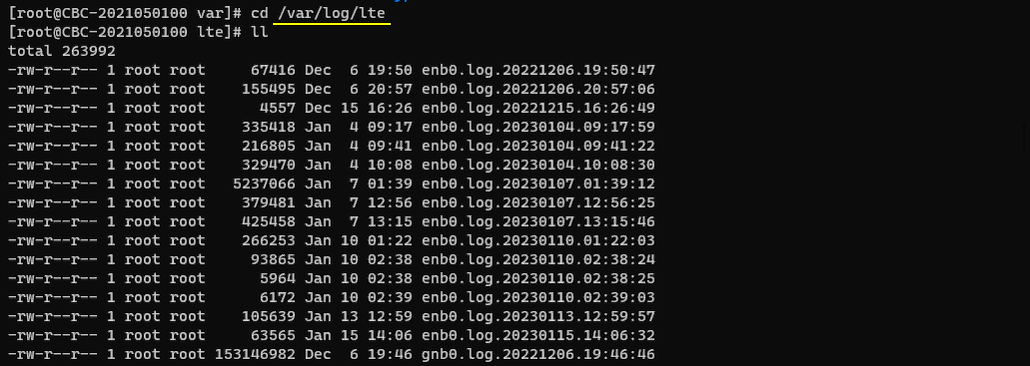
When the callbox is stopped, the captured the log is automatically backed up /var/log/lte directory by default. You can enable or disable this automatic backup in ots configuration file if you want.
The backup files keep the original name with the date and time of the stop appended, for example enb0.log.20230115.14:06:32. Every stop therefore produces a new file instead of overwriting the previous one, and the list builds up in the order the sessions were run.
The sizes vary enormously from one session to the next, from a few kilobytes up to gnb0.log.20221206.19:46:46 at about 153 MB in this listing. A full stack log with all.level=debug grows very quickly, which is what makes the LOG_PERSISTENT_SIZE and LOG_PERSISTENT_COUNT settings in ots.cfg matter. Without them this directory would keep growing until the disk filled up.
This is also the directory to look in when you want a log from an earlier session, since /tmp only ever holds the log of the run that is in progress.
Log Information and Settings in Configuration Files
eNB/gNB log
If you open up enb configuration file (e.g, enb-xyz.cfg, gnb-xyz.cfg) as shown below. By default the eNB / gNB configurations are located in /root/enb/config directory.
The part in blue are the one you need to pay attention to. Offical document for these parameters and syntax are described in enb document.
|
/* Log filter: syntax: layer.field=value[,...]
Possible layers are phy, mac, rlc, pdcp, rrc, nas, s1ap, x2ap, gtpu and all. The 'all' layer is used to address all the layers at the same time.
field values:
- 'level': the log level of each layer can be set to 'none', 'error', 'info' or 'debug'. Use 'debug' to log all the messages.
- 'max_size': set the maximum size of the hex dump. 0 means no hex dump. -1 means no limit. */ //log_options: "all.level=debug,all.max_size=32", log_options: "all.level=error,all.max_size=0,nas.level=debug,nas.max_size=1,s1ap.level=debug,s1ap.max_size=1,x2ap.level=debug,x2ap.max_size=1,rrc.level=debug,rrc.max_size=1", log_filename: "/tmp/enb0.log", |
Most important parameter is 'log_options'. If you use WebGUI, you can configure all the details of configuration on the property setting dialog box as shown here. If you are in a situation where you cannot or do not want to use WebGUI, you can configure log options in configuration file as shown here. The most common case is to collect the full log (fullstack log) or limited log.
Full Stack log
When you want to collect the full stack log (full log), configure the log option as follows.
|
log_options: "all.level=debug,all.max_size=32", |
Full Stack log and Additional Information
When you want to collect the full stack log (full log) and additional info (e.g, bcch, IQ, csi decode etc), configure the log option as follows. (
|
log_options: "all.level=debug,all.max_size=32, phy.csi=1, bcch=1, mib=1, phy.signal=1", |
Log with limited Information
It is always recommended to collect the full log, but there would be cases where you want to limit the amount of information in the log for various reasons (e.g, . (
|
log_options: "all.level=error,all.max_size=0,nas.level=debug,nas.max_size=1,s1ap.level=debug,s1ap.max_size=1,x2ap.level=debug,x2ap.max_size=1,rrc.level=debug,rrc.max_size=1", |
MME log
If you open up mme configuration file (e.g, mme-xyz.cfg, mme-xyz.cfg) as shown below. By default the configuration files are located in /root/enb/config directory.
The part in blue are the one you need to pay attention to. Offical document for these parameters and syntax are described in mme document.
|
/* Log filter: syntax: layer.field=value[,...]
Possible layers are nas, ip, s1ap, gtpu and all. The 'all' layer is used to address all the layers at the same time.
field values:
- 'level': the log level of each layer can be set to 'none', 'error', 'info' or 'debug'. Use 'debug' to log all the messages.
- 'max_size': set the maximum size of the hex dump. 0 means no hex dump. -1 means no limit. */ //log_options: "all.level=debug,all.max_size=32", log_options: "all.level=error,all.max_size=0,nas.level=debug,nas.max_size=1,s1ap.level=debug,s1ap.max_size=1,ngap.level=debug,ngap.max_size=1", log_filename: "/tmp/mme.log" |
Most important parameter is 'log_options'. If you use WebGUI, you can configure all the details of configuration on the property setting dialog box as shown here. If you are in a situation where you cannot or do not want to use WebGUI, you can configure log options in configuration file as shown here. The most common case is to collect the full log (fullstack log) or limited log.
Full Stack log
When you want to collect the full stack log (full log), configure the log option as follows.
|
log_options: "all.level=debug,all.max_size=32", |
Log with limited Information
It is always recommended to collect the full log, but there would be cases where you want to limit the amount of information in the log for various reasons (e.g, . (
|
log_options: "all.level=error,all.max_size=0,nas.level=debug,nas.max_size=1,s1ap.level=debug,s1ap.max_size=1,ngap.level=debug,ngap.max_size=1", |
Global Settings for log
By Global Setting, I mean the properties that affects the whole log files (e.g, enb0.log, mme.log etc) not for a specific component within the file. These settings are configured in ots.cfg located in the directory /root/ots/config as shown below.
|
# Logs LOG_FILE="ots.log" LOG_FILE_SIZE="1M" # Service log file size threshold for rotation LOG_SIZE="250M" # Components log file size threshold for rotation LOG_PATH="/var/log/lte/" # Log rotation target path LOG_PERSISTENT_SIZE="5G" # Maximum size of logs to store in LOG_PATH (if no unit KBytes assumed) LOG_PERSISTENT_COUNT="2000" # Maximum number of log file to keep in LOG_PATH LOG_GZIP="0" # Set to positive value to compress logs in LOG_PATH LOG_POLL_DELAY="10" LOG_BACKUP_ON_STOP="y" # Set it to n to avoid log backup (to LOG_PATH) on component stop |
Basically this configuration applies not only to ots log but also to all the component log (i.e, enb / gnb log, mme log etc).
- LOG_FILE_SIZE is for ots log, LOG_SIZE is for component log (i.e, enb, gnb, mme log etc).
- LOG_POLL_DELAY is to configure How often the log directory is polled for clean/gzip. It cleans files comparing size of logs and log count to LOG_PERSISTENT_SIZE and LOG_PERSISTENT_COUNT
Log Configuration Settings in Screen Mode (Command Line Interface)
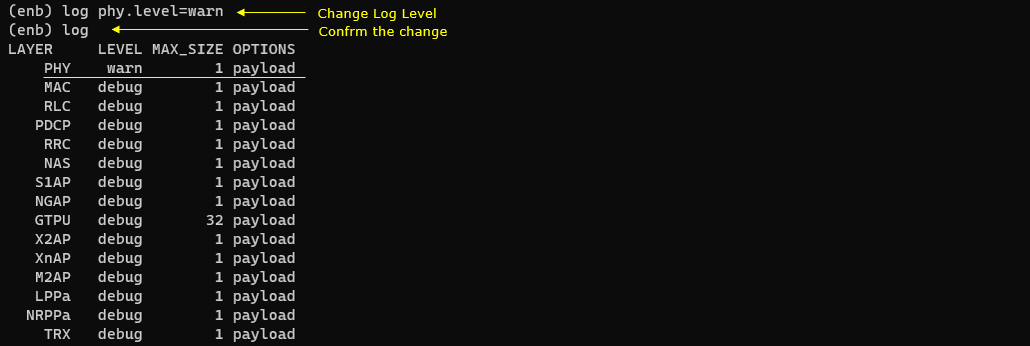
You can enable or disable a specific logging or change the log level on the fly within screen mode (command line interface) as shown below. This is convenient because you can collect a specific log only when you want and disable it afterward.
log mib=1 enables MIB (PBCH) logging and log mib=0 disables it again. This is the screen mode equivalent of adding mib=1 to the log_options line of the configuration file, with the difference that it takes effect immediately and does not require the service to be restarted.
MIB logging is a good example of something you only want for a short while. It repeats on every SSB period, so leaving it on fills the log with the same message and makes the other RRC and NAS messages harder to find.

log phy.signal=1 enables IQ logging and log phy.signal=0 disables it. The same option can be written as phy.signal=1 within log_options in the configuration file.
IQ logging is the heaviest of these options because it records the sampled waveform rather than decoded messages, so the log grows very fast while it is enabled. Turning it on only for the moment you need it and off immediately afterwards is the practical way to use it.

The log level of a single layer can be changed the same way. log phy.level=warn sets the PHY layer level, and running log with no argument prints the current setting of every layer so you can confirm the change.
The table lists LAYER, LEVEL, MAX_SIZE and OPTIONS for each layer. PHY is now at warn while MAC, RLC, PDCP, RRC, NAS, S1AP, NGAP, X2AP, XnAP, M2AP, LPPa, NRPPa and TRX all remain at debug. MAX_SIZE is 1 for every layer except GTPU which is 32, and the OPTIONS column shows payload throughout.
Running log with no argument is worth remembering on its own. It is the quickest way to see what the running system is actually logging, which is not necessarily what the configuration file says if anything has been changed on the fly during the session.