IQ Capture
There are roughly two different way of capturing IQ data. One is to capture IQ using sdr_spectrum and another way is to capture the IQ from callbox/UEsim software using Remote API. For capturing IQ with sdr_spectrum, refer to this tutorial. In this tutorial, I will demonstrate on how to capture IQ from callbox software.
Why do we want to capture IQ ? There can be various answers, but the common typical answer would be : (Of course, you may have your own purpose that are not listed here. )
- Troubleshooting at very low phy level
- Appying my own signal processing algorithm
The data format of IQ capture file in Amarisoft product is very simple. It is the repetition of 32 bit - I value and 32 bit Q value and it does not have any other information (e.g, file header or meta data) at the beginning of the file (
Table of Contents
Introduction
In the context of wireless communications and signal analysis, In-phase and Quadrature (IQ) data capture is a foundational process for accessing raw baseband signal samples. IQ data represents the complex-valued signal components that preserve both amplitude and phase information, enabling advanced analysis, troubleshooting, and custom signal processing. There are multiple approaches to capturing IQ data, with two prominent methods being the use of SDR-based tools such as sdr_spectrum and leveraging callbox or UESim (User Equipment Simulator) software via a Remote API. This tutorial focuses specifically on capturing IQ data using callbox software, which is widely used in laboratory environments for simulating cellular network conditions and interacting with mobile devices in a controlled manner. Capturing IQ data directly from a callbox enables engineers to analyze low-level PHY (Physical Layer) behaviors, validate custom signal processing algorithms, and diagnose issues that are otherwise hard to observe at higher protocol layers. The Amarisoft product line, commonly employed in such setups, outputs IQ data in a straightforward binary format: a sequence of 32-bit integers for I and Q values, repeated throughout the file without headers or metadata. This simplicity allows seamless integration with custom analysis tools, as users can easily parse and process the data using their preferred programming environment. The ability to capture, interpret, and manipulate IQ data from callbox systems is critical for researchers, developers, and test engineers working on wireless networks, device validation, and PHY-layer innovations.
-
Context and Background
- IQ data capture is essential for baseband signal analysis in wireless communication systems.
- Callbox and UESim software simulate network conditions, providing a controlled environment for device and protocol testing.
- The Amarisoft platform is frequently used for capturing raw IQ samples, enabling low-level signal access without extraneous file structure.
-
Relevance and Importance
- Capturing IQ data allows for in-depth troubleshooting and analysis at the lowest layers of the communication stack.
- Engineers and researchers can apply custom signal processing algorithms on real-world data sets, facilitating innovation in waveform design, interference analysis, and protocol validation.
- Direct access to IQ samples supports the development and validation of new PHY-layer features and enhances the ability to diagnose complex issues.
-
Learning Outcomes
- Gain proficiency in capturing IQ data from a callbox or UESim environment using a Remote API.
- Understand the Amarisoft IQ data format and how to parse and utilize these files in custom applications.
- Acquire practical skills for integrating IQ capture workflows into wireless test and development projects.
-
Prerequisite Knowledge and Skills
- Basic understanding of wireless communication principles, especially the concept of I/Q modulation and baseband processing.
- Familiarity with the operation of callbox or UESim test equipment and related software interfaces.
- Experience with programming for binary file I/O (e.g., using Python, MATLAB, or C/C++).
- Knowledge of signal processing fundamentals is recommended for advanced analysis applications.
-
Tutorial Scope and Purpose
- This tutorial is designed to guide users through the process of capturing IQ data from a callbox environment, with a focus on practical implementation and data handling.
- The tutorial will outline the end-to-end workflow, from configuring the callbox software to retrieving and interpreting the IQ files.
- By the end of this guide, learners will be equipped to conduct their own IQ capture sessions and integrate the results into their signal analysis or development pipelines.
Summary of the Tutorial
This tutorial outlines the procedures for capturing IQ samples from an LTE system using a Remote API, followed by spectrum analysis using both built-in tools and external software such as Matlab or Octave. The document includes detailed steps for configuration, data capture, and post-processing, as well as tips for adjusting sampling rates.
-
Test Procedure: Capturing IQ with Remote API
- Ensure the LTE service is running and verify basic system information, especially the sample rate and center frequency.
- Set the communication system into the desired state:
- For idle mode downlink capture, no UE connection is necessary.
- For connected mode, power on the UE and wait for it to connect.
- Use the Remote API to capture IQ samples. The basic command format is:
ws.js enb '{"message":"trx_iq_dump", "duration":<value in ms>, "rx_filename":<file name>, "tx_filename":<file name>}' - For example, to capture 5 seconds of IQ data:
./ws.js enb '{"message":"trx_iq_dump", "duration":5000, "rx_filename":"/tmp/rx.bin", "tx_filename":"/tmp/tx.bin"}' - To capture multiple channels (e.g., MIMO), specify rx_channels and tx_channels arrays, and use a filename pattern to generate separate files for each channel.
- After execution, confirm that the IQ data files have been created as specified.
-
Test Procedure: Plotting Spectrum with sdr_spectrum
- After capturing IQ data, use the sdr_spectrum program for basic spectrum analysis.
- Command syntax:
sdr_spectrum -iq <filename> -rx_freq <frequency> -rate <sample_rate> - Example command:
/root/trx_sdr/sdr_spectrum -iq /tmp/tx.bin -rx_freq 2560e6 -rate 30.72e6 - If running over SSH, use the -X option to enable graphical output.
-
Test Procedure: Plotting Spectrum with Octave/Matlab
- Transfer the captured IQ data file to your PC if necessary.
- Use provided Octave/Matlab code to:
- Read binary IQ data into an array.
- Extract a manageable chunk of data for analysis.
- Separate I and Q components and form a complex array.
- Apply FFT and convert results to dB scale.
- Plot both time-domain and frequency-domain representations using subplot functions.
- The sample code demonstrates how to process and visualize LTE downlink signals in idle mode.
-
Additional Tips: Adjusting Sampling Rate
- If the default sampling rate is unsuitable, you can:
- Resample the captured IQ data using your own post-processing software.
- Modify the sample rate directly in the system configuration file (e.g., enb.default.cfg).
- Confirm any changes in sampling rate via the system's monitoring interface.
- If the default sampling rate is unsuitable, you can:
The tutorial provides a comprehensive methodology for IQ data capture and analysis in LTE systems, supporting both basic and advanced signal analysis workflows.
Test Setup
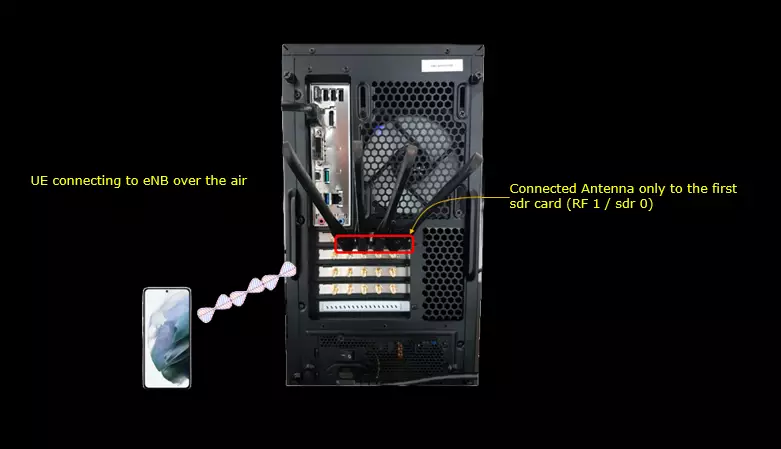
Configuration
I would not suggest any specific configuration here. You can use any configuration that fits your demand. enb.default.cfg or gnb-sa.cfg can be a good start.
Test 1 : Capturing IQ with Remote API
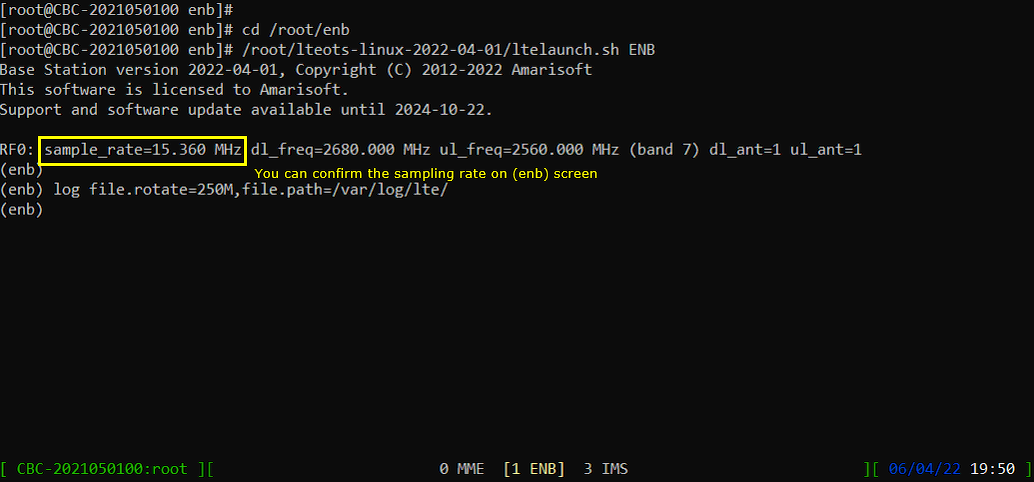
Run LTE service and check some basic information as shown below. It is not mandatory to check all these information but it is worth knowing sample rate and center frequency at least.


Put the communication into a status that you want. If you just capture idle mode downlink signal, you don't need to connect any UE. If you want to capture signal in connected mode, power on UE and wait until it gets into connected mode

Once the call is in the status that you like, collect IQ using Remote API as in the following format. (
# ws.js enb '{"message":"trx_iq_dump", "duration":<value in ms> , "rx_filename":<file name>, "tx_filename":<file name>}'
The command that I used for this specific case is as follows : You should root this command at /root/enb
|
./ws.js enb '{"message":"trx_iq_dump", "duration":5000 , "rx_filename":"/tmp/rx.bin", "tx_filename":"/tmp/tx.bin"}' |

Confirm that the IQ has been captured as you specified.

# ws.js enb '{"message":"trx_iq_dump", "rx_channels":<array>, "tx_channels":<array>, "duration":<value in ms> , "rx_filename":<file name%d>, "tx_filename":<file name%d>}'
Example : # ./ws.js enb '{"message":"trx_iq_dump", "rx_channels":[0,1], "duration":10 , "rx_filename":"/tmp/rx_file%d"}'
// This create two files rx_file0.bin and rx_file1.bin in /tmp directory
Plotting Spectrum with sdr_spectrum
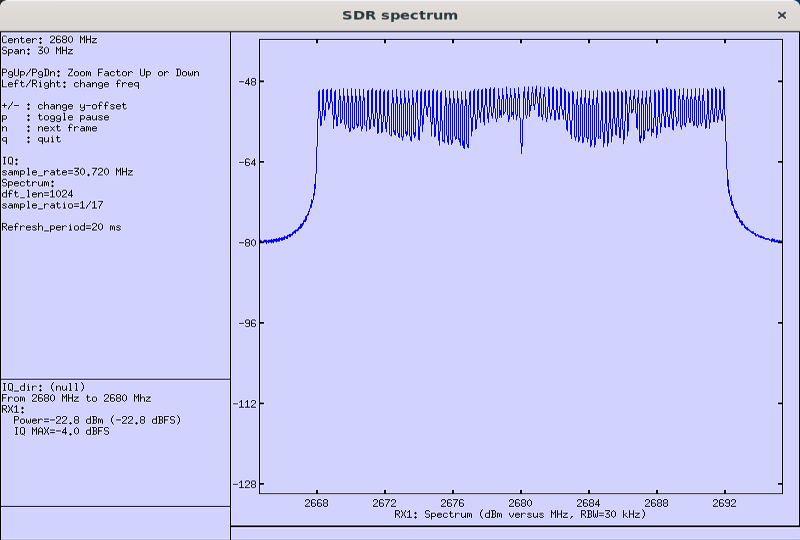
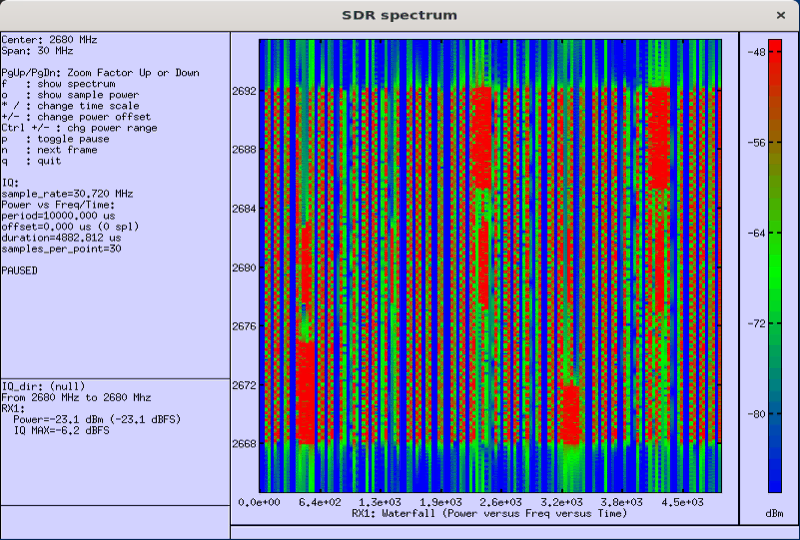
Once you have I/Q files captured, you may want to use your own software (e.g, Matlab) if you want to process it in your own way, but you can use sdr_spectrum program in the installation package for basic spectrum analysis. (If you are not familiar with sdr_spectrum basics, refer to this tutorial)
You can plot spectrum with sdr_spectrum with the syntax as below : sdr_spectrum -iq <filename> -rx_freq <frequency> -rate <sample_rate>
The command that I used in this specific case is as follows :
|
/root/trx_sdr/sdr_spectrum -iq /tmp/tx.bin -rx_freq 2560e6 -rate 30.72e6 |
![]()
Plotting Spectrum with Octave/Matlab
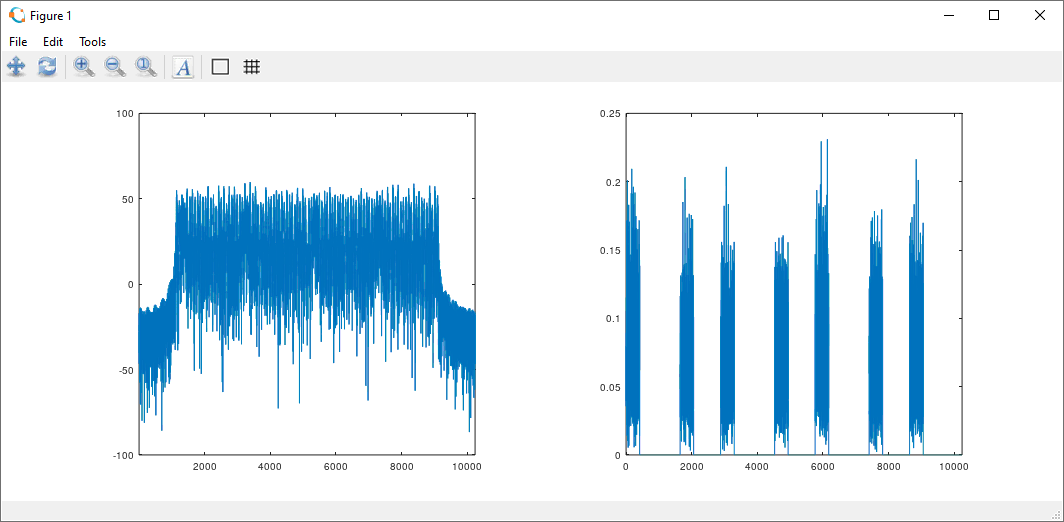
You can post process the captured IQ data as you like. Following is an example Octave code just to show you on the file format and how to read the captured I/Q.
|
% By following routine, the whole data are read and stored in the variable 'data'. I ran this on Windows PC and tx.bin file is located in C:\temp folder. fid = fopen('C:\\temp\\tx.bin','r'); [data,count] = fread(fid, 'single'); fclose(fid); % I want to display the data in frequency domain, but I will slice out only a small portions of the data % since the total number of data is too big. ChunkStart = 1; ChunkLength = 1024*2*10; DataChunk = data(ChunkStart:ChunkStart+ChunkLength-1); % Now I will separate I value and Q value and save them into separate variable. DataChunkI = DataChunk(1:2:length(DataChunk)); DataChunkQ = DataChunk(2:2:length(DataChunk)); % I will combine the I data and Q data into an array of Complex Number DataChunkComplex = DataChunkI + (DataChunkQ .* j); % Do FFT and plot it in dB scale. DataChunkFFT = fftshift(fft(DataChunkComplex)); DataChunkFftdB = 20*log(abs(DataChunkFFT)); % Plot the data in frequency and time domain subplot(1,2,1); plot(DataChunkFftdB);xlim([1, length(DataChunkFftdB)]); subplot(1,2,2); plot(abs(DataChunkComplex)); xlim([0 length(DataChunkComplex)]); |
This is a result of the sample code. (NOTE : The IQ data shown below is the LTE DL signal without any UE connected. So the signal in time domain looks bursty).
Tips
Changing Sampling Rate
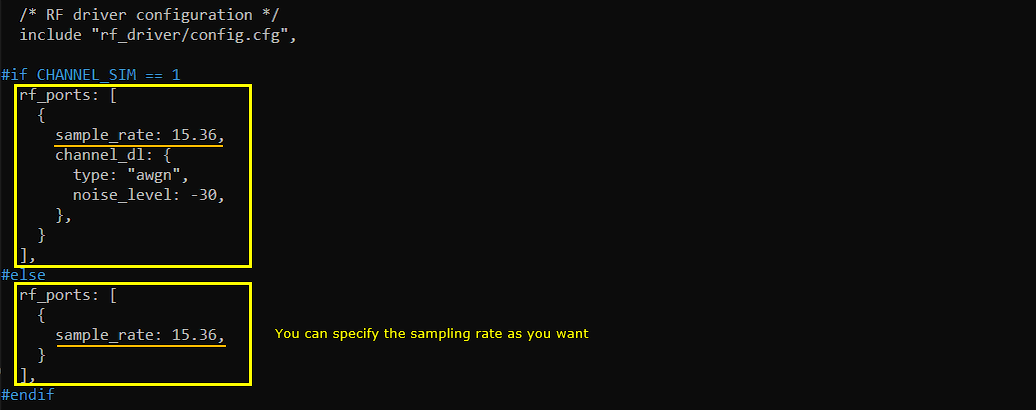
If the Sampling Rate for the captured data is not what you wanted, you can resample the data from the captured IQ using your own software or you can change the sampling rate in configuration file as shown in the following example. This example is the configuration that I set in LTE configuration.
You can specify the sample rate in the configuration file as shown below.
You can confirm the changed sample rate in (enb) screen as shown below.
