LTE Web Interface version 2025-11-19*This document is based on the latest test release.
Features may not be present in your current installed software. You may check their availability in change history or in your release documentation.
If you require an up to date release, ask for it in a ticket.
Features may not be present in your current installed software. You may check their availability in change history or in your release documentation.
If you require an up to date release, ask for it in a ticket.
Table of Contents
1 Introduction
LTE Web Interface is a HTML5 graphical user interface.
It allows to analyze Amarisoft LTE software logs and get information from the system.
It can communicates using WebSocket for real time analysis.
It also interact with LTE UE simulator to generate and execute scenario.
Using node webkit, it is possible to use it as a standalone application and associate it with your log files in your file browser.
2 Features
- - Display logs from files.
- - Display logs in real time through WebSocket.
- - Display physical layer statistics in charts.
- - Display resource block allocation.
- - Support of real time constellation display.
- - Display of HFN in logs.
- - Support and display of per cell analytics.
- - Support of ZIP files for opening and exporting logs.
- - Support of wireshark for extended message decoding (SMS, IP).
- - Configure UE simulation scenario and execute them.
3 Requirements
3.1 Software requirements
3.1.1 Web server mode
Mandatory:
- An up and running web Server to host pages (Ex: Apache).
- Chrome or Firefox web browser (Other browser have not been tested)
Optional:
- PHP support on web browser.
3.1.2 Standalone mode
Node Webkit must be installed on your system.
4 Installation
4.1 Web server mode
4.1.1 Server side
Simply copy all file to a HTTP server directory.
For apache:
cp -r <directory> /var/www/html/lte
4.1.2 Client
Use your HTTP server URL.
For apache, http://<server name>/lte/
4.1.3 Troubleshoot
If you are not familiar with Linux and web servers, you may need to look on the web for information on how to setup a web server correctly (Depending on your Linux flavour, there are too many possible environment, which is out of the scope of this document).
However, if you use Apache with Fedora, here are the common things you can try:
- Check your web server is started:
sudo service httpd status
If it is inactive, you may start it:
sudo service httpd start
- Check and update filesystem permissions to grant Apache access to the pages.
-
SELinuxmay prevent apache to host pages properly. You may disable it this way:sudo setenforce 0
4.2 Standalone mode
You may use the GUI as a standalone application.
For this, you need Node WebKit to be installed on your machine.
4.2.1 Linux
To install it on Fedora:
sudo dnf install nodejs npm
sudo npm install -g nw --unsafe-perm=true
Then, copy directory wherever you want, and you can use it this way:
<directory>./logview.sh <file1.log> <file2.log> ...
4.2.2 Windows
On windows, follow https://nwjs.io/ to download archive.
Extract it to <nw-dir>.
You may place it to c:\Program Files\nwjs
If you want to place it elsewhere, you will have to edit logview.bat to change path
To open application, you just need to double click on logview.bat file.
You may open it with log file as command line argument.
4.2.3 Wireshark
If wireshark is installed on your system, you will benefit advanced logs for different layers.
On windows system, you may update tshark path by editing
TSHARK_WIN32 or TSHARK_LINUX variables in client.js
according to your system.
4.3 GUI definition
The GUI is divided into several panels.
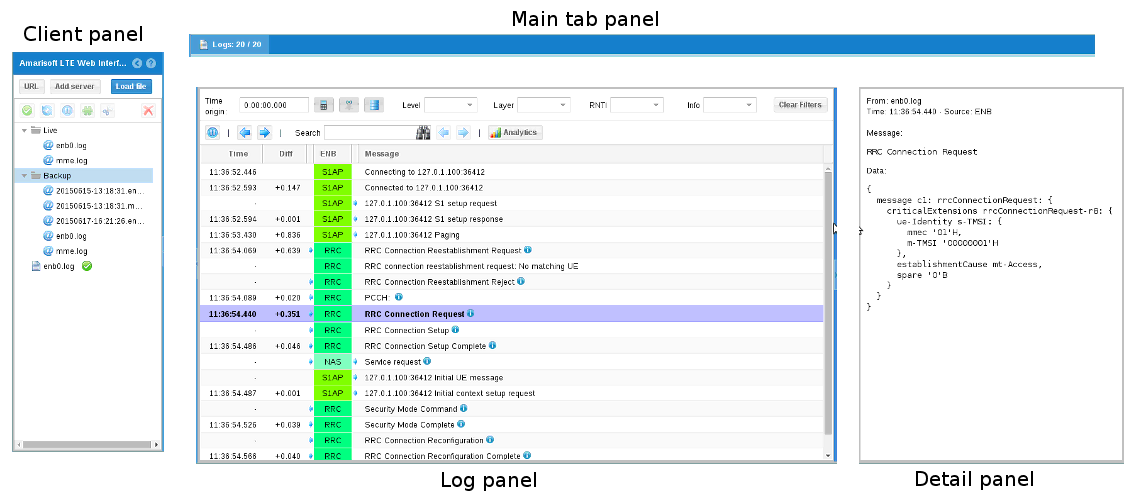
- Client panel.
This is where you add, remove and configure your sources (See Manage your clients).
- Main tab panel. In this tab panel you can select:
- log panel
- stats panel
- for each WebSocket client, its own panel
- UE Simulation panel
- Log panel. This is where all logs from all clients will be displayed.
- Detail panel. Display selected log detailed information.
5 Manage your clients
To display log and/or interact with Amarisoft software, you need to add a client.
The list of your client is displayed on left panel of the interface.
5.1 Log files
You can display logs generated by an Amarisoft LTE software by clicking on
Load file button in client panel and selecting the log file.
A entry will be added on client panel and logs will be parsed and displayed on log panel.
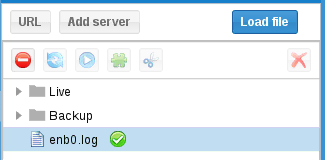
The green tick  means the client is enabled and logs are displayed.
When selecting a client, a list of actions will be available on the top toolbar (See Client action).
5.2 WebSocket
To create a WebSocket client, you first need to enable remote API on Amarisoft software
component (MME, eNB, IMS, UE Simulator).
This is done via com_addr parameter. Please refer to the component documentation
for more detail.
Then click on Add server button:
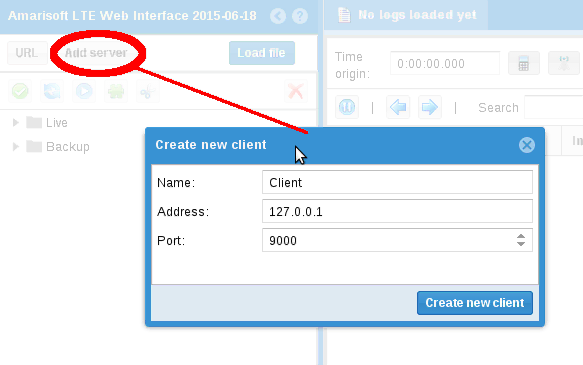
Enter name that will appear on client panel and the address you entered as com_addr.
After clicking on update button, the client will try to connect.
If connection is successful, the configuration window will appear so that you configure logs:
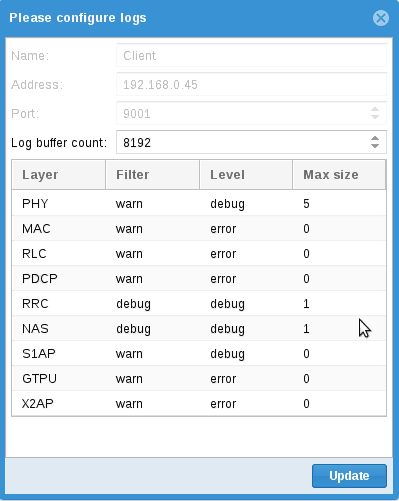
For each layer you can define:
- Filter. This is the level of log that will be downloaded to the GUI.
- Level. This is the level of log on the component, as defined in
log_optionsof its configuration file.
Each time the client connects to the component, it applies the configuration defined here, overriding its current log level configuration. The log files locally generated by each component are also affected. The components configuration file remain unchanged. - Max size. Log data size as defined in
log_optionsof its configuration file.
Of course, you can keep default configuration and simply click on Update.
The  icon means the client is not connected whereas
 means the client is connecting and
 means the client is connected.
When connected, a new tab will appear in main tab panel and provide you advanced features.
5.3 URL
You can retrieve a log from any URL with this client.
Click on URL button and enter parameters.
The icon means the log file was not loaded whereas
means it has been successfully parsed.
5.4 Client action
Here are the action you can perform on a client
-
 to open configuration window.
-
 to enable or disable a client.
(You can also double click on the client line to toggle state).
to enable or disable a client.
(You can also double click on the client line to toggle state).
-
 to force WebSocket client reconnection.
-

 to start or stop real time log update on WebSocket client.
-
 to display resource block allocation (Physical layer logs are required).
-
 to clear logs on WebSocket client.
-
 to remove client.
5.5 Server store
You can store your log files on the Web Server to access it through the interface.
You need to put your log files in store directory on the server.
NB: Subdirectories are allowed.
Then expand the store node in client panel, and you’ll have access to all the files.
Select them and click on enable button (or double click) to display logs.
Note that your HTTP server requires php support.
5.6 Configure your clients
You can change the configuration of URL and WebSocket clients.
Select client line click on configuration button.
Update config as wanted and click on Update button.
6 Log display
6.1 Introduction
When a client is enabled, logs appear on log panel.
You can enable multiple client together to mix logs. This may be useful to mix MME,
eNB, IMS and/or UE logs.
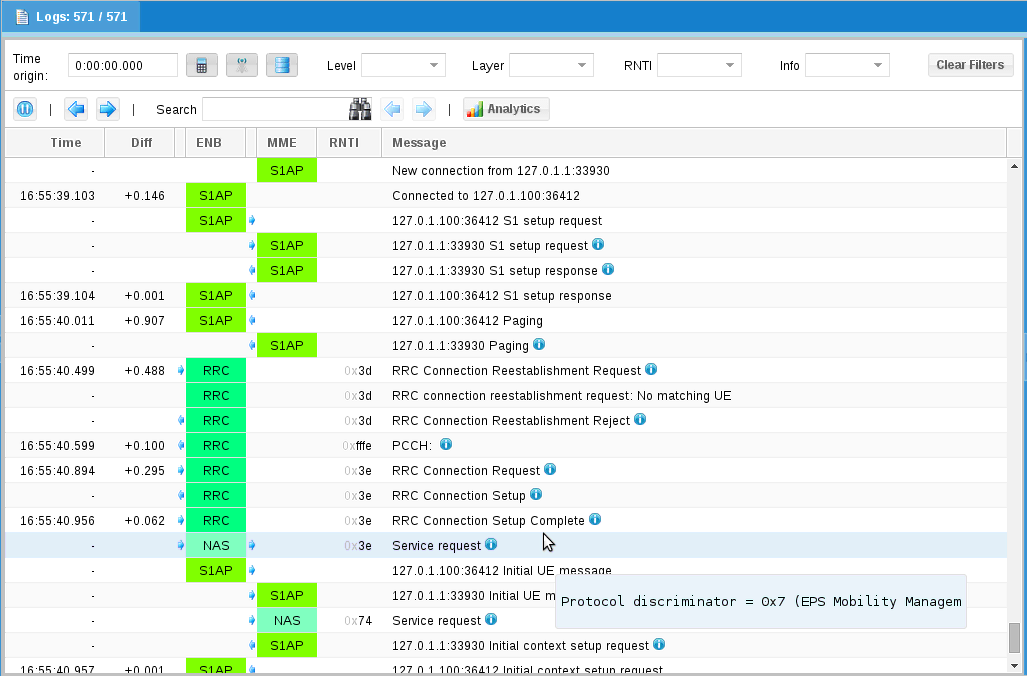
Each line represent a log.
Columns are:
- Time. Log time (
-means same as previous log). - Diff. Time difference with previous log
- RAN, CN, IMS, UE. One of this column is filled with the layer name and provides origin of the log.
The and
and  icons represent,
if present the log direction (Uplink or Downlink).
icons represent,
if present the log direction (Uplink or Downlink).
- ID. RNTI for PHY, MAC, RRC and RLC layers.
- Info. More information depending on layer.
- IMSI. Optional column displayed when IMSI based filtering is possible.
- IMEI. Optional column displayed when IMEI based filtering is possible.
- Message. Log text message.
If the log has detailed informations, i.e.max_sizehas been set for its layer, a icon will be displayed.
When clicking on the line, details will appear on right panel.
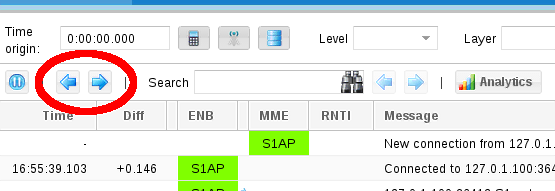
6.2 Navigating
When a log line is selected, use and
buttons to highlight previous or next log of
same layer:
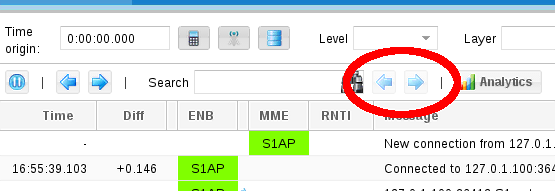
Fill search field to search in messages, ID, info and details.
Use and buttons to highlight
previous or next match:
6.3 Filtering
TBD
6.4 Display physical layer statistics
If your logs have physical layer included, you can display statistics.
Click on Analytics button to open window.
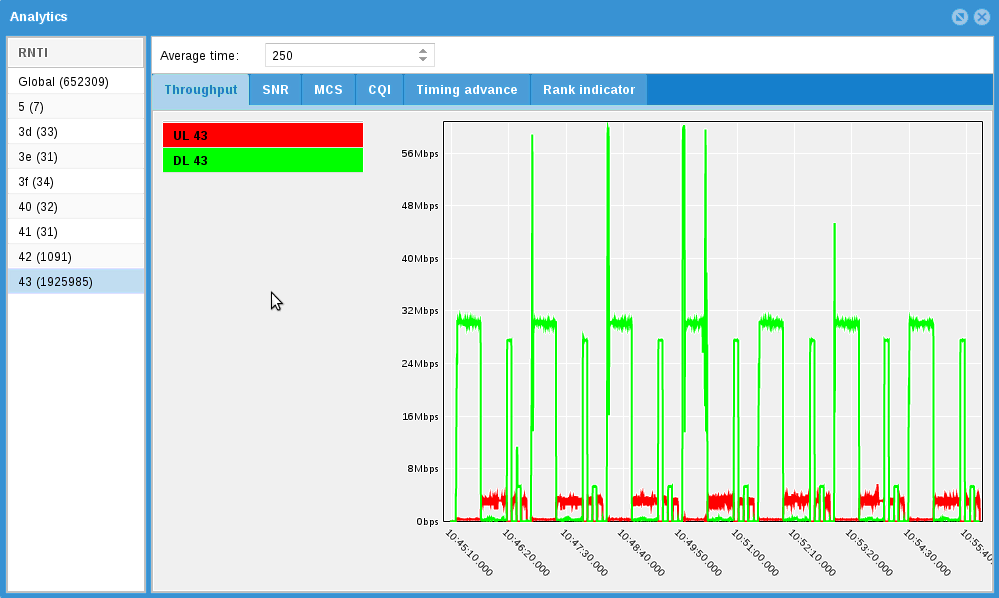
On left, you will have the list of radio connections.
You can select one or several by maintaining shift key.
It will display statistics in charts.
Average time parameter allow smoothing curves.
6.5 Display resource block allocation
If your logs have physical layer included, you can display ressource block allocation by clicking button:
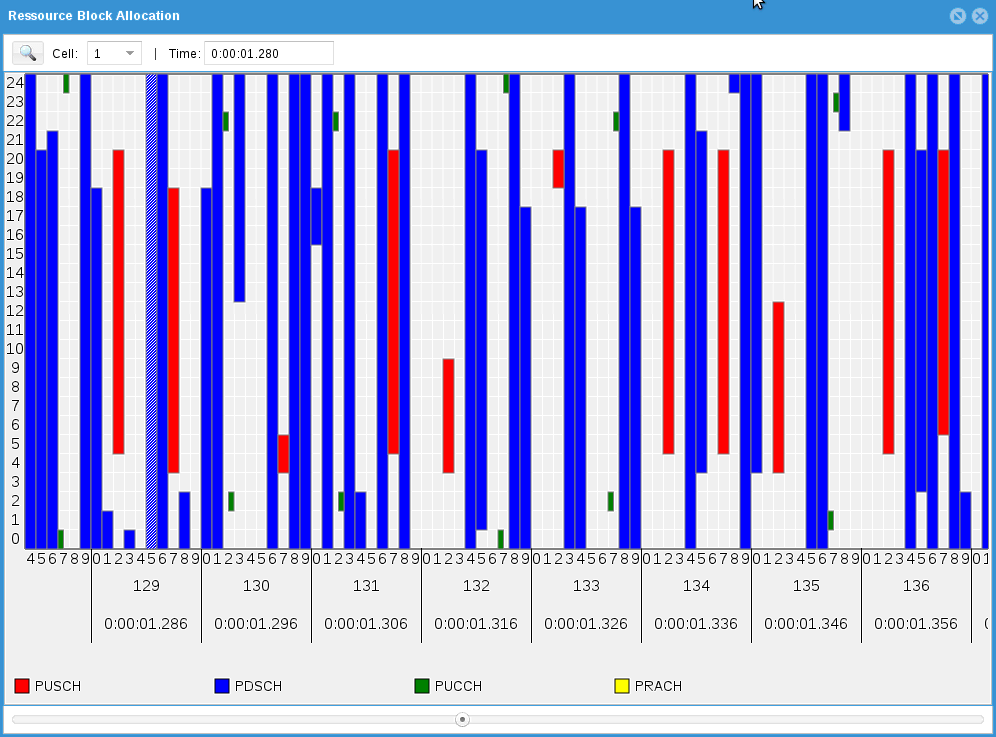
Use mouse wheel to scale.
Drag and drop to move inside allocations.
Hashed block are not acknowledged packet.
You can select allocated blocks, this will also select associated log in log panel.
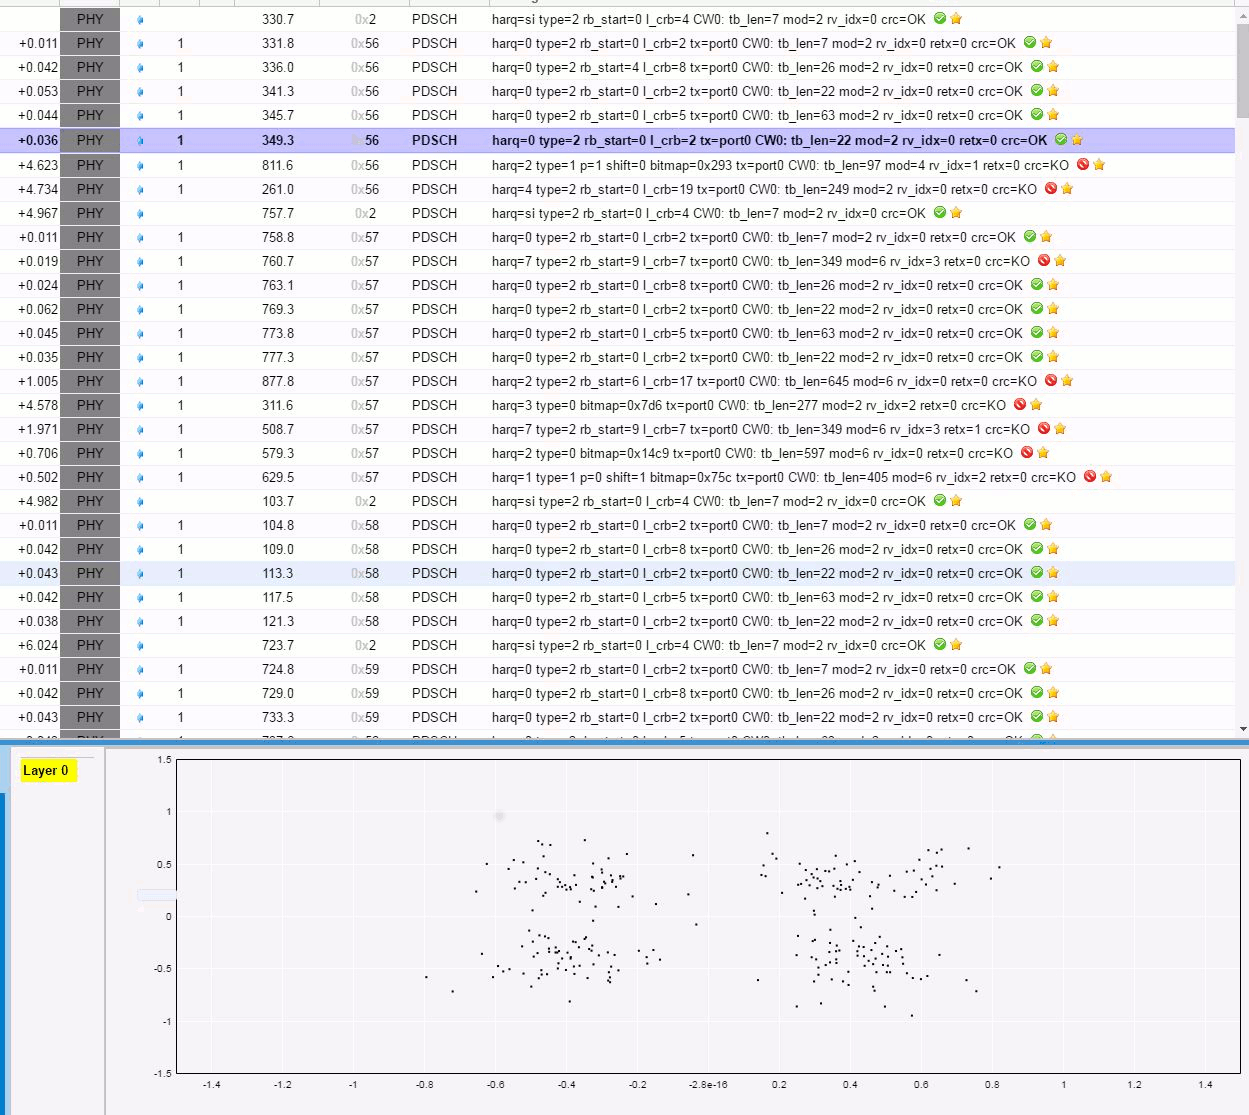
6.6 Display constellation and channel response time
If your logs have physical layer included with signal level activated (phy.signal=1), you can display the QAM constellation and the channel response time.
You should take a look at PHY layer logs. When a yellow star is diplayed, click on it and a bottom panel should appear.
6.7 Miscellaneous
6.7.1 Time origin
This field allow logs time to be relative to it.
You can set it manually or by right clicking on a log line and selecting Set time origin
6.7.2 Pause log update
You can click on to pause log update.
This may be useful when a WebSocket client is constantly adding logs.
7 Change history
7.1 Version 2025-03-14
- Added log text filter
7.2 Version 2024-12-13
- Added dataset export for graphs
- Added graph axis manual configuration
- Added UE selection filter to eNB server tab
- Added IPv6 support for UE scenario IP simulations
- Added reconnect all server button
- Added attach PDN type to UE scenario
7.3 Version 2024-09-13
- Added power on and power off button for UE tab
- Added option to remove all UEs before launching UE scenario
- Added cell merging for RB diagram
7.4 Version 2024-06-14
- Added reference signal power handling in enb RF config window
- Added ue-scenario-player.js to play GUI UE scenario from command line
7.5 Version 2024-03-15
- Added UE multi scenario management
- Added
NAS typefor UE scenario
7.6 Version 2023-12-15
- Added SSB in resource block diagram
- Added support of 3 digits MNC in UE scenario
7.7 Version 2023-09-08
- Added multi rat configuration in UE scenario
- Added an ASN.1 editor to be used for the lteenb program configuration
7.8 Version 2023-06-10
- Added more channel simulations to UE scenario
- Added support of mathematical formula for external application args parameter in UE scenario
- Set keep config as default for new WebSocket servers
- Added log config flags configuration in WebSocket server configuration window
- Added S72 layer support
7.9 Version 2023-03-17
- Added UE tracking upon MME/eNB logs, allowing IMSI/IMEI filter in eNB
- Added graph navigation:
- Press
ctrlthen maintainleft clickto select x range - Press
ctrl+shiftthen maintainleft clickto select x and y ranges - Press
ctrl+left clickto reset x and y ranges - Maintain
left clickto move selected ranges - Use
mouse wheelto zoom in/zoom out
- Press
7.10 Version 2022-06-17
- Added real time bler graph for eNB
- Added instant values in analytics graph
- Added filename selection for log export
- Added log markers in exported logs
- Added PDCCH detection for PUSCH logs
- Caps below 1 are now allowed in UE scenarii
7.11 Version 2022-03-18
- WebSocket servers can be configured to keep configuration instead of overriding it at connection establishment
- In UE scenario, number of connections per second can be set below 1
7.12 Version 2021-12-17
- UE scenario can now be exported/imported to store and share them accross different machines
8 License
ltewww is copyright (C) 2012-2025 Amarisoft. Its redistribution
without authorization is prohibited.
ltewww is available without any express or implied warranty. In
no event will Amarisoft be held liable for any damages arising from
the use of this software.
For more information on licensing, please refer to license terms.