eNodeB Load Testing version 2026-04-02*This document is based on the latest test release.
Features may not be present in your current installed software. You may check their availability in your release documentation.
If you require an up to date release, ask for it in a ticket.
Features may not be present in your current installed software. You may check their availability in your release documentation.
If you require an up to date release, ask for it in a ticket.
Table of Contents
1 Introduction
This application note explains how to evaluate a hardware platform to host Amarisoft eNodeB. A common question frequently asked is whether a hardware is efficient enough to run Amarisoft eNodeB and how many active UEs with ongoing traffic could be served within a cell. This application note explains the eNodeB test mode functionality and how it can be used to benchmark a specific processor and hardware platform.
1.1 Background
In order to check the performance of a processor, 2 parameters need to be checked.
- eNodeB CPU load: This is the total CPU load of the processor when running eNodeB. As the eNodeB runs on multiple cores, it is effectively the sum of each CPU core load running the eNodeB software
- Baseband latency: It is defined to be the processing latency at baseband side.
In LTE network, there are 4 msec between RX and TX which means that the system has 4 msec to:
- Convert the received analog signal to digital.
- Transmit the IQ samples to baseband depending on used RF. For a PCIe SDR card, it would be over a PCIe bus while for a N210, it would be over Ethernet.
- Process the DL data at physical layer (demodulation, decoding, etc) before sending it to protocol stack for further analysis.
- Generate UL date and process it at protocol stack side as well as at physical layer side (coding, modulation, etc).
- Transmit UL IQ samples toward RF.
- Convert digital signal to analog.
Steps 3 and 4 correspond to pure baseband processing while steps 1, 2, 5 and 6 correspond to the IQ data transfer and radio frontend processing. The most important factor when evaluating a hardware performance is to measure the LTE baseband processing latency. It allows to assess the interaction between Amarisoft software architecture and the CPU.
Amarisoft software monitors the baseband latency (steps 3 and 4) and displays the remaining time left for radio front end (steps 1, 2, 5 and 6 ) via t cpu command.
This command can be run in eNodeB screen. Its output is as follows:
-Proc-  ---RX--------   ---TX--------   --- TX/RX diff (ms)
   CPU    MS/s    CPU     MS/s    CPU   min/avg/max sigma
 22.6%  11.519   9.4%   11.518   1.8%   2.8/3.3/3.8 0.3
Proc/CPU indicates the total CPU load of the eNodeB process. RX/CPU corresponds to the time passed when reading IQ samples from RF driver and TX/CPU is the time spent writing IQ samples to RF driver.
The interesting part is the TX/RX diff and particularly the min value that corresponds to the minimum available time for radio front end processing.
When benchmarking a CPU, first thing to do is to check that this value is higher than a threshold depending on the radio front end.
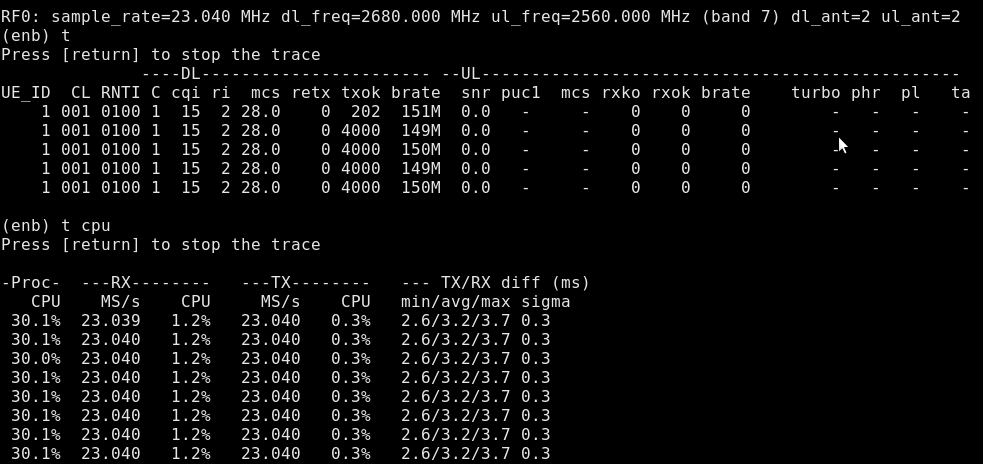
The following screenshot depicts the output of t cpu command taken during a UDP DL transfer at 150 Mbps (20MHz cell 2x2 MIMO) with a Samsung Galaxy S5 using Amarisoft eNodeB coupled with a PCIe SDR card.
We can see that there is a large margin for RF processing as the min value is around 2.6 msec which means that the baseband took at worst case 1.4 msec to finish its processing leaving 2.6 msec at the RF side.
2 eNodeB Test Mode
In order to facilitate the load and latency measurements without a complicated test setup, we can use eNodeB test mode. This mode enables specific tests where UE contexts are automatically created. The goal is to define an environment close enough to what we are targeting in terms of number of UEs and average throughput. For more details about test mode, please refer to eNodeB documentation.
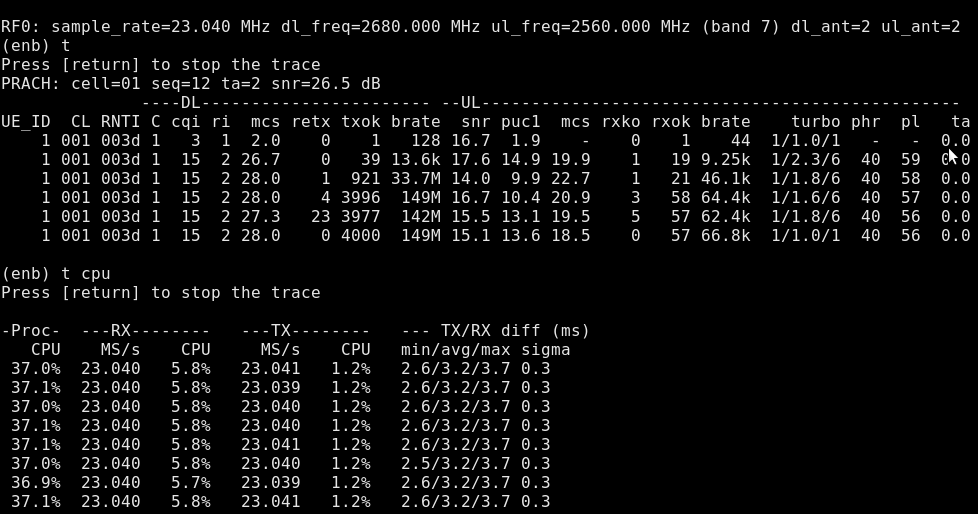
The following screenshot depicts the output of t cpu command taken with eNodeB in PDSCH test mode using PCIe SDR card simulating one single UE with continuous PDSCH reception. In this mode, the cell properties pdcch_format, pdsch_mcs, forced_ri, forced_cqi, transmission_mode, dl_256qam can be used to force specific PDSCH parameters.
In our example, the simulation is done by adding the following lines to configuration file config/mimo-2x2-20mhz.cfg. By setting parameters forced_ri: 2, forced_cqi: 15, the PDSCH is transmitted using DL MCS of 28 in MIMO mode.
    forced_cqi: 15,
    forced_ri: 2,

    test_mode: {
      type: "pdsch", /* PDSCH continuous reception */
      pdsch_retx: false, /* if false, don't force the UE to retransmit in case of error */
      rnti: 0x100, /* RNTI for PUSCH */
    },
It is not always possible to measure the performance of a certain hardware with a radio front end as the radio might not be available. In this case, the eNodeB software could be run with a dummy RF allowing to make measurement without any radio front end.
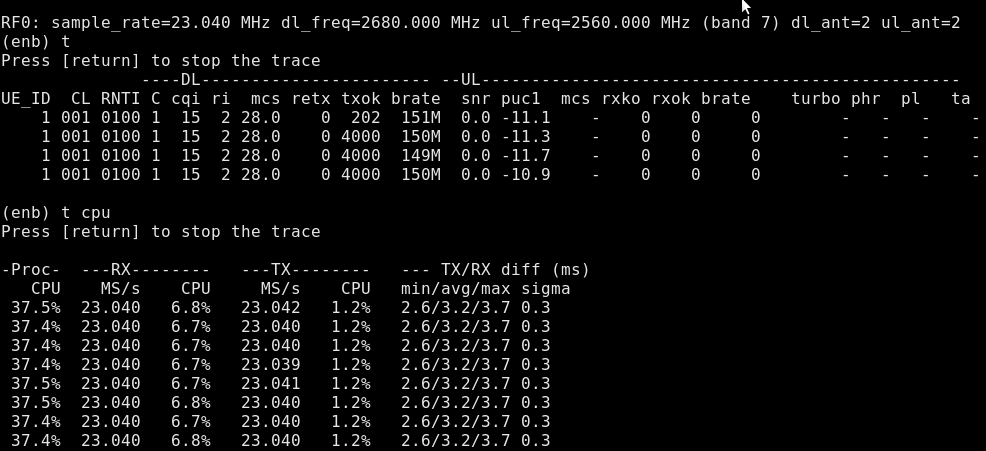
The following screenshot depicts the output of t cpu command taken with eNodeB in test mode using a dummy RF driver and simulating one single UE with continuous PDSCH reception at MCS 28. The same configuration file as the previous test is used but this time the eNodeB has been launched with -n option which forces the use of dummy RF driver.
Using a dummy RF ignores the impact of radio front end, specially the I/O part (Ethernet, USB, PCIe...), on the overall system performance. A precise measurement can only be performed in real conditions in the presence of a radio front end and real UEs. The test mode only gives an approximate indication of load and latency. This could easily be observed when comparing the results of t cpu command using the dummy RF driver versus Samsung Galaxy S5.
Finally, the most interesting test mode type to use is the load test mode. In this mode, several UEs are instantiated and all are transmitting and receiving at the same time. You can specify the number of UEs as well as a defined error rate in UL/DL. The cell properties pusch_mcs, forced_ri, forced_cqi can be used to set the simulated radio conditions. It provides a convenient way to benchmark the processor in the presence of multiple UEs with simultaneous UL and DL traffic.
The following screenshot depicts the output of t cpu command taken with eNodeB in load test mode using a dummy RF driver and simulating 100 UEs with continuous PDSCH and PUSCH.
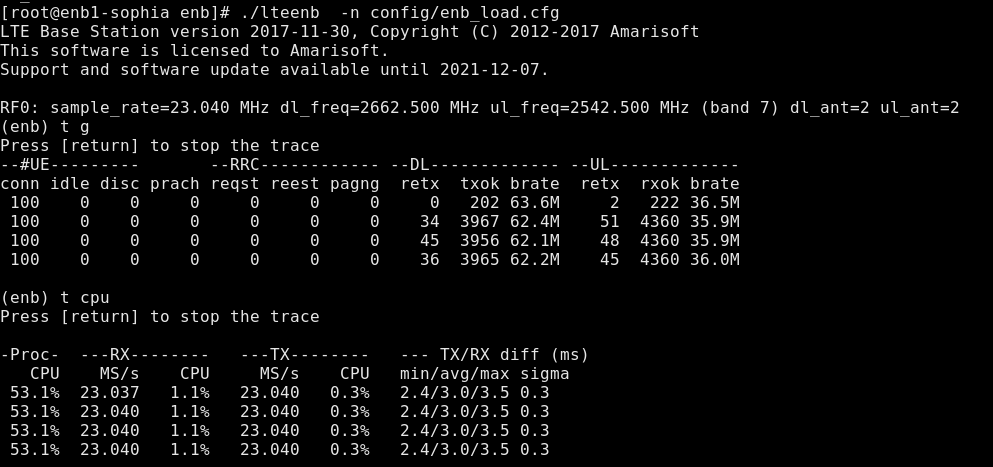
This is generated by adding the following lines to the eNodeB configuration file.
    pusch_mcs: 20,
    forced_cqi: 15,
    test_mode: {
      type: "load",
      ue_count: 100,
      pusch_fer: 0.01,
      pdsch_fer: 0.01,
    },
3 Benchmarking Methodology
Based on what we explained above, evaluating a hardware platform requires the following steps:
- Prepare the eNodeB configuration file as per your cell configuration.
- Add
loadtest mode to your eNodeB configuration file by setting the number of users within the cell and the error rate as per your nominal use case. - Use the
pdsch_mcs, forced_cqi, forced_rito set a certain data rate in DL. - Use the
pusch_mcsto set the data rate in UL. - Start eNodeB with
-noption if you do not have access to the radio head. Run thet cpucommand in eNodeB screen and checkTX/RX diff min. This value should be higher than a threshold depending on your target radio front end. - If you have access to the radio head, then you can run the eNodeB and check the output of
t cpucommand. You should have at leastTX/RX diff min > 0.5 msec. Having a couple of bad values does not impact the overall functionality of the system statistically.
4 Additional Information
This document is copyright (C) 2012-2026 Amarisoft. Its redistribution without authorization is prohibited.
This document is available without any express or implied warranty and is subject to change without notice. In no event will Amarisoft be held liable for any damages arising from the use of this document.
For any technical issue, please raise a ticket from our support site at https://support.amarisoft.com/.
To learn more about our technology and solutions, e-mail us at customer@amarisoft.com or visit https://www.amarisoft.com.