Remote API - IQ Dump
The purpose of this tutorial is to show how to collect IQ data that are saved in separate files for each slot. For this purpose, Amarisoft provide a special java script called 'trx-iq-dump.js'. There are several different ways to capture I/Q data, but this method is special in a few ways as below
- Save the I/Q for each slot in separate files with specified SFN
- Can save both downlink and uplink simulteneously (Three different options to save : DL only, UL only, DL and UL simulteneously)
Table of Contents
Introduction
Intelligent collection and analysis of IQ (In-phase and Quadrature) data is a pivotal aspect of modern wireless communications testing and validation, particularly in the context of 4G and 5G networks. IQ data represents the raw baseband signal information prior to modulation or after demodulation, providing critical insight into the integrity and performance of radio transmissions. Amarisoft, a leading provider of software-defined radio (SDR) solutions, facilitates advanced IQ data capture through specialized scripting interfaces. The 'trx-iq-dump.js' JavaScript tool enhances the granularity of IQ data acquisition by enabling per-slot data segmentation, thereby allowing users to save IQ samples for each slot in separate files indexed by System Frame Number (SFN). This approach is highly beneficial for debugging, performance analysis, and compliance testing, as it allows precise isolation and examination of specific radio frames. Architecturally, this method leverages Amarisoft’s flexible SDR platform, interfacing with the physical layer (PHY) to extract both downlink (DL) and uplink (UL) IQ samples in real-time. The ability to concurrently capture DL and UL data, with configurable options for selective or simultaneous acquisition, ensures comprehensive visibility into radio link dynamics. Such capabilities are essential for network engineers, protocol developers, and researchers aiming to verify signal fidelity, troubleshoot issues, or develop advanced radio algorithms. As part of the Amarisoft Callbox ecosystem, this feature integrates seamlessly with other network emulation and testing tools, reinforcing its significance within the broader wireless development and testing landscape.
-
Context and Background
- IQ data is fundamental for physical layer analysis in wireless communications, enabling detailed scrutiny of signal quality, interference, and protocol compliance.
- Amarisoft’s software-defined radio platform provides extensible scripting support, allowing customized data capture workflows tailored to advanced testing scenarios.
- The 'trx-iq-dump.js' script introduces a specialized mechanism to capture and organize IQ samples per slot, indexed by SFN, which is crucial for frame-level analysis.
-
Relevance and Importance of the Tutorial
- Slot-based IQ data capture is particularly valuable for diagnosing transient issues, verifying scheduling algorithms, and correlating protocol events with physical layer signals.
- This tutorial empowers users to harness Amarisoft’s advanced data collection capabilities, enhancing their ability to conduct precise and repeatable RF testing.
- Understanding this process is critical for professionals engaged in network equipment development, conformance testing, and research on next-generation wireless technologies.
-
Learning Outcomes
- Gain practical experience with Amarisoft’s scripting environment and IQ data capture tools.
- Learn how to configure and execute slot-based IQ data dumps, including options for DL, UL, or both simultaneously.
- Acquire skills to organize, analyze, and interpret slot-indexed IQ data for troubleshooting and optimization purposes.
- Understand the integration of this workflow within the Amarisoft Callbox platform and its implications for broader testing and development activities.
-
Prerequisite Knowledge and Skills
- Familiarity with wireless communication fundamentals, particularly LTE/NR physical layer concepts.
- Basic knowledge of Amarisoft Callbox architecture and operation.
- Experience with scripting or command-line interfaces is advantageous for efficient use of the provided tools.
- Understanding of IQ data structure and its relevance to signal analysis will enhance the value derived from the tutorial.
Summary of the Tutorial
This tutorial explains the procedure for capturing and post-processing I/Q data per slot using a dedicated script on the Callbox platform, focusing on NR SA scenarios.
-
Test Setup:
- No specific requirements for the test setup; the tool can be used in any Callbox configuration.
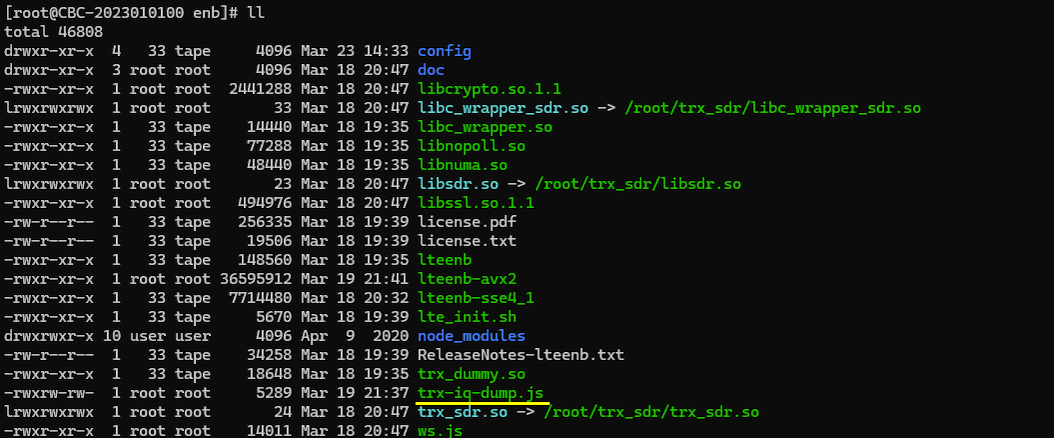
- The I/Q data capture script, trx-iq-dump.js, is located in the /root/enb directory.
-
Script Usage:
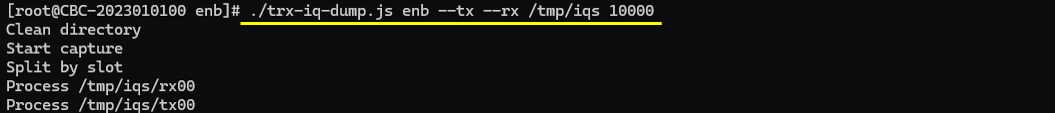
- The script is executed as ./trx-iq-dump.js [--tx|--rx] <host:[port]> <path> [duration in ms, default=1000].
- For capturing both downlink and uplink data, use the command ./trx-iq-dump.js enb --tx --rx /tmp/iqs 10000, which captures I/Q data for 10 seconds and stores it in /tmp/iqs.
- Ensure the target directory for saving I/Q data exists prior to running the script.
-
Test Procedure (IQ Dump on Callbox):
- Configure a NR SA cell and start the LTE service, preparing the environment for I/Q capture.
- Start the I/Q dump script just before powering on the UE or at any desired capture start time.
- Immediately after starting the script, power on the UE. The timing of UE power-on can be adjusted based on test requirements.
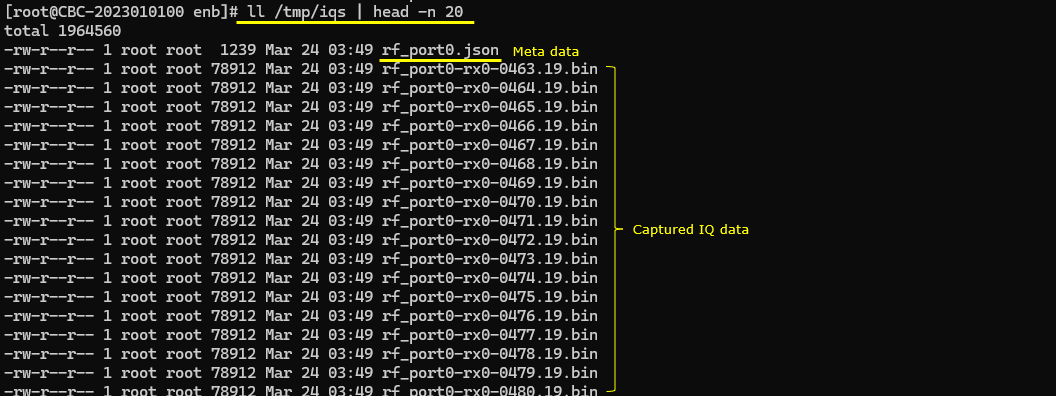
- After the capture duration, the specified directory (/tmp/iqs) will contain:
- JSON files (rf_port#.json) holding meta data and configuration information.
- Binary files (*.bin) for I/Q data, one per slot, with filenames indicating SFN and slot number.
-
Post Processing:
- No official post-processing script is provided due to varying user requirements, but a sample Python script is shared as an example.
- The example script (tested on Python 3.11.5 and Windows 11) provides a GUI for browsing and visualizing captured I/Q data.
- Users select the directory containing the I/Q files; the GUI lists all files and displays meta data from the JSON file.
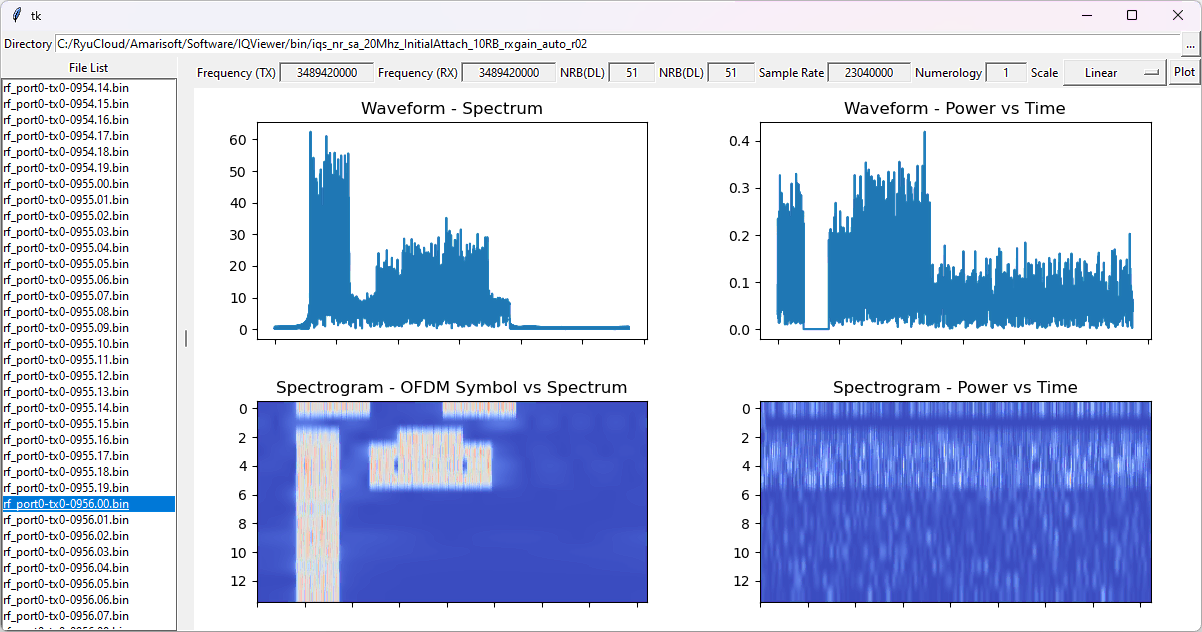
- Upon selecting a file, the script generates four plots:
- Waveform - Spectrum: FFT result for the entire slot (14 OFDM symbols).
- Waveform - Power vs Time: Magnitude of each sample point for the slot.
- Spectrogram - OFDM Symbols vs Spectrum: Data split into 14 blocks (one per OFDM symbol), FFT applied to each, and results shown in 2D dB scale.
- Spectrogram - Power vs Time: Data split into 14 blocks; magnitude plotted as a 2D image without FFT.
- Plots default to dB (log) scale; users can switch to linear scale via a combobox for alternate visualization.
- No advanced post-processing (e.g., synchronization, equalization, or CP removal) is performed in the provided script—only basic plotting is implemented.
Test Setup
You can use this tool in any test setup on Callbox. No specific requirement for test setup.
Script Location
For the purpose of capturing and saving I/Q for each slot in separate file, we provided a special script named trx-iq-dump.js which are located in the directory /root/enb
Usage
The usage of this script is simple as ./trx-iq-dump.js [--tx|--rx] <host:[port]> <path> [duration is ms, default=1000]

Test 1 : IQ dump on Callbox
In this test, I will show you how to collect IQ data both for DL and UL in NR SA.
Run LTE Service
Configure a NR SA cell in any way you like and run LTE service. In my case, I wanted to capture the I/Q data for the entire period from UE power-on through the completion of initial attach.
Run IQ dump
Right before UE power on (or at any time you want to start the capture), run IQ dump script as ./trx-iq-dump.js enb --tx --rx /tmp/iqs 10000. By this command, it will capture the IQ on 'enb' for both DL(--tx) and UL(--rx) for 10 seconds (10000 ms) and save the file in the directory /tmp/iqs. (
Right after the script run, power on UE. (
Once the data is captured, you would see the list of files stored in the specified directory (/tmp/iqs in this case). You would see rf_port#.json file where # indicates rf_port number). This json file contains meta data (fundamental configurations). *.bin file is the IQ data file. One file is created for every slot. The digits at the end of file name -abcd-nm indicates the SFN and slot number. 'abcd' indicates SFN and 'mn' indicates slot number.
Post Processing
Once you capture the channel data that you wanted, you can write your own script to post process it as you desire. We don't provide any post processing script in installation because the technical requirement for the post process would be different for every users. Instead, I would share an example of post processing script written in python for this tutorial. You can download it here. (I would not explain about the script itself). The Python version that I used is 'Python 3.11.5' and I tested this script on Windows 11. You may use this script as a template and extend it in anyway you like.
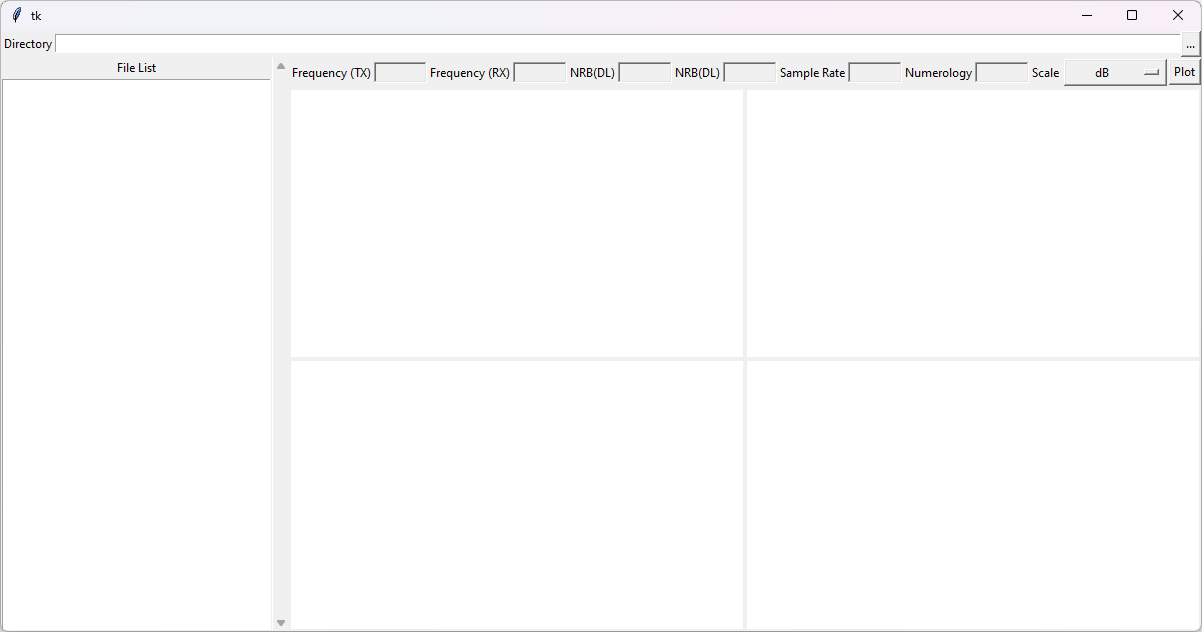
Once you run the script, you will get the initial GUI as shown below.
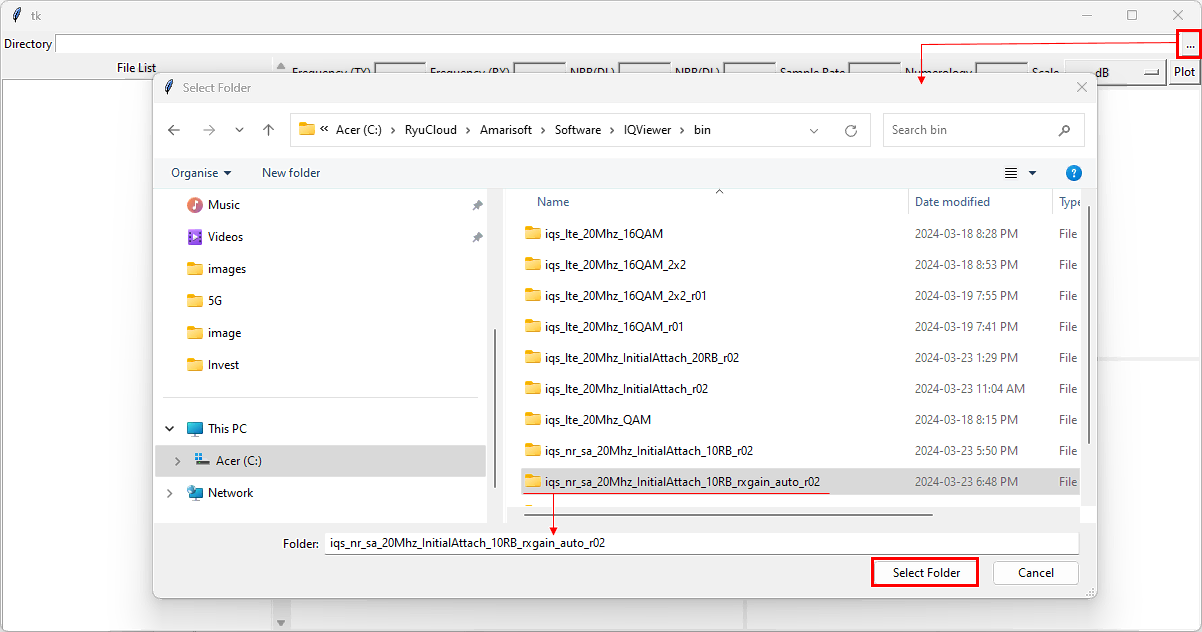
Hit [...] button to popup file browser dialog box. Select the directory that contains the IQ files (
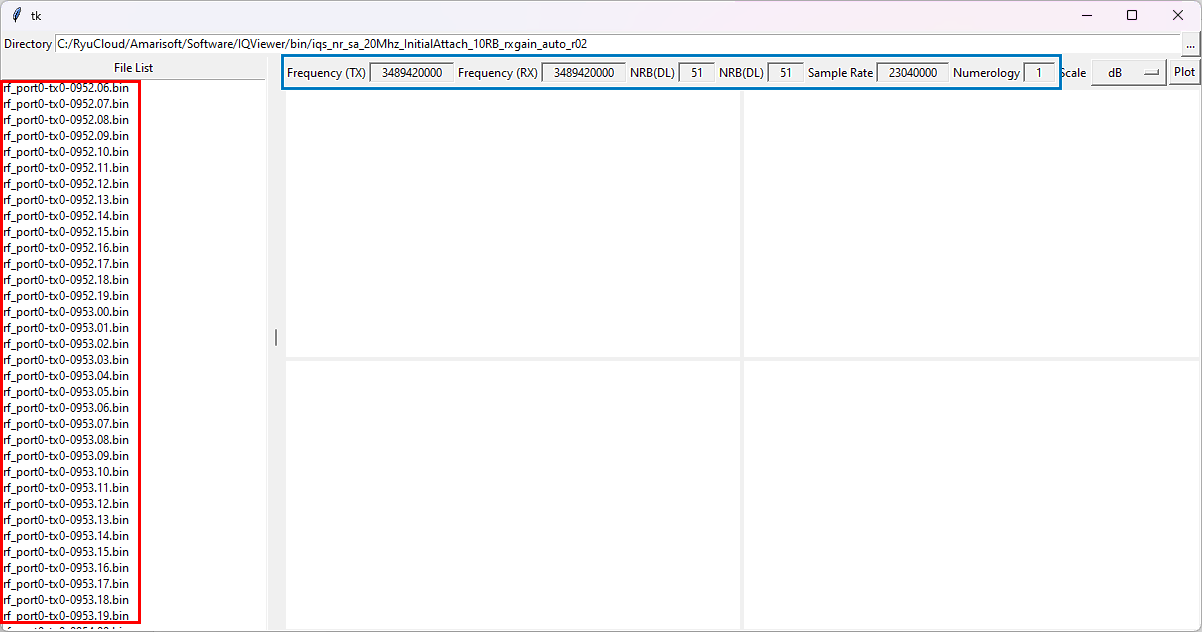
Then the File List box (listbox on the left) is populated with all the files in the selected directory and some basic information from the meta data file(*.json) is displayed in labels highlighted in blue rectangle.
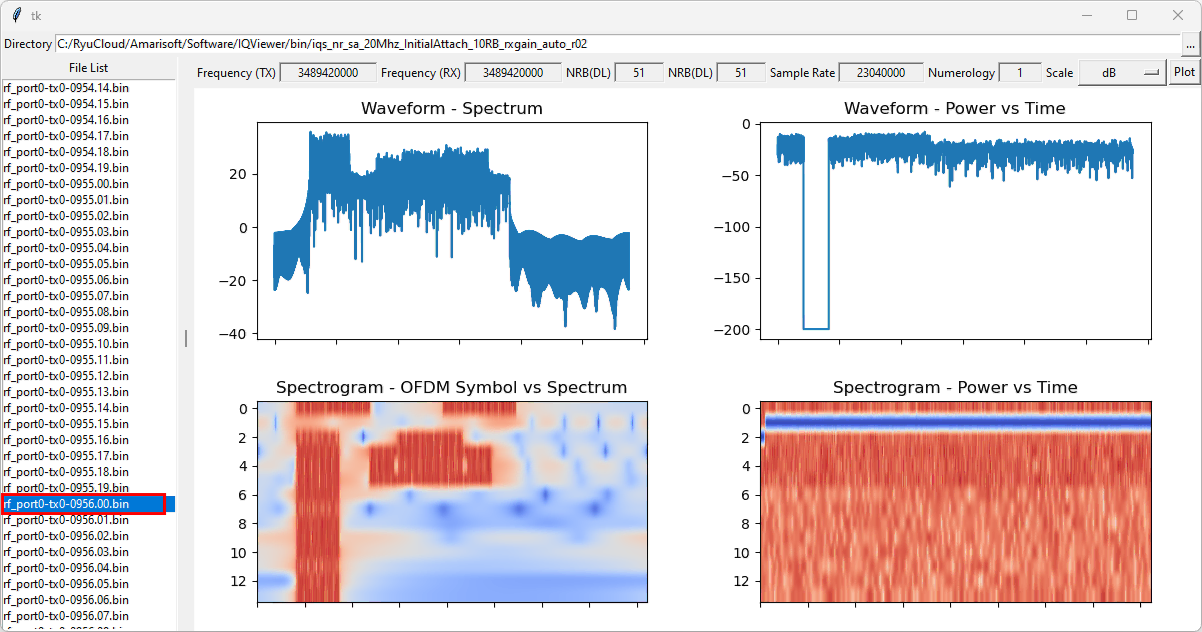
If you select one of the file name in the File List, four different plots for the I/Q data will be displayed. By default all the data is plotted in dB scale. I didn't do any other post processing like synchronization, equalization , CP removal etc. I just plotted the data in different ways. This is a brief description on each plot.
- Waveform - Spectrum : This is the result of FFT for the entire slot (i.e, I/Q data of 14 OFDM symbols).
- Waveform - Power vs Time : This is the result of magnitude of each sample point for the entire slot (i.e, I/Q data of 14 OFDM symbols).
- Spectrogram - OFDM Symbols vs Spectrum : Splitted the data into 14 blocks (each block corresponds to one OFDM symbol) , do FFT for each and every block and plot the result of the 14 FFT blocks in dB scale on 2D image. (
NOTE : Just splitting the data into 14 blocks with the same szie is not 100% accurate because the first OFDM symbol has a little bit longer CP than other OFDM symbol, but just for the spectrum analysis the current implementation would be good enough) - Spectrogram - Power vs Time : Splitted the data into 14 blocks (each block corresponds to one OFDM symbol) as above but does not do FFT for each block. Just calculate the magnitude of each sample point(a complex number) and plot the result on 2D image. (
NOTE : Just splitting the data into 14 blocks with the same size is not 100% accurate because the first OFDM symbol has a little bit longer CP than other OFDM symbol, but just for the spectrum analysis the current implementation would be good enough)
If you want to plot them in linear scale instead of log(dB) scale, select the 'Linear' from the [Scale] combobox.
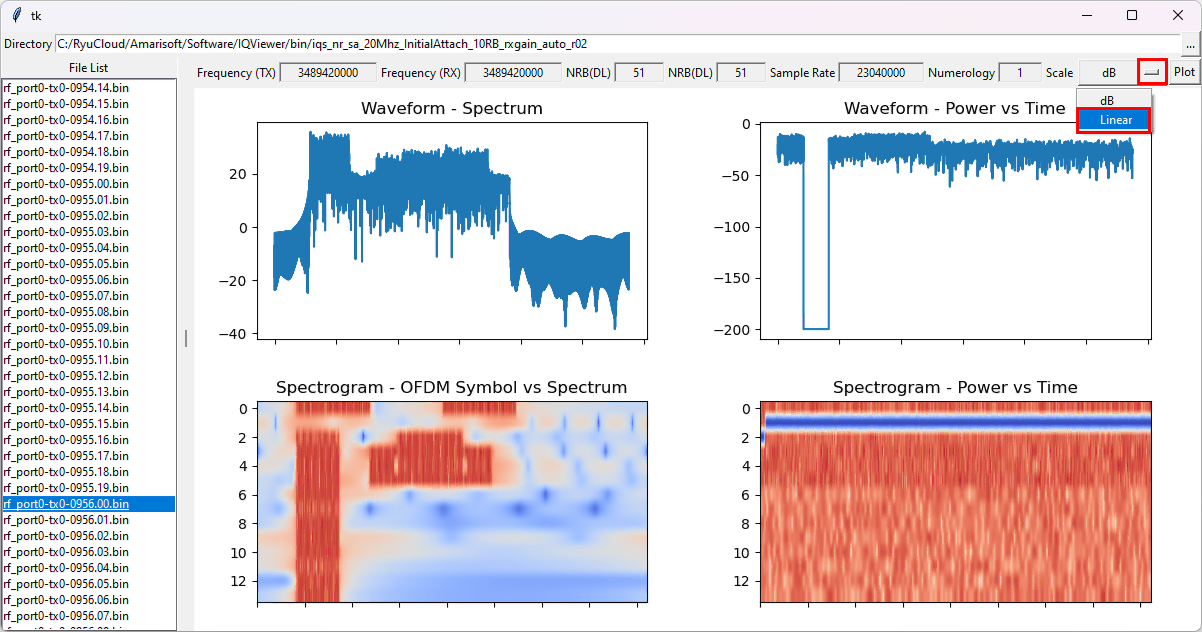
Then it plots the data in the same way as described above but in linear scale (i.e, not converting into dB (log) scale).