NR Max Throughput
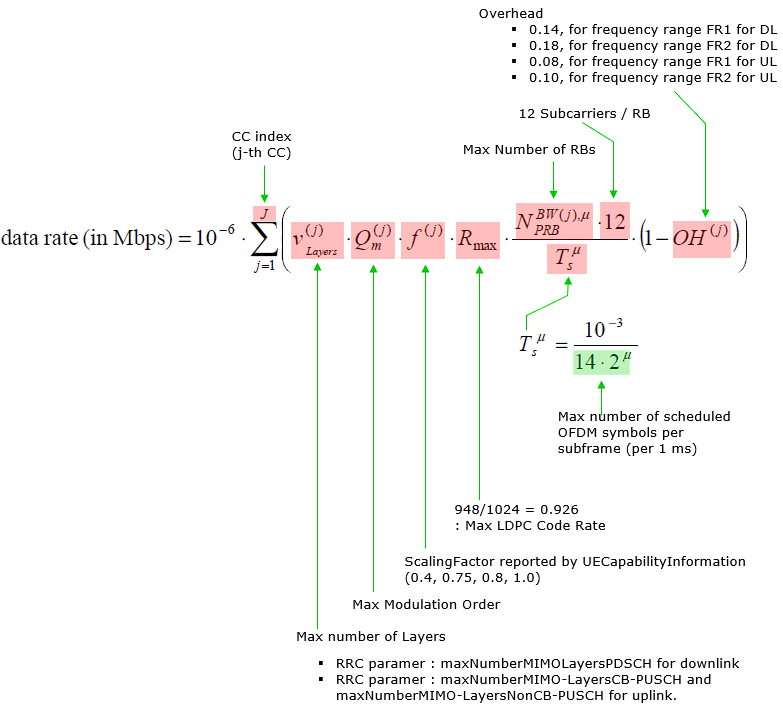
Unlike in LTE, estimation of expected max throughput is relatively straightforward. You would estimate LTE max throughput depending on UE category based on well defined table like 36.306 - Table 4.1A-1, but it is not that straightfoward in NR mainly because framestructure, subcarrier scheduling, possibility of partial slot schedule, dmrs configuration etc. One suggested method of max throughput estimation with a certain condition is to use a formula shown below.
< 38.306 - 4.1.2 Supported max data rate for DL/UL >

What you need to notice from this formula is what are the factors affecting the throughput. Just directly reading from the formula, you can list those factors as shown below.
- Number of Carriers (in case of Carrier Aggregation)
- Number of Layers
- Modulation Scheme
- Max Code Rate
- Scheduled OFDM symbols per subframe
- Overhead
- Scaling Factor
- TDD UL-DL Pattern
- DMRS Configuration (e.g, DMRS symbol length, Number of Additional DMRS, Configuration Type)
- PUCCH format and CSI/HARQ report mechanism
Table of Contents
- NR Max Throughput
SA TDD 1CC 100Mhz 4x4 addpos 1
This is to show the configuration for Single Cell SA TDD maximum throughput. Around 1.7 Gbps was achieved with 4x4 MIMO and DMRS addpos 1.
This test was done by this configuration : gnb-sa-max-tput_100Mhz_4x4_addpos_1_pucch3.cfg. Highlights of the configuration is as shown below. Highlights of the configuration is as shown below. Here NR_BANDWIDTH is set to 100Mhz, N_ANTENNA_DL is set to 4 (i.e, 4x4 MIMO).
|
#define NR_BANDWIDTH 100 // NR cell bandwidth #define N_ANTENNA_DL 4 // Values: 1 (SISO), 2 (MIMO 2x2), 4 (MIMO 4x4) #define N_ANTENNA_UL 1 // Values: 1, 2, 4 #define NR_LONG_PUCCH_FORMAT 3 // Values: 2, 3, 4
pattern1: { period: 5, /* in ms */ dl_slots: 8, dl_symbols: /* 6 */ 2, ul_slots: 1, ul_symbols: 2, },
pucch3: { bpsk: false, additional_dmrs: false, freq_hopping: true, n_prb: 1, simultaneous_harq_ack_csi: true, max_code_rate: 0.25, },
pdsch: { mapping_type: "typeA", dmrs_add_pos: 1, dmrs_type: 1, dmrs_max_len: 1, /* k0 delay in slots from DCI to PDSCH: automatic setting */ /* k1 delay in slots from PDSCH to PUCCH/PUSCH ACK/NACK: automatic setting */ mcs_table: "qam256", rar_mcs: 2, si_mcs: 9, /* If defined, force the PDSCH MCS for all UEs. Otherwise it is computed * based on DL channel quality estimation */ /* mcs: 24, */ }, |
When you want to achieve high throughput, it is strongly recommended to visualize your configuration in terms of resource allocation and possible scheduling and have some rough estimate first. It would not be easy to consider every possible details affecting the throughput in the illustration, but it would be helpful if you can visualize at least slot and symbol allocation and mark possible overhead in terms of throughput. (e.g, PBCH, PDCCH, DMRS etc)

Following is the output from test setup in Amarisoft. (

NSA TDD 1CC 100Mhz 4x4 addpos 1
This is to show the configuration for Single Cell NSA TDD maximum throughput. Around 2 Gbps(1.7Gb in NR + 0.4Gb in LTE) was achieved with 4x4 MIMO and DMRS addpos 1.
This test was done by this configuration : gnb-nsa-max-tput_100Mhz_4x4_addpos_1_pucch3.cfg. Highlights of the configuration is as shown below. Here NR_BANDWIDTH is set to 100Mhz, N_ANTENNA_DL is set to 4 (i.e, 4x4 MIMO).
|
#define NR_BANDWIDTH 100 // NR cell bandwidth #define N_ANTENNA_DL 4 // Values: 1 (SISO), 2 (MIMO 2x2), 4 (MIMO 4x4) #define N_ANTENNA_UL 1 // Values: 1, 2, 4 #define NR_LONG_PUCCH_FORMAT 3 // Values: 2, 3, 4
pattern1: { period: 5, /* in ms */ dl_slots: 8, dl_symbols: 2, ul_slots: 1, ul_symbols: 2, },
pucch3: { bpsk: false, additional_dmrs: false, freq_hopping: true, n_prb: 1, simultaneous_harq_ack_csi: true, max_code_rate: 0.25, },
pdsch: { mapping_type: "typeA", dmrs_add_pos: 1, dmrs_type: 1, dmrs_max_len: 1, /* k0 delay in slots from DCI to PDSCH: automatic setting */ /* k1 delay in slots from PDSCH to PUCCH/PUSCH ACK/NACK: automatic setting */ mcs_table: "qam256", rar_mcs: 2, si_mcs: 9, /* If defined, force the PDSCH MCS for all UEs. Otherwise it is computed * based on DL channel quality estimation */ /* mcs: 24, */ }, |
When you want to achieve high throughput, it is strongly recommended to visualize your configuration in terms of resource allocation and possible scheduling and have some rough estimate first. It would not be easy to consider every possible details affecting the throughput in the illustration, but it would be helpful if you can visualize at least slot and symbol allocation and mark possible overhead in terms of throughput. (e.g, PBCH, PDCCH, DMRS etc)

Following is the output from test setup in Amarisoft. (

Possible Further Improvement
One possible improvement you can make would be to set dmrs_add_pos: 0. Then you would get less overhead by DMRS as illutrated below. It would give you around 10% of increased throughput. (
